
The First Step to Replanning in a Downturn
When market conditions worsen and there’s a gap between your current revenue plan and what your sales team can deliver, you need to build a credible and realistic replan. Introducing a replan can feel like pulling the handbrake on your team’s goals and expectations, but if you execute it properly, you can help them hit their new numbers and feel part of a winning team again. So what’s the first step to getting it right?
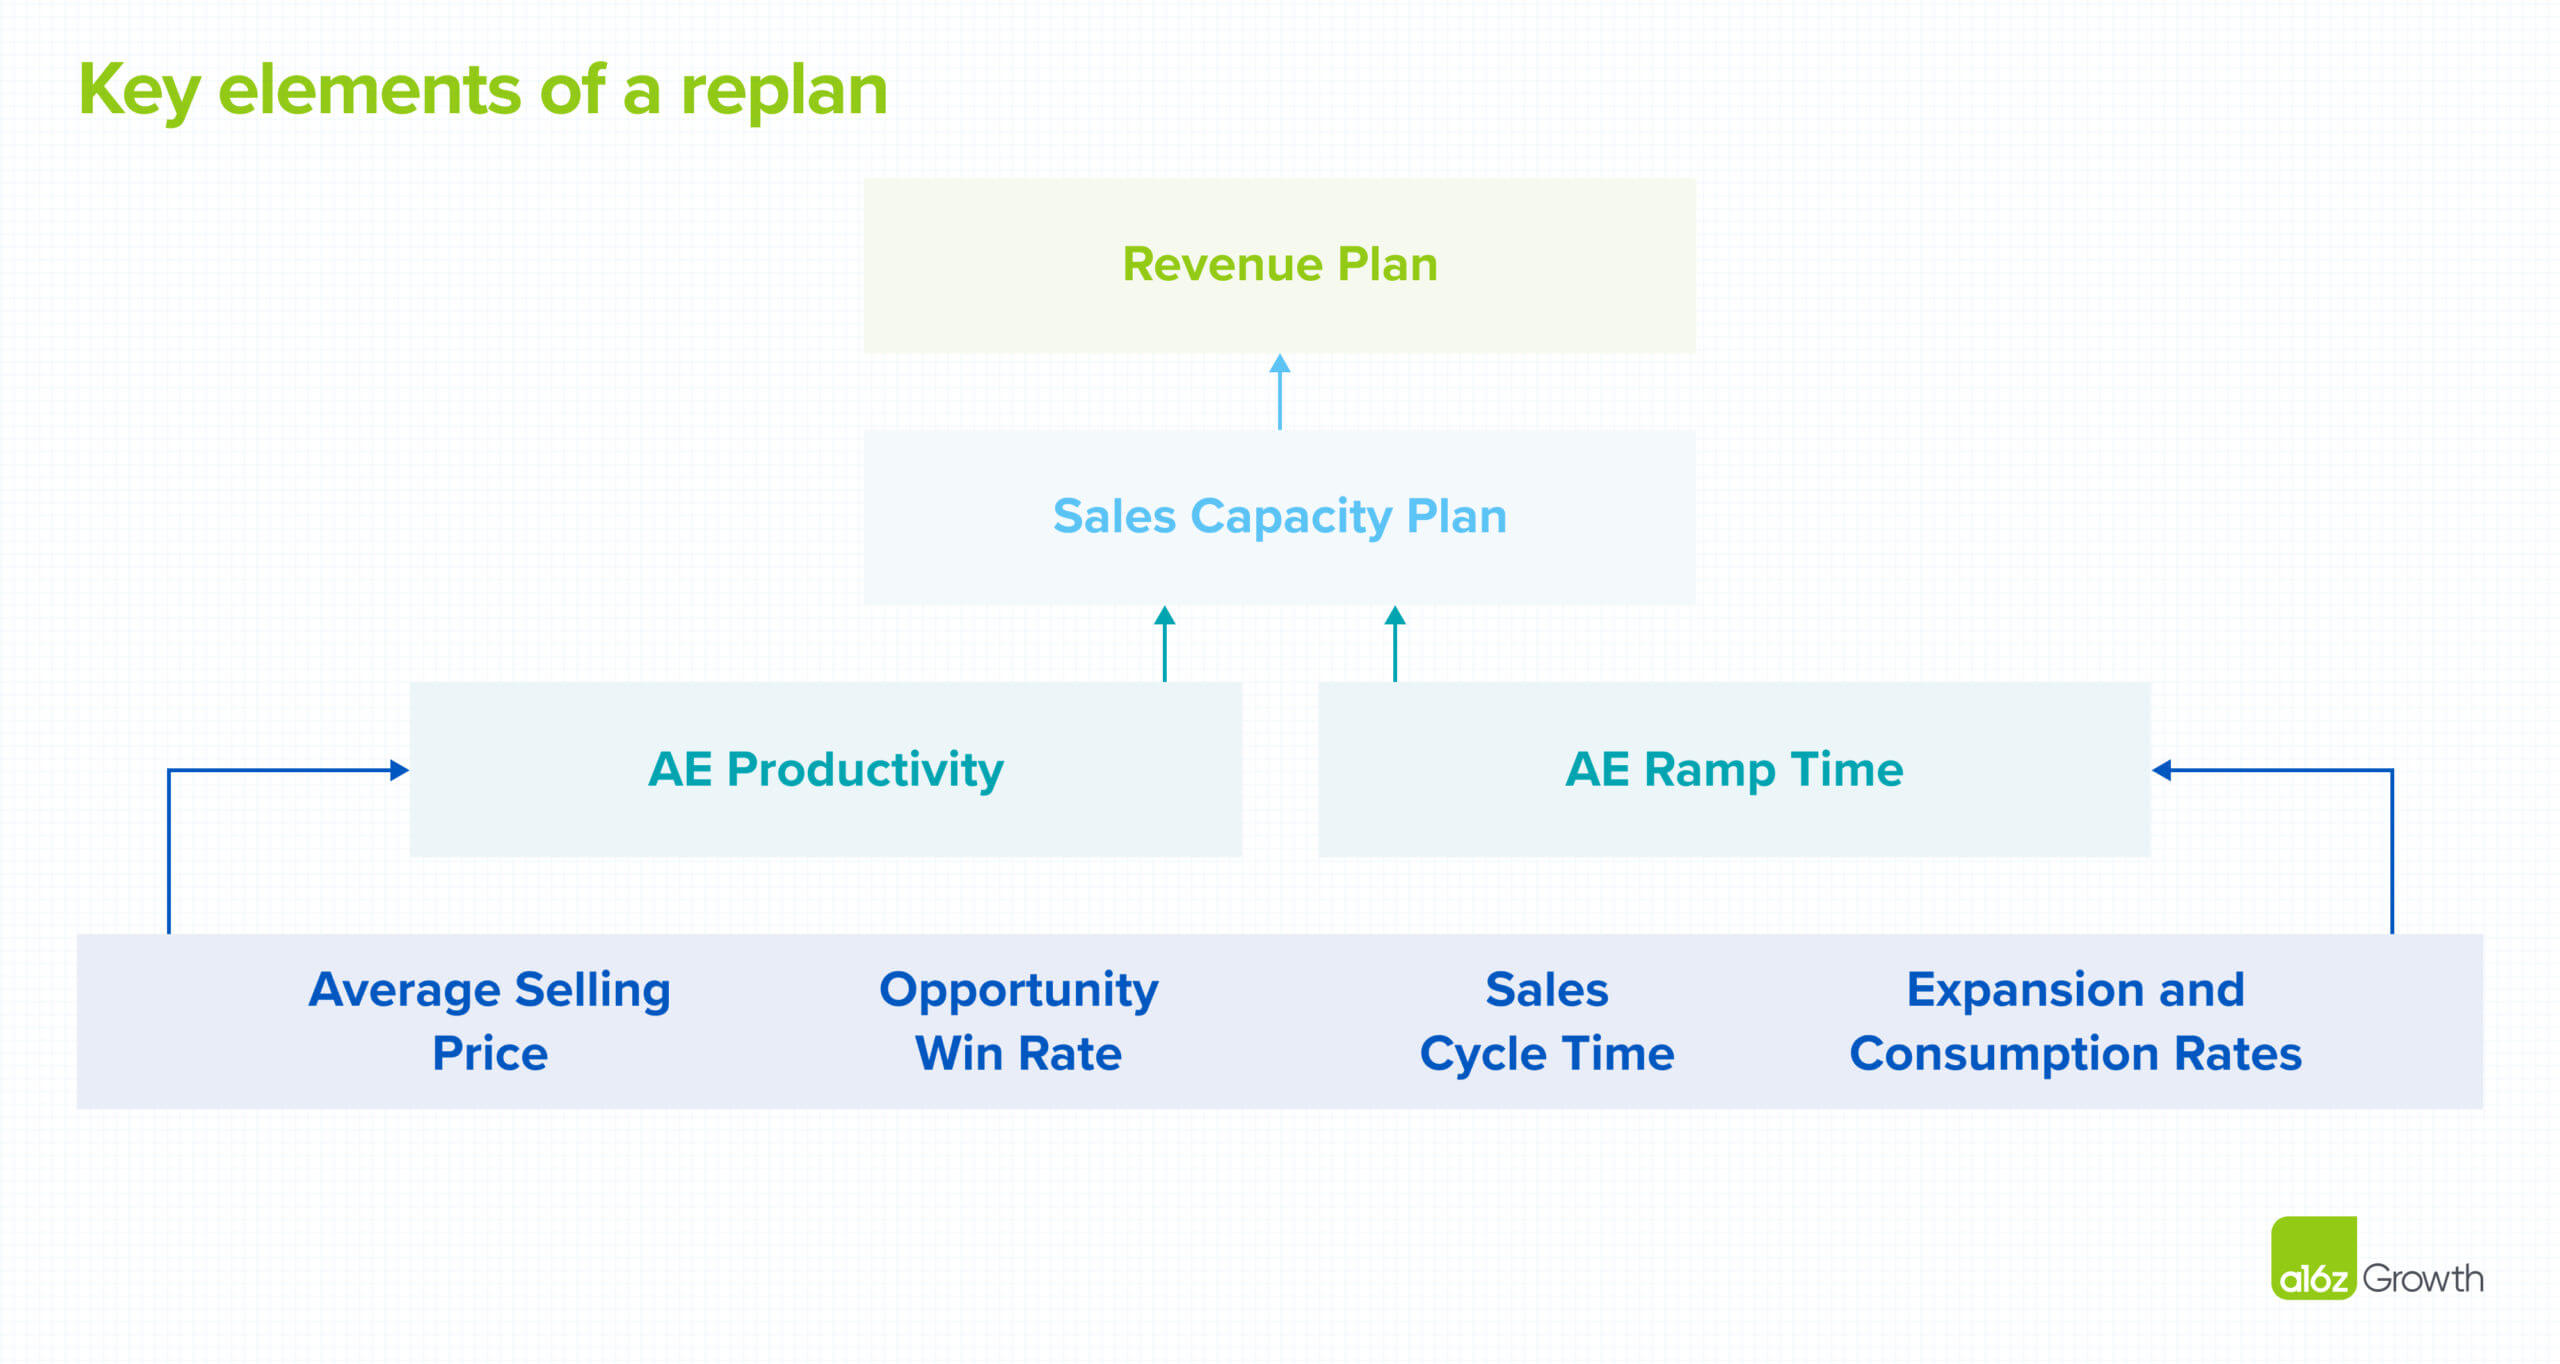
Revisiting—and, if necessary, revising—your assumptions about account executive (AE) productivity and ramp time.
Though many companies skip over the nitty-gritty analysis required to reassess these assumptions, the devil is in the details. AE productivity and ramping levels are key inputs into your sales capacity plan, which underwrites the revenue plan of most B2B software companies, and they’re both particularly sensitive to economic headwinds. Revisiting the assumptions you’re making about these inputs when replanning allows you to more accurately forecast the overall capacity of your team—giving them a much more reasonable shot at beating their targets and, ultimately, realigning your business with your strategic plan.
TABLE OF CONTENTS
Choosing and inspecting the right KPIs
TABLE OF CONTENTS
In order to figure out whether you need to adjust the AE productivity and ramping levels in your sales capacity model, you need to identify the most reliable key performance indicators (KPIs) for both of these inputs.
While key KPIs vary from business to business, the most common KPIs for subscription-based businesses selling committed spend agreements tend to be:
- average selling price (ASP),
- opportunity win rate,
- sales cycle time, and
- expansion or consumption rates
A quick aside: consumption-based businesses also need to revisit their assumptions when replanning in a downturn and will likely use expansion/consumption rates as a KPI. Their planning methodology and other KPIs will differ from what we’ve outlined for a range of reasons too complex to discuss here, but the process we’re recommending is still applicable.
Assessing whether these KPIs hold up against market conditions isn’t as easy as pulling a report on each of these indicators. Instead, we recommend using the below rules of thumb to spot trends in your KPI performance.
- Use 18+ months of history, grouped by quarter or month (dictated by velocity/volume of sales cycles).
- At a minimum, analyze each sales segment independently. Depending on your scale, you may consider doing the same for each global region. The more precise your analysis, the more stock you can place in whatever trends you observe. Be sure to balance these time-intensive efforts against your planning team’s capacity.
- Adjust for outliers that can skew mean averages. A common example is a couple of “whale” deals that might suggest an upward trend in ASP during the period. You can adjust for this by comparing medians for each period or manually removing those outliers.
- Compare the average trend over the past 2 quarters with those of the periods prior. Pay particular attention to like-for-like quarters and months, since seasonality can misinform your observations. For example, comparing average KPI values in H2’22 with those of H2’21, instead of those of H1’22, will likely yield more reliable comparisons.
TABLE OF CONTENTS
Revising AE productivity and ramp level assumptions
TABLE OF CONTENTS
If your KPIs have meaningfully shifted over the past 18 months, does that necessarily mean you should decrease your AE productivity and increase ramp time assumptions? This is a judgment call your planning team needs to make, but there are some additional guidelines to consider as you lock in your replanning assumptions:
- If only one of your KPIs has trended ~10% lower over the past 2 quarters, then you may opt to hold off on changing assumptions that proved reliable in past years. It’s likely not necessary to over-rotate on a small deviation in a single metric.
- However, if one of your KPIs has decreased by considerably more than 10%, or if multiple KPIs have trended negatively over the past 2 quarters, then you should alter your planning assumptions.
TABLE OF CONTENTS
What’s next?
TABLE OF CONTENTS
If you decide your KPIs do indicate a broader trend that you need to account for in your replan, you’ll then need to remodel both your AE productivity and ramping assumptions into a revised sales capacity model. Before you take that revised sales capacity model to your team, you’ll also need to revisit your pipeline plan to make sure it can support this revised capacity. And, like we mentioned, if you’re running a consumption-based business, your assessment process will look similar to the one we’ve outlined here, but you’ll have different KPIs and a different planning process.
That said, recalibrating the assumptions that feed into your sales capacity model is a critical first step toward getting your sales team back on track and feeling like they’re marching toward the same—winnable!—goal.


- Customers Want Predictability in Usage-based Pricing. Here’s How to Help Them Get It.
- How Do I Build a Usage-based Sales Compensation Plan?
- Overages: The Overlooked Problem in Usage-based Pricing (and How to Fix It)
- Sales–Product Tension: The Secret to Segment’s Success
- Usage-Based Pricing Is Popular, But Is It Right For You? Our Rule of Thumb