Energy
Map: The Countries With the Most Oil Reserves
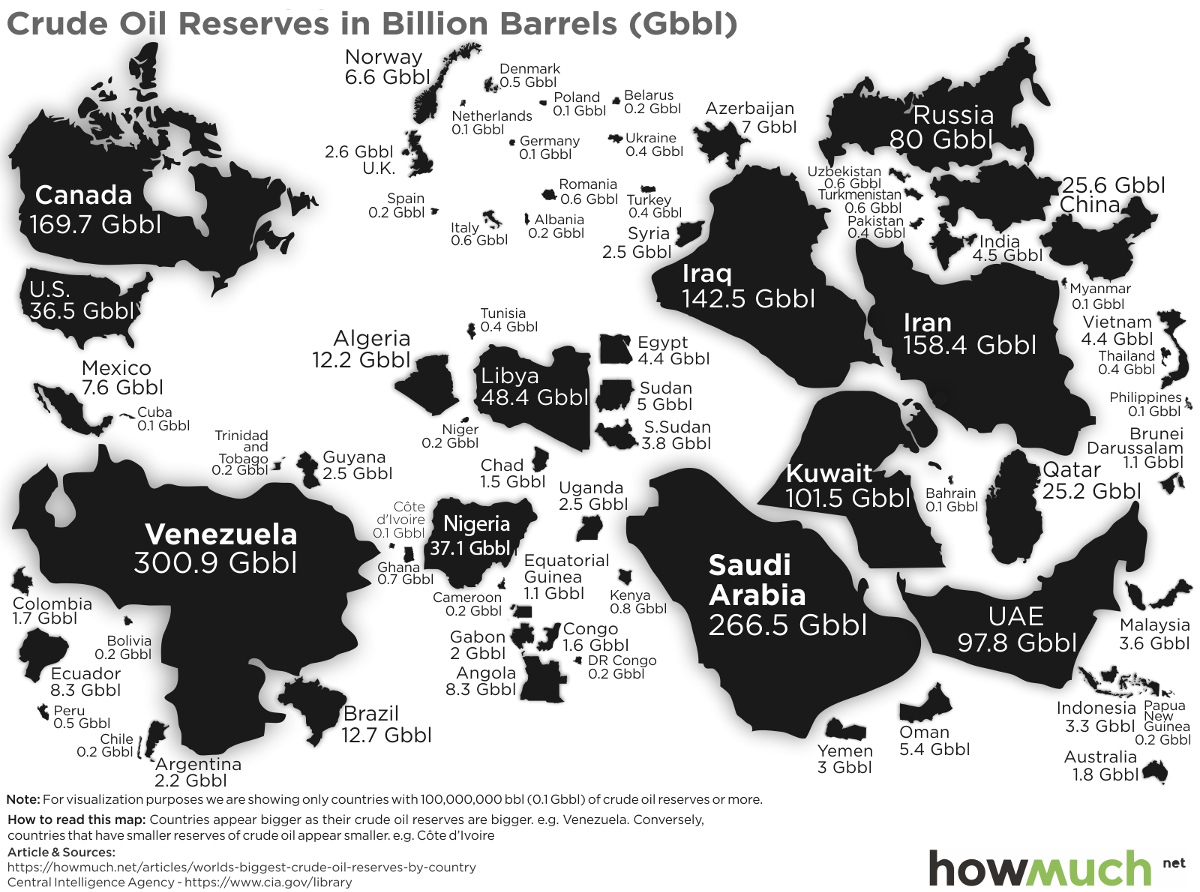
Map: The Countries With the Most Oil Reserves
There’s little doubt that renewable energy sources will play a strategic role in powering the global economy of the future.
But for now, crude oil is still the undisputed heavyweight champion of the energy world.
In 2018, we consumed more oil than any prior year in history – about 99.3 million barrels per day on a global basis. This number is projected to rise again in 2019 to 100.8 million barrels per day.
The Most Oil Reserves by Country
Given that oil will continue to be dominant in the energy mix for the short and medium term, which countries hold the most oil reserves?
Today’s map comes from HowMuch.net and it uses data from the CIA World Factbook to resize countries based on the amount of oil reserves they hold.
Here’s the data for the top 15 countries below:
| Rank | Country | Oil Reserves (Barrels) |
|---|---|---|
| #1 | 🇻🇪 Venezuela | 300.9 billion |
| #2 | 🇸🇦 Saudi Arabia | 266.5 billion |
| #3 | 🇨🇦 Canada | 169.7 billion |
| #4 | 🇮🇷 Iran | 158.4 billion |
| #5 | 🇮🇶 Iraq | 142.5 billion |
| #6 | 🇰🇼 Kuwait | 101.5 billion |
| #7 | 🇦🇪 United Arab Emirates | 97.8 billion |
| #8 | 🇷🇺 Russia | 80.0 billion |
| #9 | 🇱🇾 Libya | 48.4 billion |
| #10 | 🇳🇬 Nigeria | 37.1 billion |
| #11 | 🇺🇸 United States | 36.5 billion |
| #12 | 🇰🇿 Kazakhstan | 30.0 billion |
| #13 | 🇨🇳 China | 25.6 billion |
| #14 | 🇶🇦 Qatar | 25.2 billion |
| #15 | 🇧🇷 Brazil | 12.7 billion |
Venezuela tops the list with 300.9 billion barrels of oil in reserve – but even this vast wealth in natural resources has not been enough to save the country from its recent economic and humanitarian crisis.
Saudi Arabia, a country known for its oil dominance, takes the #2 spot with 266.5 billion barrels of oil. Meanwhile, Canada and the U.S. are found at the #3 (169.7 billion bbls) and the #11 (36.5 billion bbls) spots respectively.
The Cost of Production
While having an endowment of billions of barrels of oil within your borders can be a strategic gift from mother nature, it’s worth mentioning that reserves are just one factor in assessing the potential value of this crucial resource.
In Saudi Arabia, for example, the production cost of oil is roughly $3.00 per barrel, which makes black gold strategic to produce at almost any possible price.
Other countries are not so lucky:
| Country | Production cost (bbl) | Total cost (bbl)* |
|---|---|---|
| 🇬🇧 United Kingdom | $17.36 | $44.33 |
| 🇧🇷 Brazil | $9.45 | $34.99 |
| 🇳🇬 Nigeria | $8.81 | $28.99 |
| 🇻🇪 Venezuela | $7.94 | $27.62 |
| 🇨🇦 Canada | $11.56 | $26.64 |
| 🇺🇸 U.S. shale | $5.85 | $23.35 |
| 🇳🇴 Norway | $4.24 | $21.31 |
| 🇺🇸 U.S. non-shale | $5.15 | $20.99 |
| 🇮🇩 Indonesia | $6.87 | $19.71 |
| 🇷🇺 Russia | $2.98 | $19.21 |
| 🇮🇶 Iraq | $2.16 | $10.57 |
| 🇮🇷 Iran | $1.94 | $9.09 |
| 🇸🇦 Saudi Arabia | $3.00 | $8.98 |
Even if a country is blessed with some of the most oil reserves in the world, it may not be able to produce and sell that oil to maximize the potential benefit.
Countries like Canada and Venezuela are hindered by geology – in these places, the majority of oil is extra heavy crude or bitumen (oil sands), and these types of oil are simply more difficult and costly to extract.
In other places, obstacles are are self-imposed. In some countries, like Brazil and the U.S., there are higher taxes on oil production, which raises the total cost per barrel.


Who’s Building the Most Solar Energy?
This was originally posted on our Voronoi app. Download the app for free on iOS or Android and discover incredible data-driven charts from a variety of trusted sources.
In 2023, solar energy accounted for three-quarters of renewable capacity additions worldwide. Most of this growth occurred in Asia, the EU, and the U.S., continuing a trend observed over the past decade.
In this graphic, we illustrate the rise in installed solar photovoltaic (PV) capacity in China, the EU, and the U.S. between 2010 and 2022, measured in gigawatts (GW). Bruegel compiled the data..
Chinese Dominance
As of 2022, China’s total installed capacity stands at 393 GW, nearly double that of the EU’s 205 GW and surpassing the USA’s total of 113 GW by more than threefold in absolute terms.
| Installed solar capacity (GW) | China | EU27 | U.S. |
|---|---|---|---|
| 2022 | 393.0 | 205.5 | 113.0 |
| 2021 | 307.0 | 162.7 | 95.4 |
| 2020 | 254.0 | 136.9 | 76.4 |
| 2019 | 205.0 | 120.1 | 61.6 |
| 2018 | 175.3 | 104.0 | 52.0 |
| 2017 | 130.8 | 96.2 | 43.8 |
| 2016 | 77.8 | 91.5 | 35.4 |
| 2015 | 43.6 | 87.7 | 24.2 |
| 2014 | 28.4 | 83.6 | 18.1 |
| 2013 | 17.8 | 79.7 | 13.3 |
| 2012 | 6.7 | 71.1 | 8.6 |
| 2011 | 3.1 | 53.3 | 5.6 |
| 2010 | 1.0 | 30.6 | 3.4 |
Since 2017, China has shown a compound annual growth rate (CAGR) of approximately 25% in installed PV capacity, while the USA has seen a CAGR of 21%, and the EU of 16%.
Additionally, China dominates the production of solar power components, currently controlling around 80% of the world’s solar panel supply chain.
In 2022, China’s solar industry employed 2.76 million individuals, with manufacturing roles representing approximately 1.8 million and the remaining 918,000 jobs in construction, installation, and operations and maintenance.
The EU industry employed 648,000 individuals, while the U.S. reached 264,000 jobs.
According to the IEA, China accounts for almost 60% of new renewable capacity expected to become operational globally by 2028.
Despite the phasing out of national subsidies in 2020 and 2021, deployment of solar PV in China is accelerating. The country is expected to reach its national 2030 target for wind and solar PV installations in 2024, six years ahead of schedule.

-

 Markets5 days ago
Mapped: The Most Valuable Company in Each Southeast Asian Country
-

 Markets2 weeks ago
The Top Private Equity Firms by Country
-

 Jobs2 weeks ago
The Best U.S. Companies to Work for According to LinkedIn
-

 Economy2 weeks ago
Ranked: The Top 20 Countries in Debt to China
-

 Politics1 week ago
Charted: Trust in Government Institutions by G7 Countries
-

 Energy1 week ago
Mapped: The Age of Energy Projects in Interconnection Queues, by State
-

 Mining1 week ago
Visualizing Global Gold Production in 2023
-

 Markets1 week ago
Visualized: Interest Rate Forecasts for Advanced Economies