How much should home prices fall based on recent changes in interest rates?
I wanted to do a bit of math to see how much home prices need to fall in order to meet affordability criteria in a higher interest rate regime. Partly it’s for personal interest, as I bought a house during the pandemic and I’m curious how much I’m underwater, but also because I’m going through several asset classes to see how the new rate environment is likely to affect them.
TL;DR – I think home prices need to fall by about 21%, relative to April 2021, based on the changes in mortgage rates.
Housing affordability as the driver of prices
I used housing affordability as the determinant for this analysis, following the adage that “the price is whatever the market is willing to bear.” Housing prices are a function of affordability. Affordability is a function of household income, cost of borrowing (mortgage rates), and other debts.
In the U.S., most people buy houses using a specialized type of debt instrument called a “mortgage.” I assume that home prices are mostly a function of the rate available on what’s called a “conforming” 30-year, fixed-rate mortgage loan. Mortgage rates are maybe the interest rate most closely followed by ordinary people in the U.S., since many people are homeowners, and the monthly mortgage payment is the largest single cash outlay for these folks.
How much you can afford to pay for a house depends on how big of a mortgage you can get, and what rate you have to pay on that mortgage.
How banks determine mortgage amounts and rates
Banks use a “debt-to-income,” or DTI, ratio to determine how much they will lend to a borrower in order to buy a house. This number is usually about 36%, meaning that after taking a mortgage payment and all other debt-like payments into account (student loans, auto loans, child support, etc.), this debt burden should not exceed 36% of a person’s monthly income. The second constraint that banks generally enforce on how much they lend is a limit of 80% on the purchase price of the house, so a bank will lend up to $400,000 on the purchase of a house valued at $500,000. The remaining 20% is paid in cash by the borrower and is called a “down-payment.”
Mortgage rates can be conceptually decomposed into smaller pieces, in the same way a five-story building can be decomposed into five individual floors. In the case of a mortgage, these five components are:
1) The short-term risk-free rate
2) The term premium
3) The Treasury-MBS spread (in the U.S.)
4) The primary-secondary spread
5) A credit spread based on the borrower’s creditworthiness
The short-term risk-free rate is usually the main benchmark rate targeted by the central bank. In the U.S., this is the fed funds rate, currently trading in a range of 4.75-5%. One could argue that since hardly anyone trades in the fed funds market these days, we should something like SOFR or IOER as the conceptual risk-free rate, but for the purposes of this analysis it doesn’t matter since they’re only a few basis points apart and don’t affect the big picture conclusions.
The term premium refers to the variance in interest rates based on the time period the borrower wants to borrow money for. Borrowing money for long periods of time is riskier than borrowing money for short periods of time, because the future is uncertain, so long-term interest rates are usually higher than short-term interest rates. However, the term premium for most longer maturities is negative right now, in part because the market expects the Fed to cut rates in response to a recession. The overnight rate to 7-year UST term premium is currently about -1.46%. The 7-year rate on government bonds is relevant because they have a similar interest rate sensitivity (duration) to freshly-created mortgage-backed securities.
The Treasury-MBS spread is the difference in the interest rate on government bonds (considered nearly risk-free) and mortgage-backed securities, a type of bond composed of payment streams from individual borrower’s mortgage loans. The MBS market is critical in U.S. housing finance. In general, the weirder and riskier a debt instrument is, the larger its spread over a corresponding government bond will be. MBS are low in credit risk but high in interest rate risk. The par yield on MBS is currently around 5%, while the 7-year UST rate is about 3.38%, giving a spread of ~160 bps.
The primary-secondary spread is the difference between where a bank “borrows” money for mortgages and where it lends to actual borrowers and can be thought of as a component of its profit on its mortgage business. The bank’s borrowing cost is simply the yield on a par MBS (currently ~5%). The rate a bank lends at varies, but I like to use Bankrate’s daily average as a proxy. It’s currently 6.70%, giving a primary-secondary spread of ~170 basis points. This is really high based on my experience (I used to trade MBS for the New York Fed). Banks claim that “capacity constraints” drive this number but I can say that many of my colleagues at FRBNY never entirely bought this argument.
The borrower’s credit spread is the final component. This can be influenced by the borrower’s credit score, the size of the down payment on the house, and other factors. For the purposes of this analysis, I assume the borrower has pristine credit and that this number is zero.
Here’s the information summarized in a table:
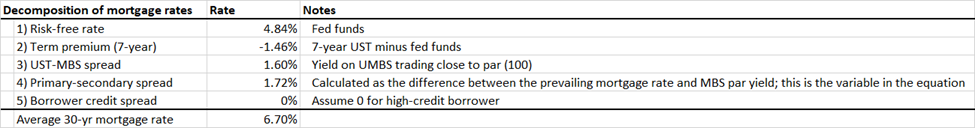
As you can see, any of these numbers changing can influence the final rate the borrower faces.
Home prices need to decline by 21% for the market to “clear” based on affordability
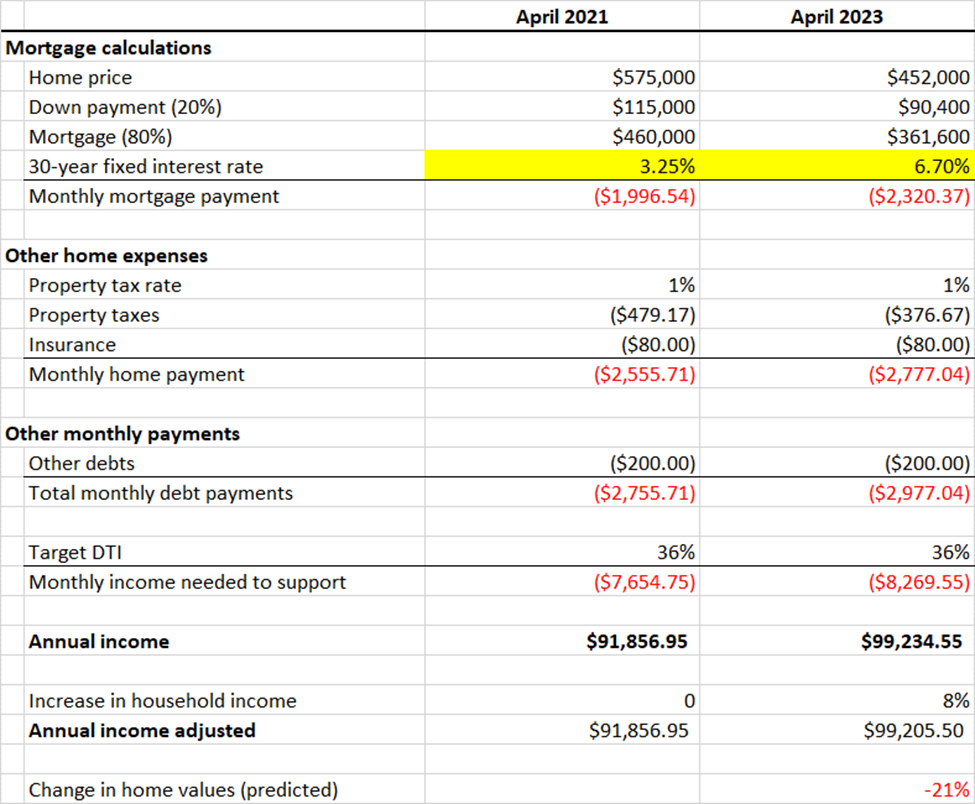
To do this analysis, I started with a home price in April 2021[1]($575,000) and figured out how much annual income a borrower would have needed at that time to buy the house (~$92,000). I then adjusted the annual income up by 8% for 2023, extrapolating from this, resulting in a person that would have earned ~$92,000 earning $99,205 today. Then I calculated how much house a person earning $99,205 can afford today at a mortgage rate of 6.70% ($452,000). Divide the two and you get a decrease of 21%.
What’s the worst-case scenario for housing?
Let’s go back to the decomposition of mortgage rates. How much higher can mortgage rates go? Let’s make some assumptions here on terminal fed funds and the term premium.
Some people have been saying that the Fed hasn’t succeeded in quelling inflation in the past until it has raised fed funds above CPI. The latest annualized CPI print was about 6%, so let’s say the Fed has to hike up to the 6-6.25% range for fed funds. Let’s also say that the market realizes the Fed is not going to cut and the curve steepens to historical norms. Some rough Excel math says that 3m-7y UST has averaged about 150 bps since 1982, so just to outline this worst-case scenario, let’s say this long-term average holds. Let’s say there are no changes in the MBS spread, primary-secondary spread, and credit charges. That gives us:

Let’s say all this happens over two years. How would this affect home prices?

-39%. Ouch.
Why the market doesn’t reflect this reality—yet
Leaving aside the worst-case scenario (by definition, the worst-case scenario can’t be the base case), I don’t expect housing prices to crater tomorrow. The main reason for this is a cognitive bias called loss aversion, which basically says that people hate losing money more than they like making it. Homeowners are unlikely to accept that the “fair market value” of homes based on affordability are 20% less than what they paid, which would essentially wipe out their down payments.
This article suggests that home prices in Austin went down by around 7% over the past year or so, which would imply that we have another ~15% in declines to come. Add to this that some of the hottest real estate markets from 2021 like Austin, SF, and Miami are also heavily exposed collapsing sectors like tech and crypto, and it’s possible that my 21% estimate is too optimistic for these cities because my income growth assumptions are too generous. As layoffs accelerate, we should see income stability and income growth affect negatively demand and affordability, respectively.
We also ought to see a difference between new home sales (where builders don’t have to lock in losses) and existing home sales, and also recently purchased homes and homes purchased well before the pandemic. My guess is that builders will be more willing to move inventory, even at reduced margins. It’s the people that bought closest to the peak, in the hottest markets, that will be the most reluctant to sell at market-clearing prices.
The bright side for people like me that bought at the peak
Inflation!
Yes, inflation. Inflation is good for debtors because it destroys the nominal value of debt. If I owe $400,000 on a fixed-rate mortgage, I owe $400,000 whether inflation continues on at 6% or inflation follows a bastard-child-of-Weimar Germany-and-Zimbabwe trajectory. In the latter case, assuming my wages keep pace with inflation, high inflation basically becomes a get-out-of-debt-free card.
I’ll discuss financial repression in another post, but I’ll just say that this is how I think over-indebtedness in the government, corporate and personal sector is going to get solved over the next 30 years.
[1] Percentage price changes are always relative to a specific point in time. For this analysis, I chose April 2021 because it was around the time when I bought a house and also kind-of midway between the peak in new home sales (August 2020) and the peak in prices (June 2022). Spring 2021 was also basically the all-time low in mortgage rates, implying that this was close to the peak in terms of mortgage affordability.
I chose $575,000 as the home price because the median home sale price in Austin was around that amount in April 2021, and 3.25% as the rate because that’s what I got.