
This article is part of the Crunchbase Community Contributor Series. The author is an expert in their field and we are honored to feature and promote their contribution on the Crunchbase blog.
Please note that the author is not employed by Crunchbase and the opinions expressed in this article do not necessarily reflect official views or opinions of Crunchbase, Inc.
StartupBlink, a global startup ecosystem map and research center, has launched the Global Startup Ecosystem Index 2022. Since 2017, the index offers policymakers and startup ecosystem stakeholders insights into their startup economy, unveiling trends and momentum. The index is also used as a tool by founders and investors trying to discover the best ecosystems.
This year’s report ranks the startup ecosystems of 1,000 cities and 100 countries, and features several new sections and an improved algorithm. We believe the decision on where to base and scale a startup is one of the most overlooked ones by entrepreneurs and other stakeholders. The impact of choosing the right location will have a massive impact on your chances of success, allowing you to connect to high-quality opportunities and stakeholders on a daily basis.
Click here to download the full Global Startup Ecosystem Index 2022
To generate the most accurate results, we work closely with more than 100 governments and global data partners, such as Crunchbase. This long-term partnership with Crunchbase has allowed us to analyze data on tens of thousands of startups in order to understand the quality and frequency of innovation, as well as trends, of ecosystems around the world.
StartupBlink’s startup ecosystem ranking criteria
Our country and city rankings have a total score, which is the sum of three columns measuring the following:
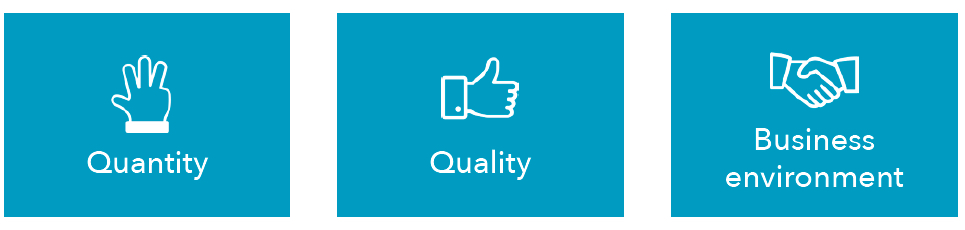
Based on the total score, we have put the ranking results into the tables covering the crucial information on each country and city that was ranked. For detailed information on the methodology and dozens of parameters, please refer to the methodology section of the report.
The top country rankings
When compared with 2021, this year saw some significant movements in the startup scene. In fact, we have called 2022 “the year of global startup ecosystem uncertainty.” Below are some key insights:
- The “Big 4” Startup countries remain the same as in 2021: the U.S., U.K., Israel and Canada. Year by year, these countries demonstrated a constant level of stability and innovation and established strong startup economies. The U.S. remains the world leader across multiple industries and startup metrics, and maintains a total score that is 4x that of the second ranked country (the U.K.). The U.K. has solidified its position and substantially increased its gap from the third ranked country, Israel.
- Israel was a whisker away from overthrowing the U.K. in 2021, and is now not only far from it, but also has seen the national ecosystem of Canada, ranked fourth, narrowing gaps from it.
- Canada, in a successful year, has also created a substantial gap among all ecosystems ranked below it, bringing it back to the “Big 4” club of countries that have managed to create a gap from other countries.
- One of the most surprising decreases in the country ranking is China, losing three spots to now be ranked 10th globally. This has been a year of friction between Chinese founders and the state, which, among other elements, created the first negative index momentum of the Chinese ecosystem in the past years. As a result, Singapore, which is becoming a stronger regional hub every year, ranks seventh after a jump of three spots and is now the top-ranked country in Asia.

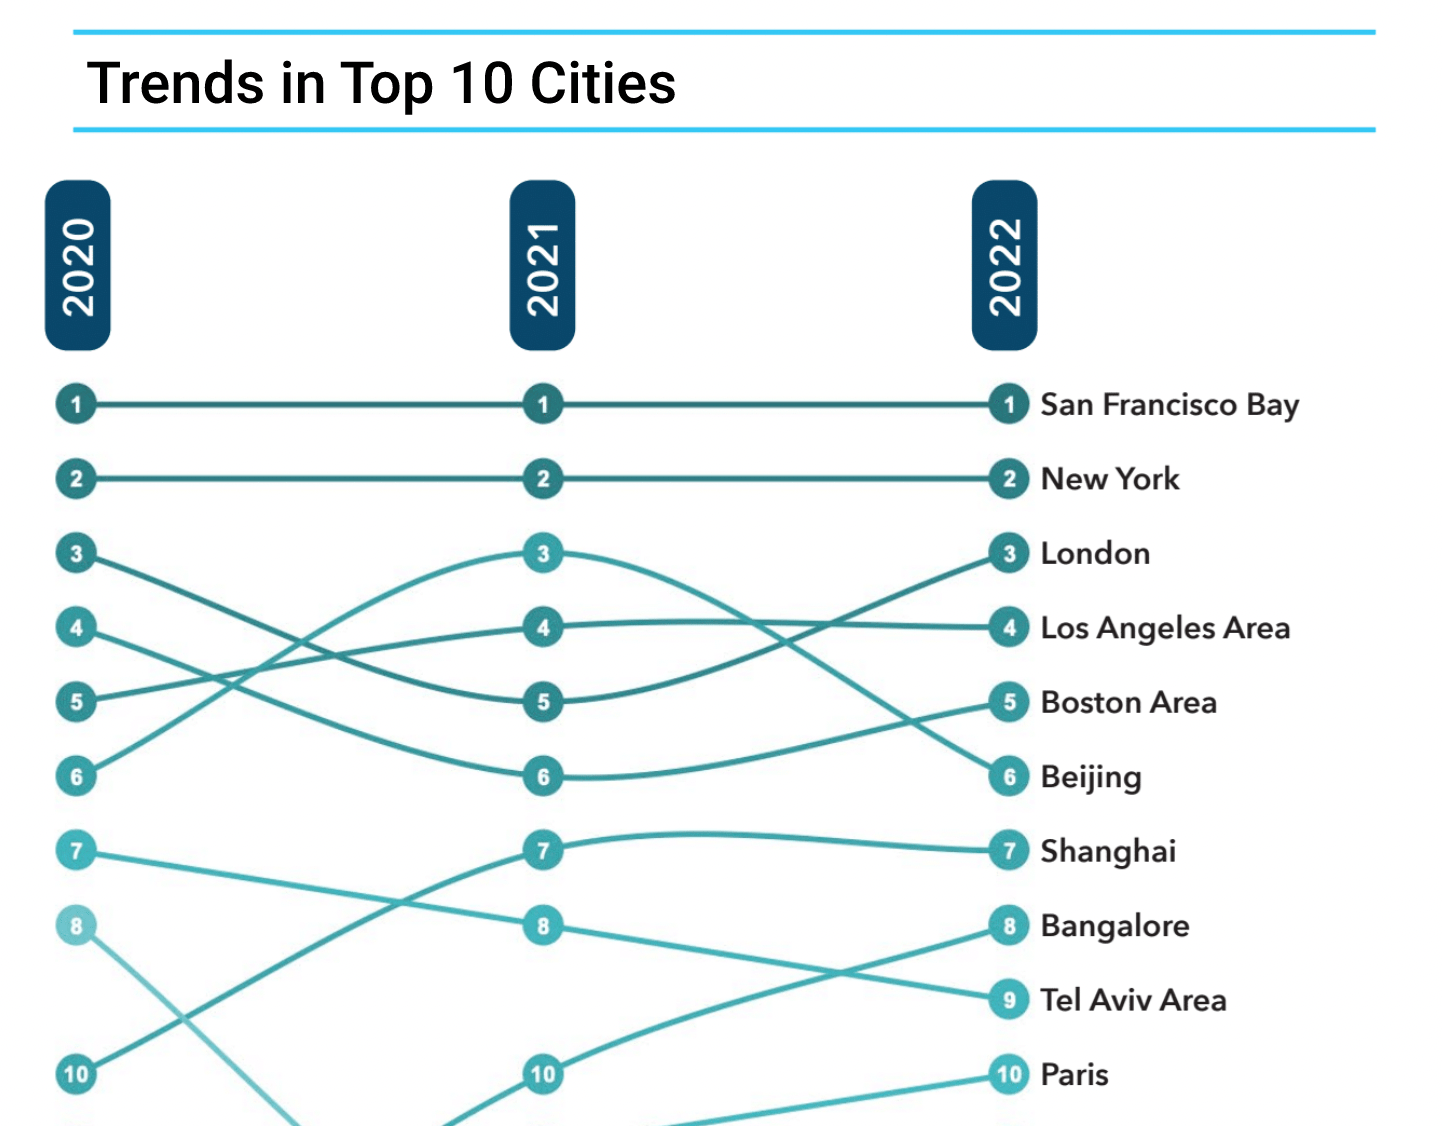
Top city ecosystems
San Francisco remains the undisputed global leader in innovation, but New York, the world’s second-highest ranked, is continuing a trend of closing gaps with San Francisco. In 2019, the total score of San Francisco was roughly 5x higher than New York, and this year it narrowed to 2.5x. Ranked second in the U.S. and globally, New York formed its own solid and unique global and national tier.
As the U.K. strengthened its position, London advanced in the top three, globally displacing Beijing. Los Angeles is still ranked fourth, but Boston advanced to the fifth position, illustrating the dominance of the U.S.
Prompted by China’s loss in ranking, Beijing dropped to the sixth position, having a close total score with the Boston Area. On the other hand, ranked seventh, Shanghai maintained its 2021 position.
Bangalore had a particularly good year and consolidated its position in the top 10 after advancing two positions to rank eighth. Tel Aviv, Israel’s undisputed major hub, has dropped by one spot to rank ninth globally, with Paris (10th) slowly closing the gap and threatening Tel Aviv’s position next year.
Major trends in U.S. cities (represented in the index with 258 cities), include the increase of rankings of Chicago (ranked 13th), and the continued decrease of the ecosystem of Austin (ranked 20th), which still does not manage to close the gaps from the other top—yet less trendy—ecosystems in the U.S. The ecosystem of Salt Lake City-Provo (ranked 31st) is substantially increasing in the rankings, joining the U.S. top ecosystems.
Industry rankings
Based on a sample of more than 100,000 startup entities on the StartupBlink map, we can pinpoint interesting trends related to core startup industries. With no surprise, the biggest industry remains Software & Data, with 31.8% of our sampled startups.
Another interesting change this year is the surge of Healthtech startups. Consisting of 12.7% of our sampled data, the industry now registers 73 Unicorns, almost doubling its count in 2021. It seems COVID-19 has inspired many entrepreneurs to give renewed focus to this critical industry. The Social & Leisure industry represents 10.4% of total startups but has only managed to create 31 Unicorns.
Industries that demonstrate a better ability to scale are the Fintech and Ecommerce & Retail industries, each pertaining to roughly 10% of the startup sample, and generating 219 and 152 Unicorns respectively. Fintech has nearly doubled its Unicorn count since last year.
The rest of the industries lag behind in both representations in the sample and in the unicorn count. The most interesting of those industries is Transportation, which has just 2.6% of the sample but managed to produce 81 Unicorns.
It should be noted that San Francisco, although losing momentum, is ranked first in all 11 industries of the index. This is a testament to this ecosystem’s dominance across all sectors of the startup economy.

For the full report and more information click here. Authors: Eli David, CEO, StartupBlink and Naomi Costa, Marketing and Content Manager, StartupBlink