


Abstract
Throughout the western US snow melted at an alarming rate in April 2021 and by May 1, hydrologic conditions were severely degraded with declining summer water supply forecasts compared to earlier in the winter. The objectives of this study are to (a) quantify the magnitude and climatological context of observed melt rates of snow water equivalent (SWE) and (b) underpin the hydrometeorological drivers during April 2021 based on atmospheric reanalysis and gridded meteorological data. Peak SWE indicated snow drought conditions were widespread (41% of stations between 5th and 20th percentile) but not necessarily extreme (only 9% of stations less than 5th percentile). Here, using observations from the Snow Telemetry (SNOTEL) network we found record 7 day snow melt rates (median of −99 mm; ±one standard deviation of 61 mm) occurred at 24% of SNOTEL sites and in all 11 Western states. Strong upper atmospheric ridging that began initially in the north Pacific with eastward propagation by mid-April to the Pacific Northwest Coast led to near-surface conditions across the western US conducive to rapid snow loss. One heat wave occurred inland across the Rockies the first week of April and then later in April, a second heat wave impacted the Cascades and northern California. We find that ripening of the snowpack by both record high surface solar radiation and air temperatures were factors in driving the rapid snow melt. Equatorial Pacific sea surface temperatures and the La Niña pattern that peaked in winter along with an eastward propagating and intensifying Madden–Julian Oscillation were likely responsible for driving the placement, strength, and progression of the north Pacific Ridge. This study documents the role of two extreme spring 'sunny heat wave' events on snowpack, and the cascading drought impacts which are anticipated to become more frequent in a warming world.
Export citation and abstract BibTeX RIS

Original content from this work may be used under the terms of the Creative Commons Attribution 4.0 license. Any further distribution of this work must maintain attribution to the author(s) and the title of the work, journal citation and DOI.
1. Introduction
Climate extremes in 2021 were widespread across the globe and the western United States (hereafter West) was just one of many regions to experience severe environmental and socioeconomic impacts. The trend of rising temperatures continued in 2021 with global surface temperatures ranking between the fifth and seventh warmest, depending on the dataset, since 1880 (Blunden and Boyer 2022, World Meteorological Organization 2022). Extreme heat and unprecedented wildfires occurred in western North America and the Mediterranean region of Europe (Phillip et al 2021, Perello et al 2022, World Meteorological Association 2022). Heat extremes were one contributing factor to intensifying droughts around the globe and widespread severe drought conditions were found across the West by the end of 2021 (Mankin et al 2021, Williams et al 2022, World Meteorological Association 2022).
Peak snowpack in the West in 2021, with the exception of part of the Pacific Northwest, revealed mostly below-median snow water equivalent (SWE) conditions (figure 1(a)) due to anomalously low precipitation totals but nothing like the record extreme snow drought that was observed in 2015 (Belmecheri et al 2016, Cooper et al 2016, Mote et al 2016, Harpold et al 2017, Hatchett and McEvoy 2018). However, by summer 2021 unprecedented and catastrophic water supply impacts were occurring throughout the West with hydropower operations ceasing on Lake Oroville, record low water levels on Lakes Mead and Powell, and the Colorado River falling into tier 2 federal water restrictions for the first time (Flek and Castle 2021). In many parts of the Southwest, spring and summer runoff forecasts underperformed, leading to questions about why runoff was less efficient than expected.
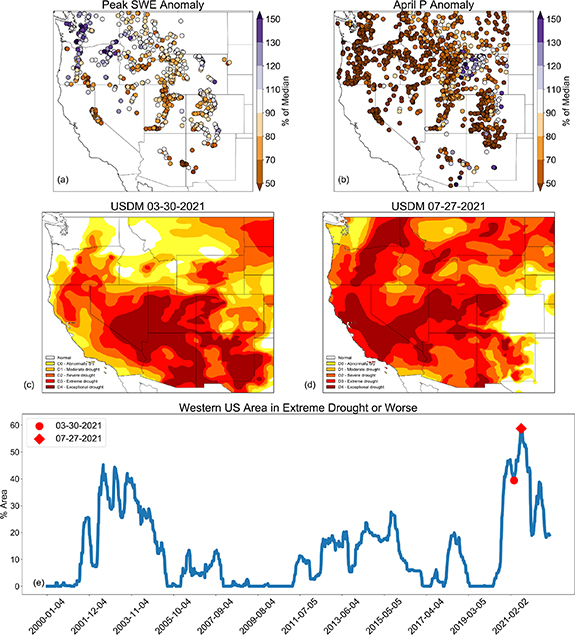
Figure 1. Western US peak SWE and precipitation anomalies, and US Drought Monitor maps and timeseries. (a) Percent of 1991–2020 median peak SWE in 2021 at SNOTEL stations. (b) Percent of 1991–2020 median precipitation in April 2021 at SNOTEL and Applied Climate Information System (ACIS) stations, (c) US Drought Monitor on 30 March 2021, (d) US Drought Monitor on 27 July 2021, (e) weekly timeseries of western US percent area in extreme drought or worse based on the US Drought Monitor. Timeseries data generated by https://droughtmonitor.unl.edu/.
Download figure:
Standard image High-resolution imageWater supply impacts from drought in 2021 were not simply a result of one low snowpack year but rather a result of a multi-year ongoing drought across the West (Abatzoglou 2021, Mankin et al 2021). At the start of the 2021 water year (1 October 2020), 33% of the West was in extreme or exceptional drought according to the United States Drought Monitor (USDM; Svoboda et al 2002) (figure 1(e)). Drought conditions resulted from a combination of low snowpack in winter 2019–2020 (for some regions of the West), an extremely hot summer in 2020, and a weak Southwest Monsoon in summer 2020. For the Southwest United States this most-recent drought episode continued a multi-decadal drying trend that rivals the worst conditions in over 1200 years (Williams et al 2022).
Anomalously dry and warm conditions, particularly across the Southwest, continued during autumn 2020 leaving the soil moisture critically dry heading into the 2020–2021 winter (Cook et al 2021, Mankin et al 2021, Williams et al 2022). Vegetation was also extremely dry due to combined dry and hot conditions. Owing partly to dry vegetation and extreme fire weather conditions, both California and Colorado experienced their largest wildfires on record that ignited in late summer or autumn 2020 (Keeley and Syphard 2021, Varga et al 2022). These fires led to prolonged and widespread poor air quality (Filonchyk et al 2022) that negatively affected health and altered human mobility in many communities (Hatchett et al 2021).
This setup of a multi-year drought with extreme soil moisture deficits heading into winter created an ideal scenario for a continuation of drought conditions in summer 2021 as initial spring runoff would be partitioned into wetting the soil moisture column before generating runoff and streamflow. Below normal peak snowpack in 2021 (figure 1(a)) was followed by extreme temperatures, cloud free skies, little precipitation (figure 1(b)), and rapid snowmelt rates in April 2021 that acted to speed up the drought impacts and spatial extent of drought in summer 2021 (figure 1(e)). The spatial extent of extreme or exceptional drought across the West based on USDM reached a historical maximum of 60% by the end of July 2021 and increased from 40% at the start of April 2021 (figures 1(c)–(e)). The objectives of this study are to (a) quantify the magnitude and climatological context of observed melt rates of SWE and (b) underpin the hydrometeorological drivers during April 2021 based on atmospheric reanalysis and gridded meteorological data. In addition, we discuss the large-scale atmospheric and oceanic climate drivers and the teleconnections to the snow melt event.
2. Data and methods
2.1. Snow Telemetry (SNOTEL) SWE
Daily SWE data were obtained from the Natural Resources Conservation Service (NRCS) SNOTEL (www.nrcs.usda.gov/wps/portal/wcc/home/) network for 626 stations across the West. Only stations with at least 20 years of data were used. The period of records ranged from 20 to 58 years (about 75% of sites had 35–45 years of record). SWE changes (ΔSWE) were computed as a metric of snow melt rate and defined as the difference between SWE values between two dates. At each station, a centered 7 day ΔSWE (i.e. ±3 d) was computed for each day in April and for all years in the period of record. A 7 day period reduces the noise associated with daily ΔSWE and captures prolonged snow melt events that can contribute to a large portion of the overall spring snowpack water volume loss. A time series of standardized 7 day ΔSWE was computed for each day by applying a z-score to gauge the magnitude of snow melt at each station relative to the entire West. The same ΔSWE method was also applied to the full month of April (30 April–1 April) to examine monthly records. Peak SWE, date of peak SWE anomaly, and date of SWE melt out anomaly for 2021 were also obtained from NRCS.
2.2. Atmospheric drivers of snow melt
Spatial patterns of the near-surface atmospheric drivers of snow melt are investigated using gridMET products (Abatzoglou 2013). gridMET is a high-resolution gridded data set of daily weather parameters covering the contiguous United States which combines the high spatial resolution of the Parameter-elevation Relationships on Independent Slopes Model (Daly et al 2008) and temporal characteristics of the North American Land Data Assimilation System (Xia et al 2012). We use gridMET 4 km spatial resolution and daily temporal resolution grids of precipitation, maximum temperature (Tmax), minimum temperature (Tmin), and incoming shortwave radiation at the surface (Rsd) over the period of 1979–2021. Weekly sums are created for precipitation and weekly means for Tmax, Tmin, and Rsd over four periods in April: 1–7 April, 8–14 April, 15–21 April, and 22–30 April. For Tmax, Tmin, and Rsd ranks and z-scores are calculated over the 1979–2021 period at each grid cell and mapped across the West.
Upper air atmospheric conditions were examined using the National Center for Environmental Prediction-National Center for Atmospheric Research (NCEP-NCAR) global reanalysis data (Kalnay et al 1996). NCEP-NCAR reanalysis are available across the globe at a spatial resolution of 2.5° (https://psl.noaa.gov/data/composites/day/). We use the 500 hectopascal (hPa) height data (HGT 500) averaged temporally over the same four weekly periods used for the SNOTEL analysis: 1–7 April, 8–14 April, 15–21 April, and 22–30 April. Weekly geopotential height values are used along with weekly anomalies computed relative to the 1991–2020 mean.
2.3. USDM data
The USDM provides weekly snapshots of drought conditions based on objective weather and climate indicators, 'boots-on-the-ground' conditions reporting, and expert guidance by the weekly author of the maps (Svoboda et al 2002). Changes in the USDM respond to both the climate drivers of drought and impacts being felt on the ground such as water shortages or degraded crop and range conditions. Here we use weekly temporal resolution USDM time series and select USDM maps obtained from the National Drought Mitigation Center (https://droughtmonitor.unl.edu/). We show the full USDM time series since 2000 of the percent area of the West in extreme drought (D3) or worse (D4; exceptional).
3. Results
3.1. Record snow melt
Standardized anomalies of the 7 day period in April 2021 with the lowest ΔSWE are shown in figure 2(a). Widespread anomalous snow melt was found throughout the month with 73% of stations indicating a less than −1 standard deviation (σ) anomaly and 18% of stations less than −2σ. The negative anomalies were widespread across the entire West. Many of the anomalies shown in figure 2(a) were record low values (24% of all stations with a median value of −99 mm; ±one standard deviation of 61 mm) and these locations along with the timing of the records are shown in figure 2(b) (table S1 provides ΔSWE in mm and σ for the record melt stations). Record melt occurred throughout the entire month but two weekly clusters represent the majority of the records with many record anomalies exceeding −3σ. The 1–7 April period had records at 74 stations and was concentrated over the Rocky Mountains while the 15–21 April period had records at 46 stations with the pattern shifting regionally to the Pacific Northwest (primarily the Cascade Range). When considering the ΔSWE for the entire month of April (figure 2(c)) the pattern was more variable with some locations showing positive anomalies; however, about 75% of stations show negative monthly anomalies with record melt at 17 stations in eight Western states. At the large watershed scale (HUC2) SWE percent of median dropped at all Western basins from 1 April to 1 May with substantial declines found in California, Great Basin, Lower Colorado, Upper Colorado, and Rio Grande with May 1 values of 35%, 46%, 15%, 61%, and 51% of median, respectively (figure 2(d)).

Figure 2. SNOTEL-based snow water equivalent (SWE) deltas (ΔSWE) during April 2021. (a) Standardized ΔSWE anomalies for the 7 day period with the greatest snowmelt. (b) Stations where the 7 day ΔSWE anomaly shown in (a) was a record. Colors in (b) represent the weekly timing of the ΔSWE records. (c) Standardized ΔSWE anomalies for the full month of April. Black squares in (c) indicate record monthly ΔSWE values. (d) HUC2% of 1991–2020 median SWE for 1 April and 1 May 2021. HUC2 boundaries are plotted in panel (b).
Download figure:
Standard image High-resolution imageAlthough peak SWE in 2021 was below median across much of the West (figure 1(a)) there was no widespread early peak and early start to the melt season such as the 2004 melt event (Pagano et al 2004). 53% of stations peaked within 1 week (±7 d) of median with a cluster of stations experiencing earlier peak SWE in the northern Rockies while much of the Cascades saw much later SWE peaks (figure 3(a)). However, due to a combination of the rapid melt described in figure 2 and the below median SWE at time of peak, 48% of the stations that peaked on time or later than average still melted out early. The early melt out signal was much more pronounced than the late peak signal (figures 3(b) and (c)).
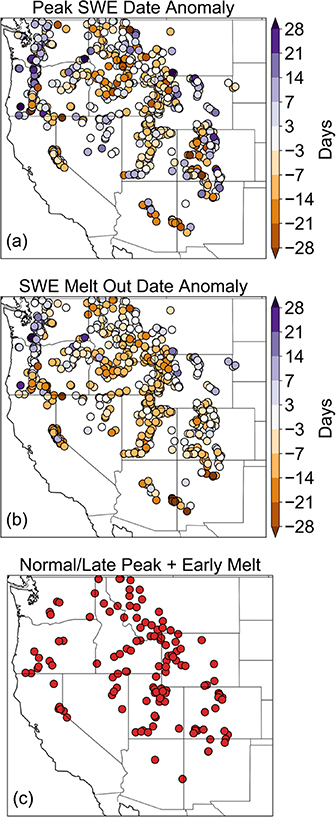
Figure 3. SNOTEL peak SWE and SWE melt out during 2021. (a) Peak SWE date anomaly in days. (b) SWE melt out date anomaly in days. (c) Locations that saw peak SWE dates that were near normal (up to 2 d early) or late and also saw an early (⩽3 d early) SWE melt out date.
Download figure:
Standard image High-resolution image3.2. Large-scale drivers of April 2021 rapid snow melt
Weekly precipitation, Rsd, Tmax, Tmin, and HGT 500 spatial patterns are shown in figure 4 to identify the drivers of the record snow melt event shown in figure 2. The 1–7 April was the period with the most widespread record snow melt, which was centered over the Rocky Mountains. During that period light-to-moderate precipitation occurred in the northern Rockies with little-to-no precipitation in the southern Rockies (figure 4(a)). Despite some precipitation, Rsd was above median in the region with record high values in Colorado, northern New Mexico, the Great Basin, and Sierra Nevada (figure 4(e)). Widespread record high Tmax was the dominant feature during the first week of April (figure 4(i)) with anomalies of 4 °C–6 °C above normal and was coincident with the region of record snow melt. Minimum temperatures were above median, and record high in some locations, in much of the higher elevations but well below median or even record low in many valley locations indicating a stable atmospheric pattern that allows for very strong inversion in places like the Great Basin (figure 4(m)). The upper air pattern revealed anomalous ridging in the north Pacific that transitioned to weaker ridging with more zonal flow with positive height anomalies over contiguous United States (CONUS), and then back to a highly amplified ridge centered just south of Greenland (figure 4(q)). A weak, quasi-stationary trough of low pressure was in place off the central coast of California, indicated by below normal heights.
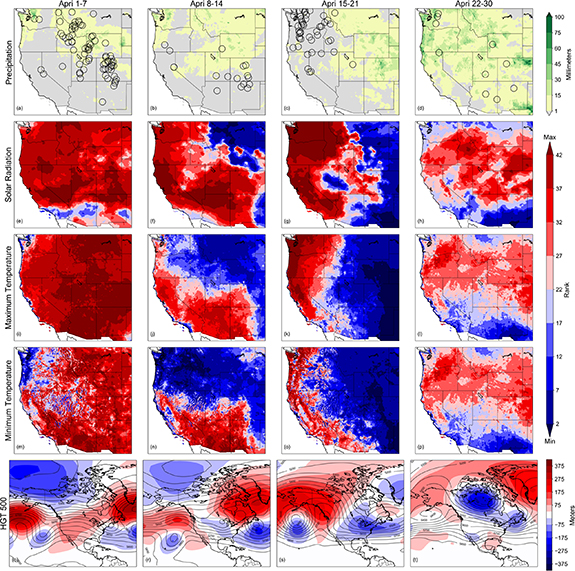
Figure 4. Atmospheric conditions during April 2021. (a)–(d) Weekly total accumulated precipitation, (e)–(h) weekly average Rsd rankings, (i)–(l), weekly average Tmax rankings, (m)–(p) weekly average Tmin rankings, and (q)–(t) weekly average 500 mb geopotential height values (contours) and anomalies (shading). Rankings are based on 43 years of gridMET data (1979–2021). Gray shading in (a)–(d) indicates zero precipitation. Circles in (a)–(d) show locations of ΔSWE records. Darkest red shading indicates maximum rank and darkest blue shading indicates minimum ranking in (e)–(p).
Download figure:
Standard image High-resolution imageMost notable in the second week of April was the record high Rsd in California, southern Nevada, southern Utah, and northern Arizona (figure 4(f)) that was coincident with above median temperatures (figures 4(j) and (n)). The weak low pressure off the Pacific coast became closed off and the strength of the North Pacific high weakened and began to shift east (figure 4(r)).
The third week of April brought widespread record snow melt to the Pacific Northwest with no precipitation over most of the region (figure 4(c)), record high Rsd (figure 4(g)) and, to a lesser spatial extent compared to the first week of April, record high Tmax (figure 4(k)). However, Tmax anomalies were even greater than the first week of April with values of +5 °C–8 °C in the Cascades of Oregon and Washington. The closed low migrated north, which amplified and stretched the north Pacific ridge with a lobe of higher-than-average height anomalies centered over the coast of British Columbia (figure 4(s)). This is a classic upper air pattern for Pacific Northwest heat waves (Bumbaco et al 2013), and this event in April resembled the blocking high pressure circulation pattern during the record-breaking and unprecedented heat wave that followed in late June 2021 that caused significant negative human health and ecosystem impacts (Overland 2021, Neal et al 2022).
Despite more widespread precipitation the last week of April (figure 4(d)) with a deep area of low pressure in central Canada becoming the dominant upper air feature (figure 4(t)), much of the West still had Rsd (figure 4(h)), Tmax (figure 4(l)), and Tmin (figure 4(p)) in the upper tercile of the distribution and ten snow melt records still occurred at SNOTEL sites.
The atmospheric circulation pattern during April set up an extended period of dry, warm, and sunny conditions across the West (figure 4) but the extent to which the magnitude of anomalies in the near-surface variables (Tmax, Tmin, or Rs d) drove the melt remains unclear. Relationships between record ΔSWE anomalies and corresponding climate anomalies are presented in figure 5. When comparing week 1 (figure 5(a)) and week 3 (figure 5(c)), the two weeks with the most ΔSWE records, we can see variations in the magnitude of the climate anomaly and an emergence of a dominant climate anomaly in week 3. In week 1 (figure 5(a)) Tmax anomalies were typically greatest with a median value of 1.9σ followed by Rs d at 1.5σ and Tmin at 1.3σ. In contrast, Rs d anomalies were much stronger, and the dominant driver, during week 3 with a median value at 2.5σ followed by Tmax at 1.4σ and Tmin at 0.78σ. This indicates that a highly unusual stretch of clear skies in the Pacific Northwest (where most of the ΔSWE records occurred in week 3) and impact of the increasing sun angle of late April that played a key role in the rapid snow melt. There was likely a cumulative effect of reduced snowpack cold content that was initiated during the first weeks of April during the still-anomalous heat and radiation that allowed anomalous radiation to continue melting snow in week 3. A similar Rs d dominant pattern can be seen in week 2, although to a lesser extent, when most of the ΔSWE records occurred in the southern Rockies. During week 4, the few melt records were characterized by anomalously high Tmin and near-normal Rs d and Tmax. This also suggests the snowpack lost cold content and became 'ripe' during the earlier portion of April. The lack of nocturnal cooling allowed greater melt rates and potentially continuous melt as radiation and temperature increased.

Figure 5. Weekly relationships between climate anomalies and SWE delta anomalies in April 2021. gridMET maximum temperature (Tmax), minimum temperature (Tmin), and solar radiation (Rs d) anomalies are plotted against SNOTEL ΔSWE anomalies for each location where record ΔSWE was observed. All anomalies are plotted as z-scores (σ) and dashed lines show the median values of each climate variable.
Download figure:
Standard image High-resolution image
4. Discussion
Heat waves typically are considered to have the greatest impacts in summer, but we provide examples of two high-impact spring heat waves that are consistent with the long-term trend of spring warming in the West (Abatzoglou and Redmond 2007). While the rate of snowmelt was unusual during these events the timing was not unusually early, and even later than average, for some locations like the Sierra Nevada and mid-to-low elevations in the Cascades. This reinforces the ideas that timing of snowmelt onset, which is influenced by seasonal availability of solar radiation and shading of the snow surface (lower sun angles), will be critical to changes in snowmelt rates and runoff response and generation in a warming world (e.g. Lundquist and Flint 2006, Musselman et al 2017). This also highlights that while there is evidence that climate change will generally reduce snowpacks and lead to slower snow melt as the climate warms (Musselman et al 2017) there will still be situations when rapid spring snowmelt does occur. This outcome may favor drought intensification if rapid melting of snowpacks occurs earlier than expected given otherwise normal or above normal timing in peak snowpack as water is no longer stored in the natural snowpack reservoir. In other locations, like the higher elevations in the northern Rockies, the onset of snowmelt was several weeks early; however, the sun angles in early April are still high enough to generate rapid melt under excessively clear sky conditions.
Drought was already widespread in late 2020 meaning that further severity and expansion was inevitable without a well above normal snowpack in water year 2021. Examining the 1 April snowpack revealed that snow drought was widespread across the West but largely not an event of the extreme variety. However, the rates of snowmelt throughout April were alarming and quickly worsened summer runoff outlooks which underscores that 1 April may no longer be a reliable benchmark for western water supply (Livneh and Badger 2020) and the importance of monitoring snow droughts throughout the entire melt season (Hatchett and McEvoy 2018, Hatchett et al 2022a).
Antecedent dryness and anomalously low soil moisture before the snowpack began accumulating in autumn 2020 played a critical role in reducing the runoff efficiency and worsening overall drought conditions on top of the low 2021 snowpack and rapid April snowmelt (e.g. Lapides et al 2022). By the end of summer 2021, 76% of the area in the West (up from 55% at the start of the water year) was in severe drought or worse according to the USDM (figure 1(e)) and the Southwest megadrought reached a level of severity not seen in over 1200 years (Williams et al 2022). The first-ever federal water restrictions were put in place on the Colorado River Basin and reservoirs in California were at or near record low levels. The rapid disappearance of snow in April 2021 took place in the middle of a series of compounding climate events. The April melt was followed by anomalously warm summer temperatures (and an unprecedented heat wave) that led to record dry soils and vegetation which set the stage for an active fire season in California and the Pacific Northwest of the US and Canada (White et al 2022). This is consistent with research showing that reduced mountain snowpack and spring climate extremes are linked to higher fire potential in summer and autumn (Gergel et al 2017, Abolafia-Rosenzweig et al 2022, Hatchett et al 2022b).
Large-scale atmospheric and oceanic climate drivers and teleconnections played a role in the atmospheric pattern that drove the snow melt event. Identification of these drivers helps sub-seasonal scale forecasting of high impact weather events, improving lead time for managing their impacts (Vitart and Robertson 2018). While we did not evaluate the relative roles of larger scale climate drivers in detail, a preliminary examination suggests the role of tropical forcing, as has been found in other extreme midlatitude weather events (e.g. Vitart and Robertson 2018, Rondanelli et al 2019). The northern hemisphere winter season was characterized by La Niña conditions in the equatorial Pacific Ocean, which Seager et al (2022) attribute to the drought development in Southwest, and the expansion of drought to all of the West, primarily due to the placement of the North Pacific high and reduced precipitation over western North America. Seager et al (2022) also suggest that spring 2021 showed the strongest seasonal teleconnection between the La Niña in the tropical Pacific and drought intensification across the West. A strong anthropogenically driven drying and warming trend in spring has also been observed across the West (Abatzoglou and Redmond 2007, Seager et al 2022) which likely played a role in the rapid snow melt event.
At sub-seasonal timescales the Madden–Julian Oscillation (MJO) began a cycle of eastward propagation of tropical convection in March, characterized by weaker magnitudes that grew towards the end of March and remained at moderate strength during much of April. By the end of April, the MJO was stronger as convection progressed eastward to reach the western hemisphere by month's end (figure S1). The eastward progression and intensification of the MJO (phase 4–8) and strength during late March into April are ideal for developing the type of ridge observed during the event, one defined by Gibson et al (2020) as a North-type ridge. The observed North-type ridge is consistent with both the MJO phases and lag-times that amplify and maintain North ridge conditions over western North America (Gibson et al 2020) and with potential constructive interference from tropical heating anomalies induced by shifts in the Walker Circulation associated with La Niña. While tropical heating from convection is not necessary to induce persistent and amplified ridges off the coast of North America, it can increase the likelihood of their formation, likely to a greater degree than midlatitude internal variability alone (Teng and Branstator 2017). This suggests tropical heating from the MJO, especially when in a mature El Niño southern oscillation (ENSO) phase, may provide a potential source of sub-seasonal predictability for impactful snowmelt events such as the April 2021 melt event. By highlighting the potential tropical origins of the persistent ridge offshore of western North American, we hope to motivate further investigation into the origins and predictability of this and other snowmelt-inducing spring season weather events to inform drought early warning systems and increase situational awareness in water management.
5. Conclusions
The West experienced a widespread and record-breaking rapid snowmelt event in April 2021 that accelerated drought intensification and expansion, particularly in California and the Pacific Northwest (figure 1(c)). In many Pacific Northwest locations, this event triggered the onset of drought due to anomalously early melting of snowpack that was followed by an unprecedented heat wave in June. Two separate spring heat waves, one centered over the Rockies and another centered over the Pacific Northwest, accompanied by dry and cloud free conditions drove the rapid snowmelt in April. While the temperature anomalies were substantial, and record breaking, the record Rsd (figure 4) was perhaps more critical to the widespread nature of the rapid snow melt due to the significance of solar radiation driving land surface energy balance and snowmelt processes (e.g. Marks and Dozier 1992). Further development and understanding of the drivers of extreme spring snowmelt in a warming world should be pursued to help improve predictability of these events and drought early warning capabilities, particularly from the perspective of the tropical heating anomalies that induce persistent and amplified downstream ridges that block moisture and contribute to sunny and warmer-than-normal conditions. This study documents the role of an extreme spring climate event on snowpack that preceded a myriad of cascading drought impacts, most of which are anticipated to become more frequent in a warming world.
Acknowledgments
Funding for this work was provided by NOAA's National Integrated Drought Information System California-Nevada Drought Early Warning System under Award No. 1332KP21DNEEN0006 and California Department of Water Resources under Award No. 132261139.
Data availability statements
All of the raw data used in this study are publicly available: SNOTEL data: www.nrcs.usda.gov/wps/portal/wcc/home/, gridMET data: www.climatologylab.org/gridmet.html, NCEP-NCAR reanalysis: https://psl.noaa.gov/data/composites/day/, USDM data: https://droughtmonitor.unl.edu/.
The data that support the findings of this study are available upon reasonable request from the authors.
Conflict of interest
The authors declare that they have no known competing financial interests or personal relationships that could have appeared to influence the work reported in this paper.