Misc
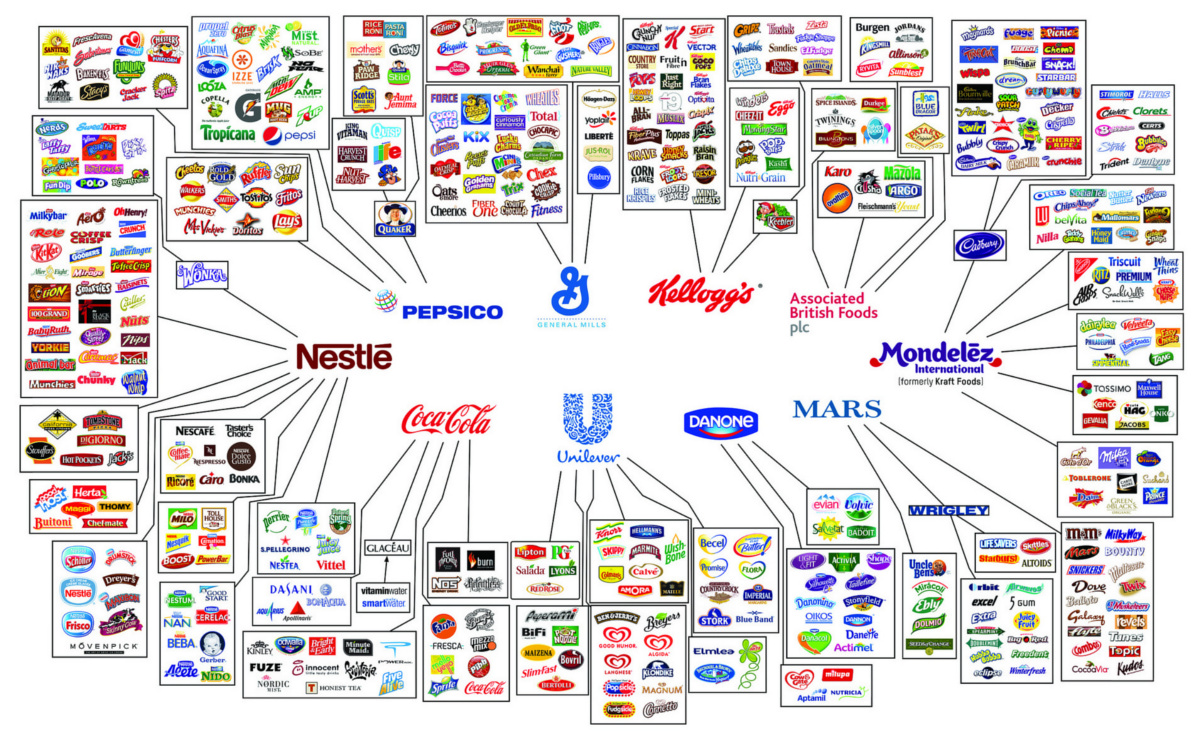
The Illusion of Choice in Consumer Brands
The Illusion of Choice in Consumer Brands
Explore the full-size version of the above graphic in all its glory.
If today’s infographic looks familiar, that’s because it originates from a well-circulated report that Oxfam International puts together to show consolidation in the mass consumer goods industry.
We are sharing it because we believe it is important for you to be aware of who is supplying the different brands and goods served on your dinner table.
Unlikely Links
The illusion of choice does not arise from the products we expect the companies to sell. We inherently know that PepsiCo sells plenty of beverages, including its flagship product. We know that Nestlé makes Kit Kat, Nesquick chocolate syrup, Nespresso coffee machines, and Nescafé instant coffee.
What is less obvious is that Nestlé makes Gerber baby food, Hot Pockets, DiGiorno pizzas, and Stouffer brand frozen foods. Nestlé even owns two competing brands of fancy, carbonated water: San Pellegrino and Perrier.
In fact, Nestlé has at least 29 brands with annual sales over $1 billion. The company literally has hundreds of different products in sectors ranging from pet food to soups and sauces. It’s the world’s largest food company by revenues, and it’s worth a whopping $240 billion in market capitalization.
They Might Be Giants
It’s not just Nestlé that is mind-boggling in size and scope.
Other companies such as Coca-Cola, Kellogg’s, Mondelēz, PepsiCo, General Mills, Danone, and Mars are also massive. They each own dozens of brands that dominate certain product categories.
Want to buy crackers? Pick up some Ritz, Triscuits, Wheat Thins, Air Crisps, or Premium brand crackers – but know they are all owned by Mondelēz (formerly Kraft Foods).
Buying a chocolate bar? There are seemingly hundreds to choose from, but its just the illusion of choice. They pretty much all come from Mars, Nestlé, or Mondelēz (which owns Cadbury).
There’s nothing wrong in buying from these brands, but remember that each dollar of your money is a vote. Vote for products and companies you believe in!
Note: the above graphic is about 1.5 years old, and it misses recent acquisitions or changes in brand ownership. For example, Power Bar is now owned by Post Holdings, another giant consumer foods conglomerate. That said, we believes the point of the graphic still comes across.


Economy
Mapped: Southeast Asia’s GDP Per Capita, by Country
Indonesia, the region’s largest economy, makes the top five in this map exploring Southeast Asia’s GDP per capita levels.
Mapped: Southeast Asia’s GDP Per Capita, by Country
This was originally posted on our Voronoi app. Download the app for free on iOS or Android and discover incredible data-driven charts from a variety of trusted sources.
In 1937, as America navigated the Great Depression, Russian-born economist Simon Kuznets presented a novel idea on measuring a country’s economy. And thus, gross domestic product (GDP) was born.
Nearly eight decades later, measuring GDP, and GDP per capita—which helps make data comparable between populations—has become a benchmark statistic to compare and contrast countries’ economies and productivity.
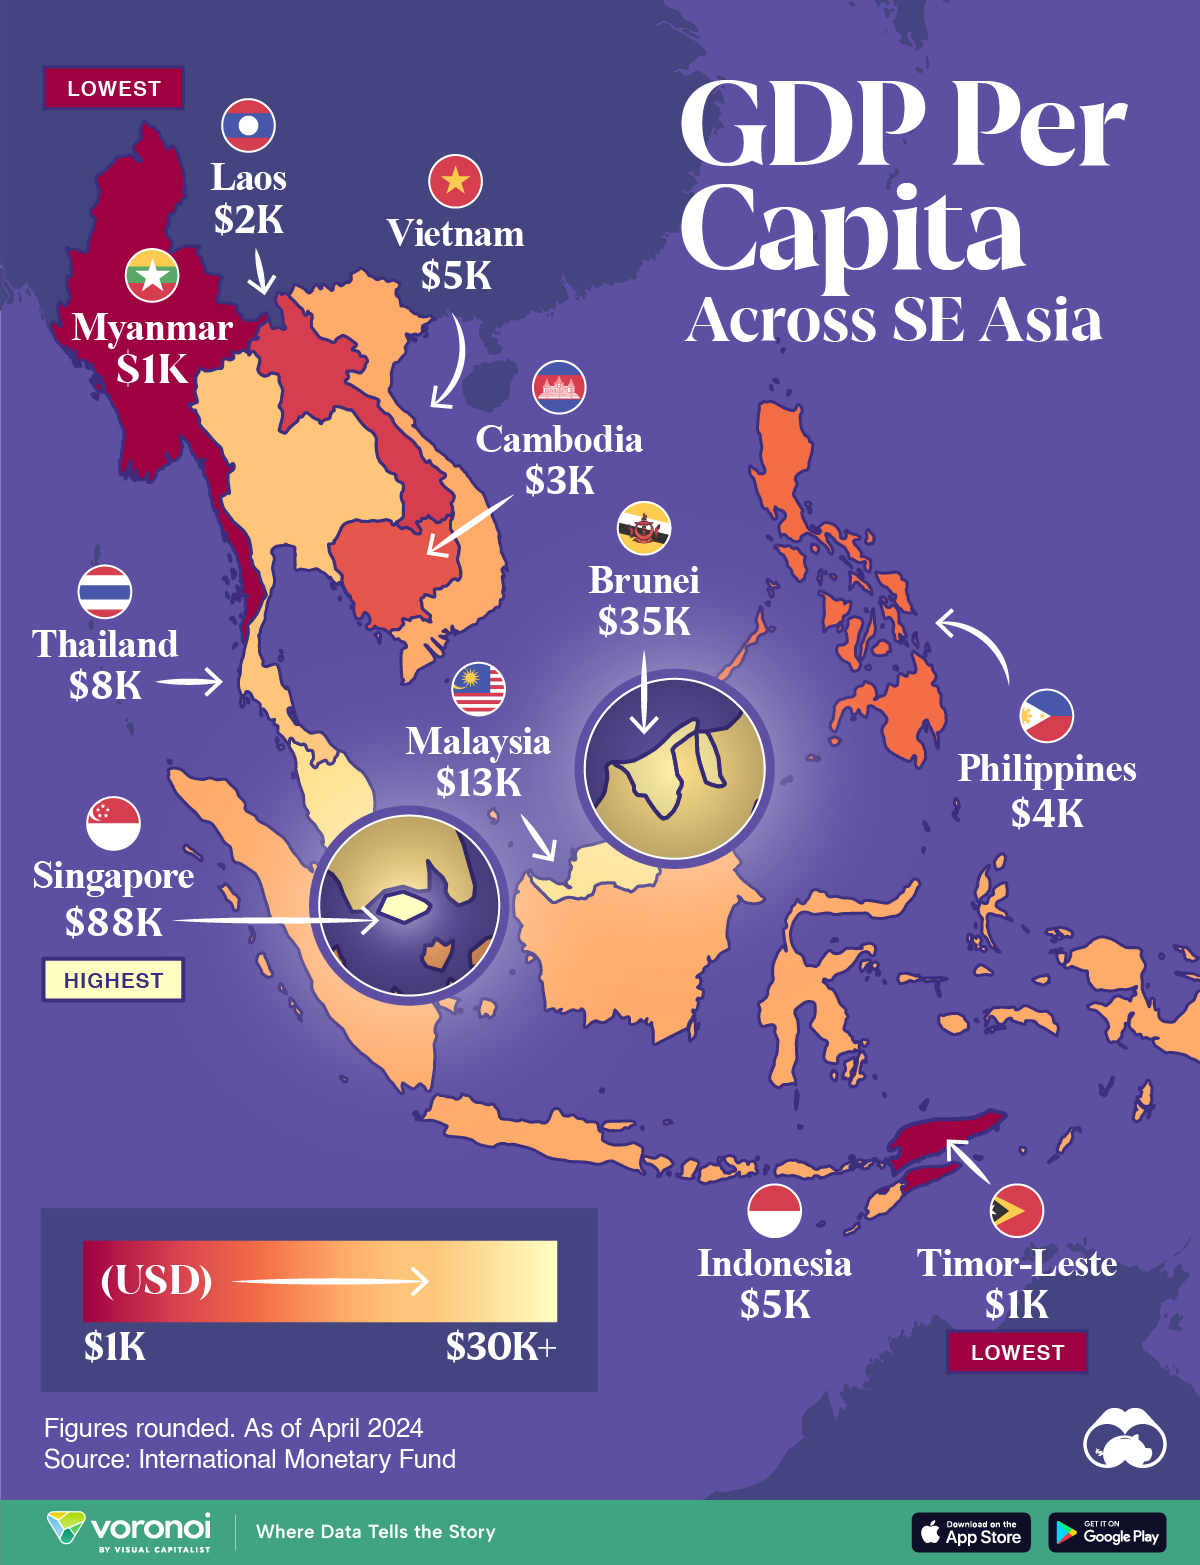
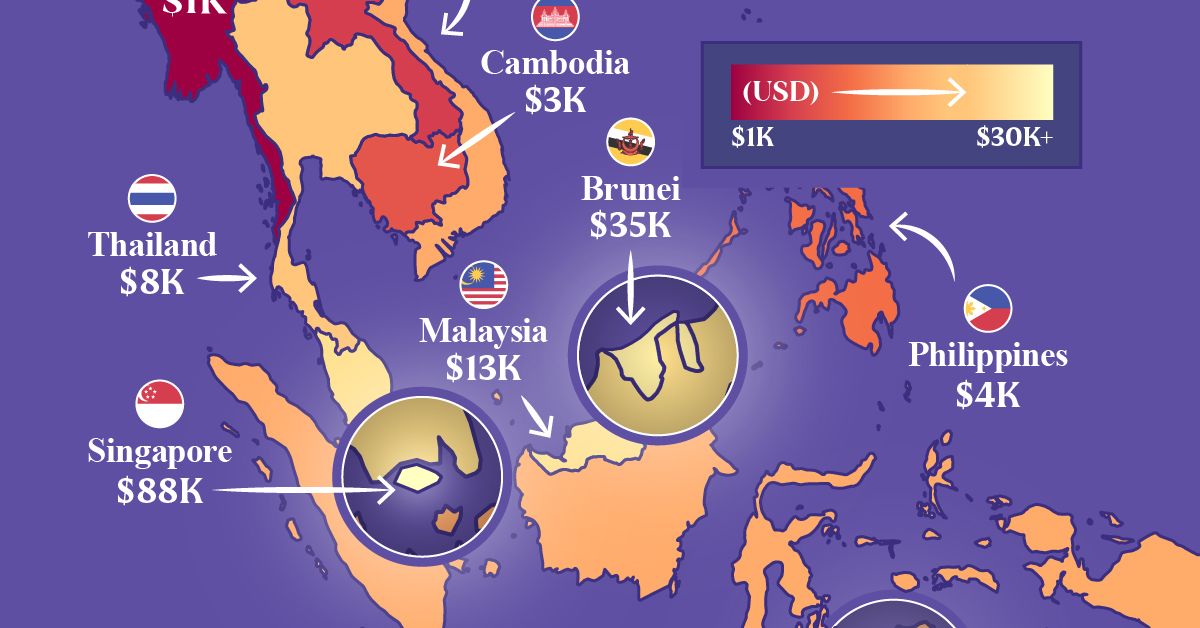
In this map, we compare Southeast Asia’s GDP per capita levels. Data is in current U.S. dollars, sourced from the International Monetary Fund’s DataMapper tool, last updated April 2024.
Ranked: Southeast Asian Countries by GDP Per Capita
Singapore stands head-and-shoulders above the rest of the region with a per capita GDP past $88,000. It is also, incidentally, one of the richest nations in the world by this metric.
The 734 km² country has only 5.6 million residents and very few natural resources. However the country’s strategic location makes it a center for trade and commerce.
| Country | GDP Per Capita |
|---|---|
| 🇸🇬 Singapore | $88,450 |
| 🇧🇳 Brunei | $35,110 |
| 🇲🇾 Malaysia | $13,310 |
| 🇹🇭 Thailand | $7,810 |
| 🇮🇩 Indonesia | $5,270 |
| 🇻🇳 Vietnam | $4,620 |
| 🇵🇭 Philippines | $4,130 |
| 🇰🇭 Cambodia | $2,630 |
| 🇱🇦 Laos | $1,980 |
| 🇹🇱 Timor-Leste | $1,450 |
| 🇲🇲 Myanmar | $1,250 |
Note: Figures are rounded.
This is in sharp contrast to Brunei, Southeast Asia’s next richest country, with a per capita GDP of $35,110.
Oil is a critical part of Brunei’s economy, making it both very wealthy, but landing it in a vulnerable, resource-dependent position. Oil and gas revenues contribute half the country’s entire revenue receipts.
Two countries known for their large tourism sectors, Malaysia and Thailand rank third and fourth, at $13,310 and $7,810 respectively.
Finally, Southeast Asia’s largest economy, and the world’s fourth-most populous country Indonesia, rounds out the top five with a GDP per capita of $5,270.

-

 Brands5 days ago
The Evolution of U.S. Beer Logos
-

 Culture2 weeks ago
The World’s Top Media Franchises by All-Time Revenue
-

 voronoi2 weeks ago
Best Visualizations of April on the Voronoi App
-

 Wealth2 weeks ago
Charted: Which Country Has the Most Billionaires in 2024?
-

 Business1 week ago
The Top Private Equity Firms by Country
-

 Markets1 week ago
The Best U.S. Companies to Work for According to LinkedIn
-

 Economy1 week ago
Ranked: The Top 20 Countries in Debt to China
-

 Politics1 week ago
Charted: Trust in Government Institutions by G7 Countries