270 to Win
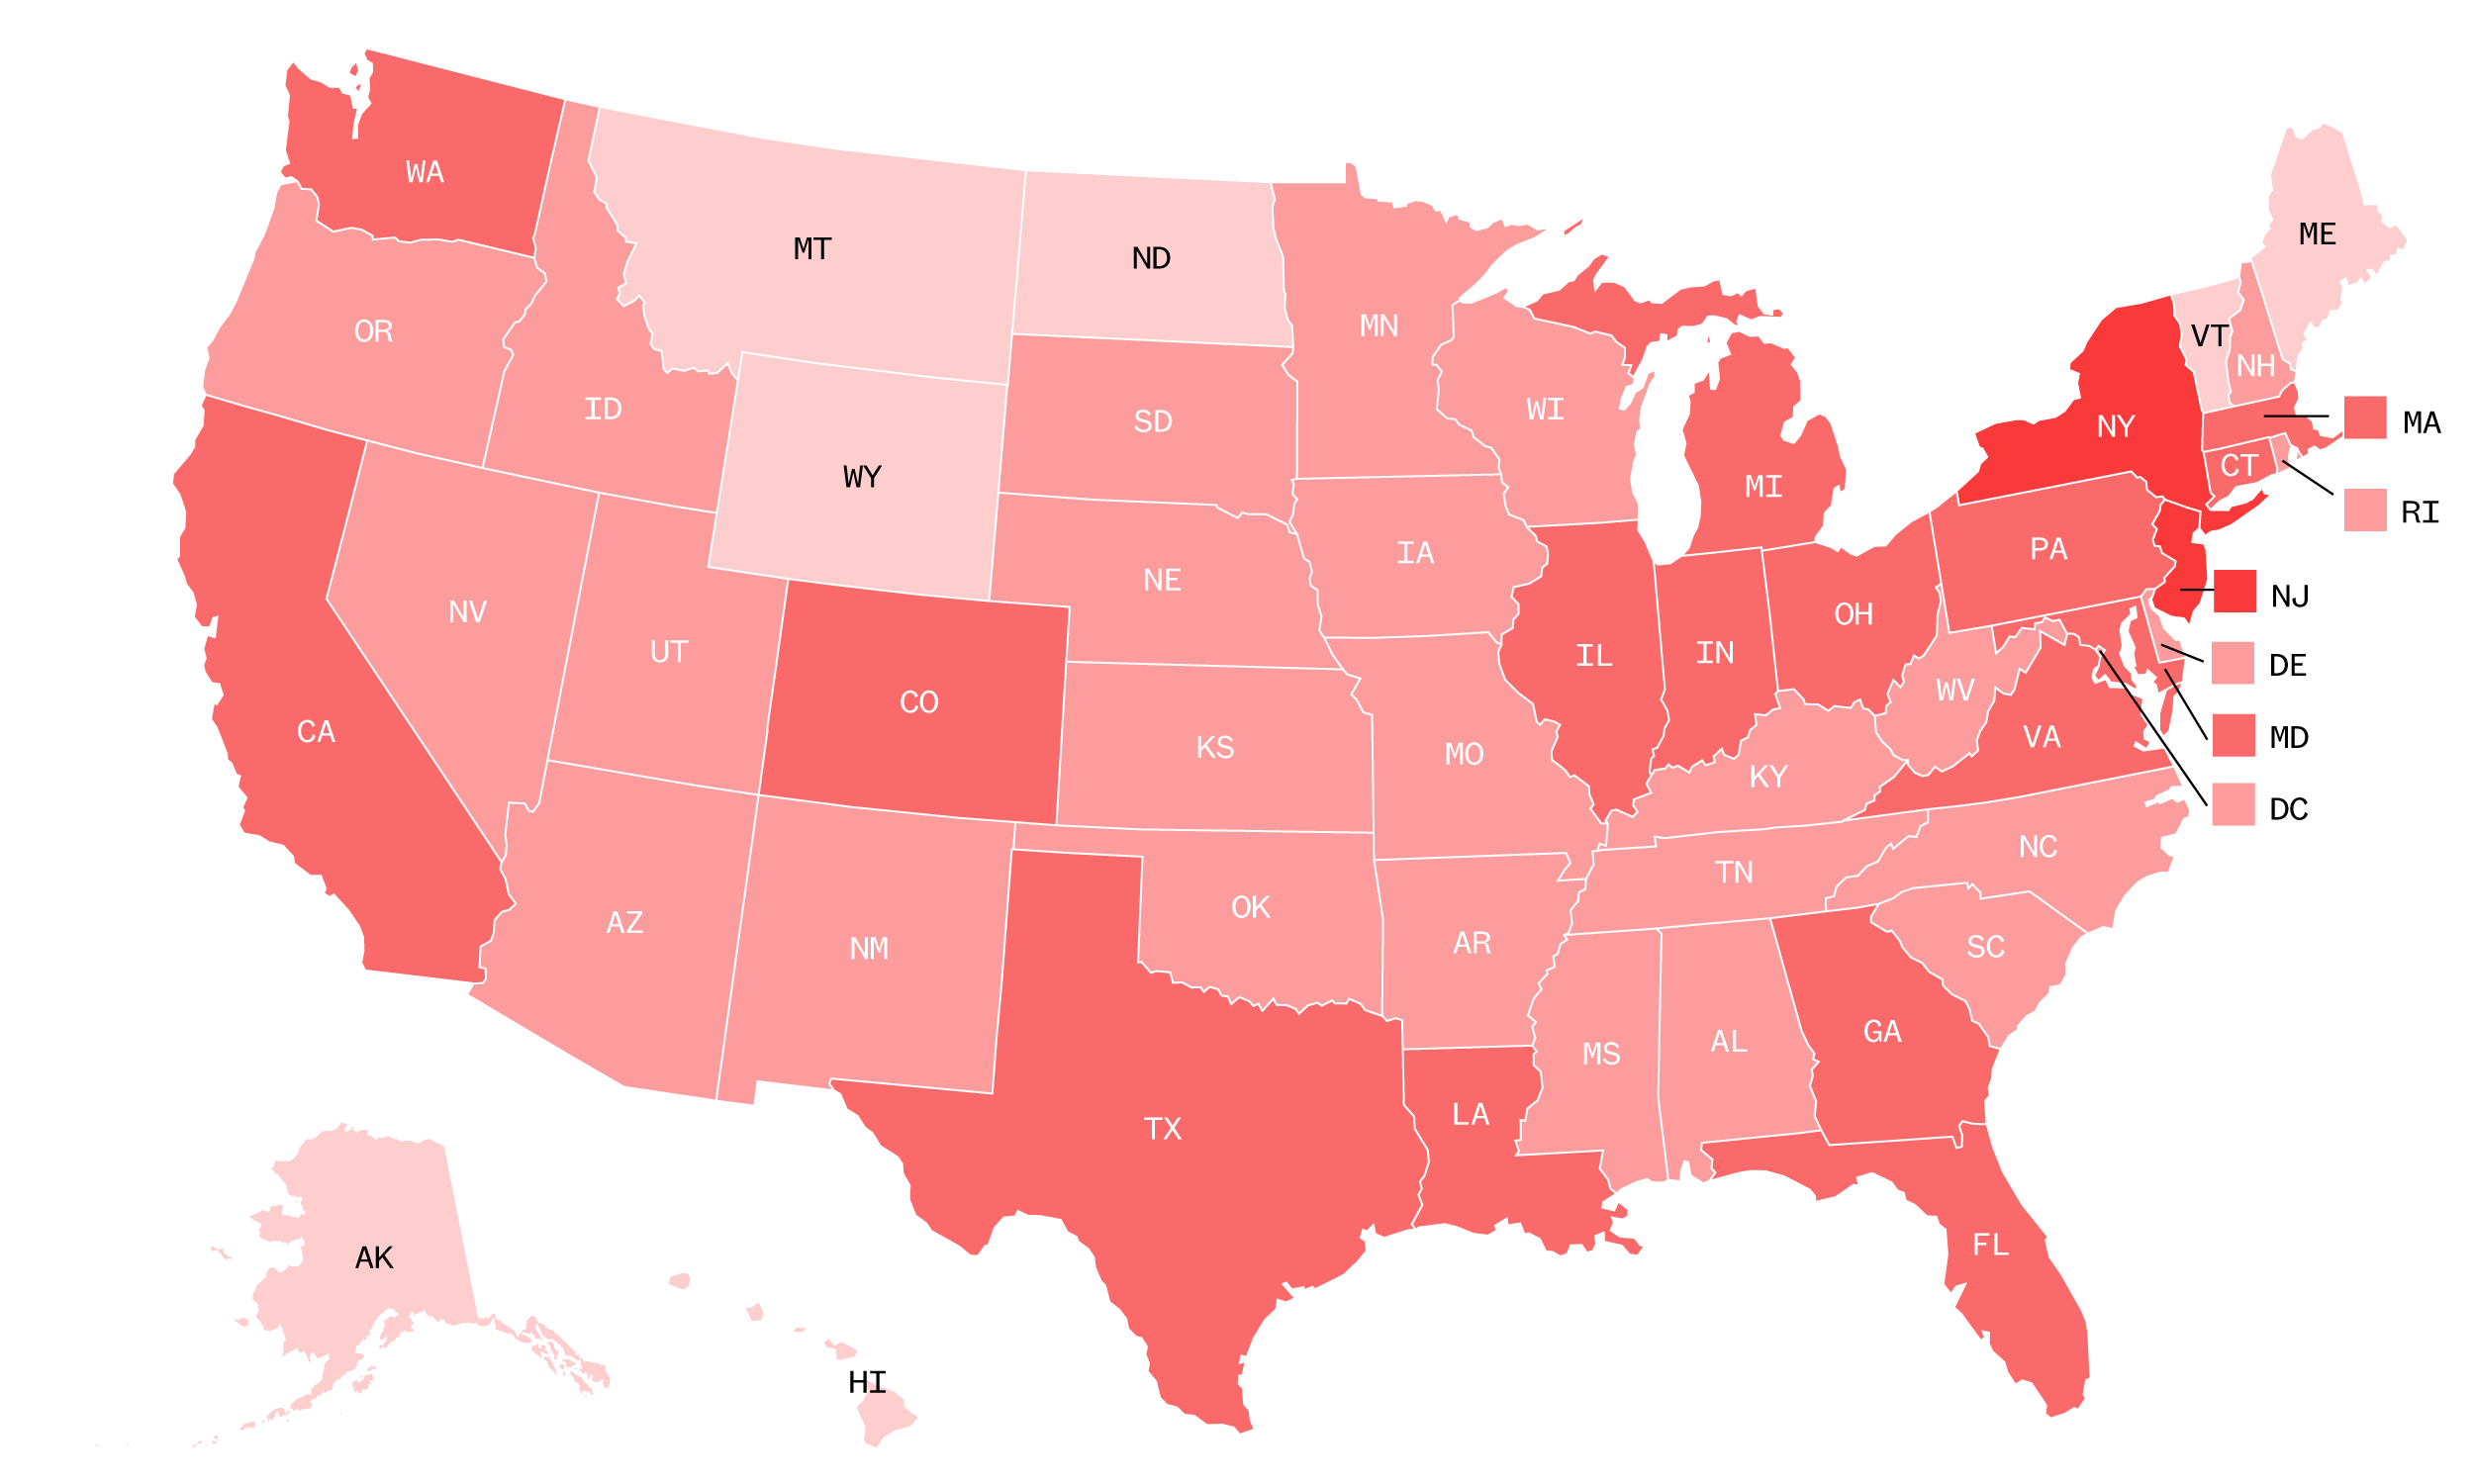
99% of Expected Vote
| State Name | Total Electoral Votes | Percent In | Candidates | Link to Page |
|---|---|---|---|---|
| Alaska | 3 | 99% |
| Go to results page |
| Alabama | 9 | 100% |
| Go to results page |
| Arizona | 11 | 100% |
| Go to results page |
| Arkansas | 6 | 100% |
| Go to results page |
| California | 55 | 100% |
| Go to results page |
| Colorado | 9 | 100% |
| Go to results page |
| Connecticut | 7 | 100% |
| Go to results page |
| Delaware | 3 | 100% |
| Go to results page |
| District of Columbia | 3 | 100% |
| Go to results page |
| Florida | 29 | 100% |
| Go to results page |
| Georgia | 16 | 100% |
| Go to results page |
| Hawaii | 4 | 100% |
| Go to results page |
| Idaho | 4 | 100% |
| Go to results page |
| Illinois | 20 | 100% |
| Go to results page |
| Indiana | 11 | 100% |
| Go to results page |
| Iowa | 6 | 100% |
| Go to results page |
| Kansas | 6 | 100% |
| Go to results page |
| Kentucky | 8 | 100% |
| Go to results page |
| Louisiana | 8 | 100% |
| Go to results page |
| Maine | 4 | 100% |
| Go to results page |
| Maryland | 10 | 100% |
| Go to results page |
| Massachusetts | 11 | 100% |
| Go to results page |
| Michigan | 16 | 100% |
| Go to results page |
| Minnesota | 10 | 100% |
| Go to results page |
| Mississippi | 6 | 100% |
| Go to results page |
| Missouri | 10 | 100% |
| Go to results page |
| Montana | 3 | 100% |
| Go to results page |
| Nebraska | 5 | 100% |
| Go to results page |
| Nevada | 6 | 100% |
| Go to results page |
| New Hampshire | 4 | 100% |
| Go to results page |
| New Jersey | 14 | 100% |
| Go to results page |
| New Mexico | 5 | 100% |
| Go to results page |
| New York | 29 | 100% |
| Go to results page |
| North Carolina | 15 | 100% |
| Go to results page |
| North Dakota | 3 | 100% |
| Go to results page |
| Ohio | 18 | 100% |
| Go to results page |
| Oklahoma | 7 | 100% |
| Go to results page |
| Oregon | 7 | 100% |
| Go to results page |
| Pennsylvania | 20 | 100% |
| Go to results page |
| Rhode Island | 4 | 100% |
| Go to results page |
| South Carolina | 9 | 100% |
| Go to results page |
| South Dakota | 3 | 100% |
| Go to results page |
| Tennessee | 11 | 100% |
| Go to results page |
| Texas | 38 | 100% |
| Go to results page |
| Utah | 6 | 100% |
| Go to results page |
| Vermont | 3 | 100% |
| Go to results page |
| Virginia | 13 | 100% |
| Go to results page |
| Washington | 12 | 100% |
| Go to results page |
| West Virginia | 5 | 100% |
| Go to results page |
| Wisconsin | 10 | 100% |
| Go to results page |
| Wyoming | 3 | 100% |
| Go to results page |
Races to Watch
Races to Watch
expected
vote in
- 49.4%
- 47.9%
- 49.5%
- 44.9%
- 50.6%
- 52.4%
- 50.1%
- 52.7%
- 48.6%
- 45.2%
- 50%
- 46.5%
- 49.5%
- 1,672,143
- 5,297,045
- 2,473,633
- 759,061
- 2,804,040
- 1,717,077
- 703,486
- 424,921
- 2,684,292
- 2,679,165
- 3,459,923
- 5,259,126
- 1,630,673
- 49.1%
- 51.2%
- 49.2%
- 53.1%
- 47.8%
- 45.3%
- 47.7%
- 45.4%
- 49.9%
- 53.3%
- 48.8%
- 52.1%
- 48.8%
- 1,661,686
- 5,668,731
- 2,461,854
- 897,672
- 2,649,852
- 1,484,065
- 669,890
- 365,654
- 2,758,773
- 3,154,834
- 3,378,263
- 5,890,347
- 1,610,065
expected
vote in
- 100% in
- 100% in
- 100% in
- 100% in
- 100% in
- 100% in
- 100% in
- 100% in
- 100% in
- 100% in
- 100% in
- 100% in
- 100% in
Early voting nationally
National numbers only include states where there is some type of early voting and data is available. It does not represent all registered voters. In 2016, 40.8% of all voters nationwide voted early (17.7% absentee, 5.9% by mail, 17.2% early in-person).
Mail-in and early in-person ballots returned101,270,431Nationally
Mail-in ballots requested89,147,572
More to the Story in 2020
The coronavirus pandemic and devastating economic fallout are two major issues impacting the election this year as voters assess which candidate is best suited to handle and combat the crisis. NBC News is tracking and updating daily the number of coronavirus related deaths in each state and U.S. territory, as well as tracking the jobless claims as reported weekly by the Department of Labor.
| U.S. Cases | Weekly change | 60-day trend | Monthly change |
|---|---|---|---|
| 100,472,464 | +0.00% | +0.00% | |
| 3,294,521 | -11.00% | +2.00% |
| U.S. Claims | Weekly change | 60-day trend | Monthly change |
|---|---|---|---|
| 3,690,000 | +1.01% | -0.99% | |
| 113,877 | -6.20% | -28.26% |
Voting trends
2016
2016 Results- Democrat
Hillary ClintonClinton
48.5%65,853,516
- Republican
Donald TrumpTrumpWinner
46.4%62,984,825
2016 Exit Polls
Summary of 2016 Exit Poll data that shows the proportion of how different groups voted.
2012
2012 Results- Democrat
Barack ObamaObamaWinner
51.1%65,914,971
- Republican
Mitt RomneyRomney
47.3%60,930,663
2012 Exit Polls
Summary of 2012 Exit Poll data that shows the proportion of how different groups voted.
The expected vote is the total number of votes that are expected in a given race once all votes are counted. This number is an estimate and is based on several different factors, including information on the number of votes cast early as well as information provided to our vote reporters on Election Day from county election officials. The figure can change as NBC News gathers new information.
Source: TargetSmart provides individual-level voterfile data state-by-state, including ballot requests and early in-person/mail in-voting absentee early vote data. The NBC News Decision Desk independently analyzes and aggregates the data.
Source: National Election Pool (NEP)
More 2020 coverage