2022 The Year On-chain
As the chaotic, volatile, and financially brutal year of 2022 comes to a close, we explore the state of play across Bitcoin, Ethereum and stablecoin markets. This year in review will be the final edition for the year, and we look forward to returning for an exciting 2023.


2022 has been one of the most chaotic, volatile, and financially brutal years, not only for the digital asset industry, but also for wider financial markets. With central bank monetary policy performing a 180 degree U-turn, and following decades of extremely loose and easy credit conditions, tightening conditions have caused severe and rapid drawdowns across most asset classes.
This edition of The Week On-chain will be our final one for the year (unless a major industry moving event inspires us for an encore). As such, we will provide a high level overview of the year that was, and where we are in the setup for 2023. In this piece we will cover:
- Volatility, Derivatives, and Futures leverage.
- The severity of realized losses over the last year.
- Bitcoin on-chain supply structure and concentrations.
- Cooling off in the Bitcoin mining sector.
- Ethereum post-Merge supply dynamics.
- Evolving trends in Ethereum gas consumption dominance.
- Shifting trends and dominance in Stablecoin markets.
From the Glassnode team: To all readers of The Week On-chain, and to Glassnode members, we want to thank you all for your support and readership this year. We certainly hope you enjoyed reading the WoC, and using Glassnode tools, as much as we enjoy writing and building them.
We wish you all the very best over the holiday season, and look forward to another exciting year in 2023.
A Quiet Future
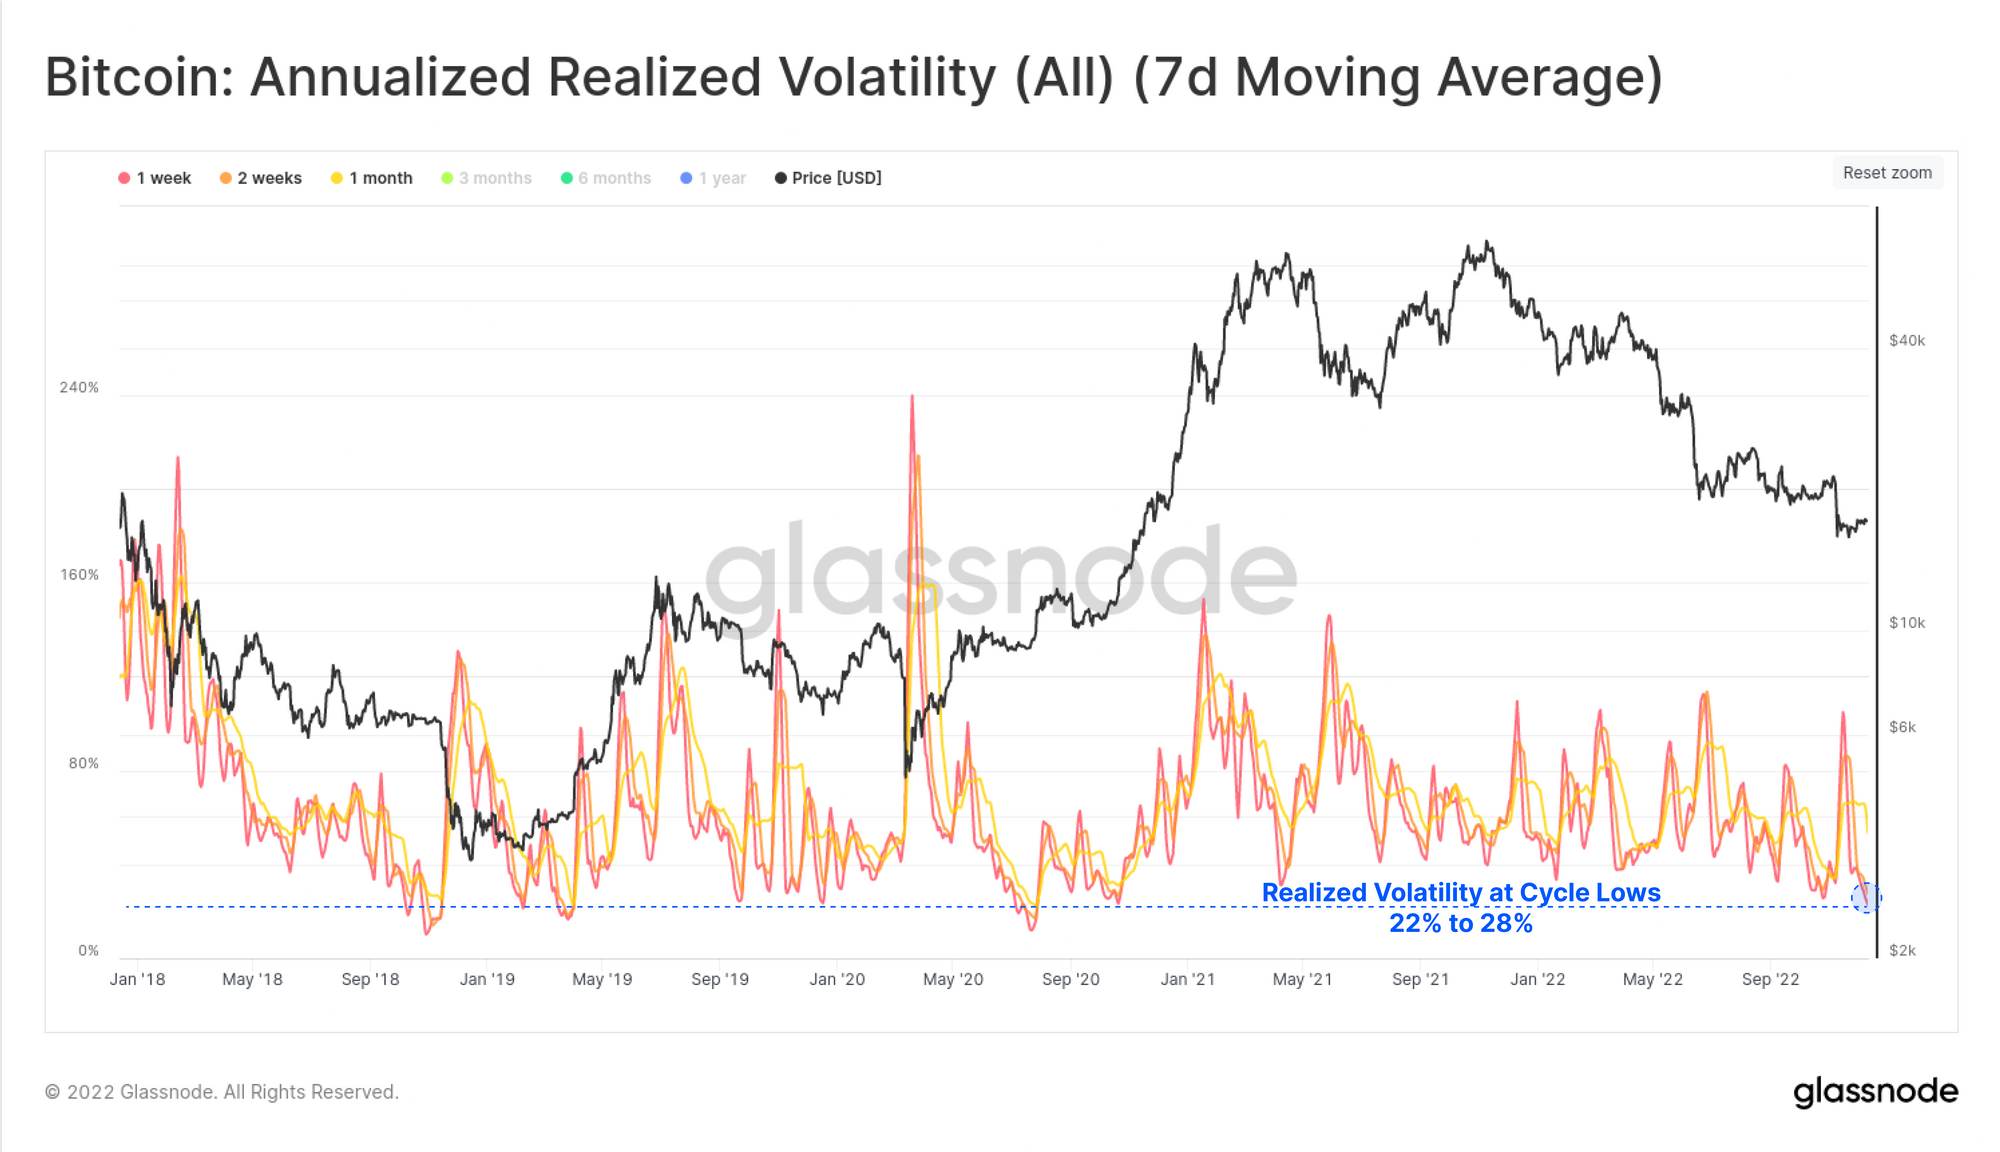
After what has been a truly chaotic year, the Bitcoin market has turned very quiet coming into December. Short-term realized volatility for BTC is currently at multi-year lows of 22% (1-week), and 28% (2-weeks), making for the lowest volatility regime since Oct 2020.
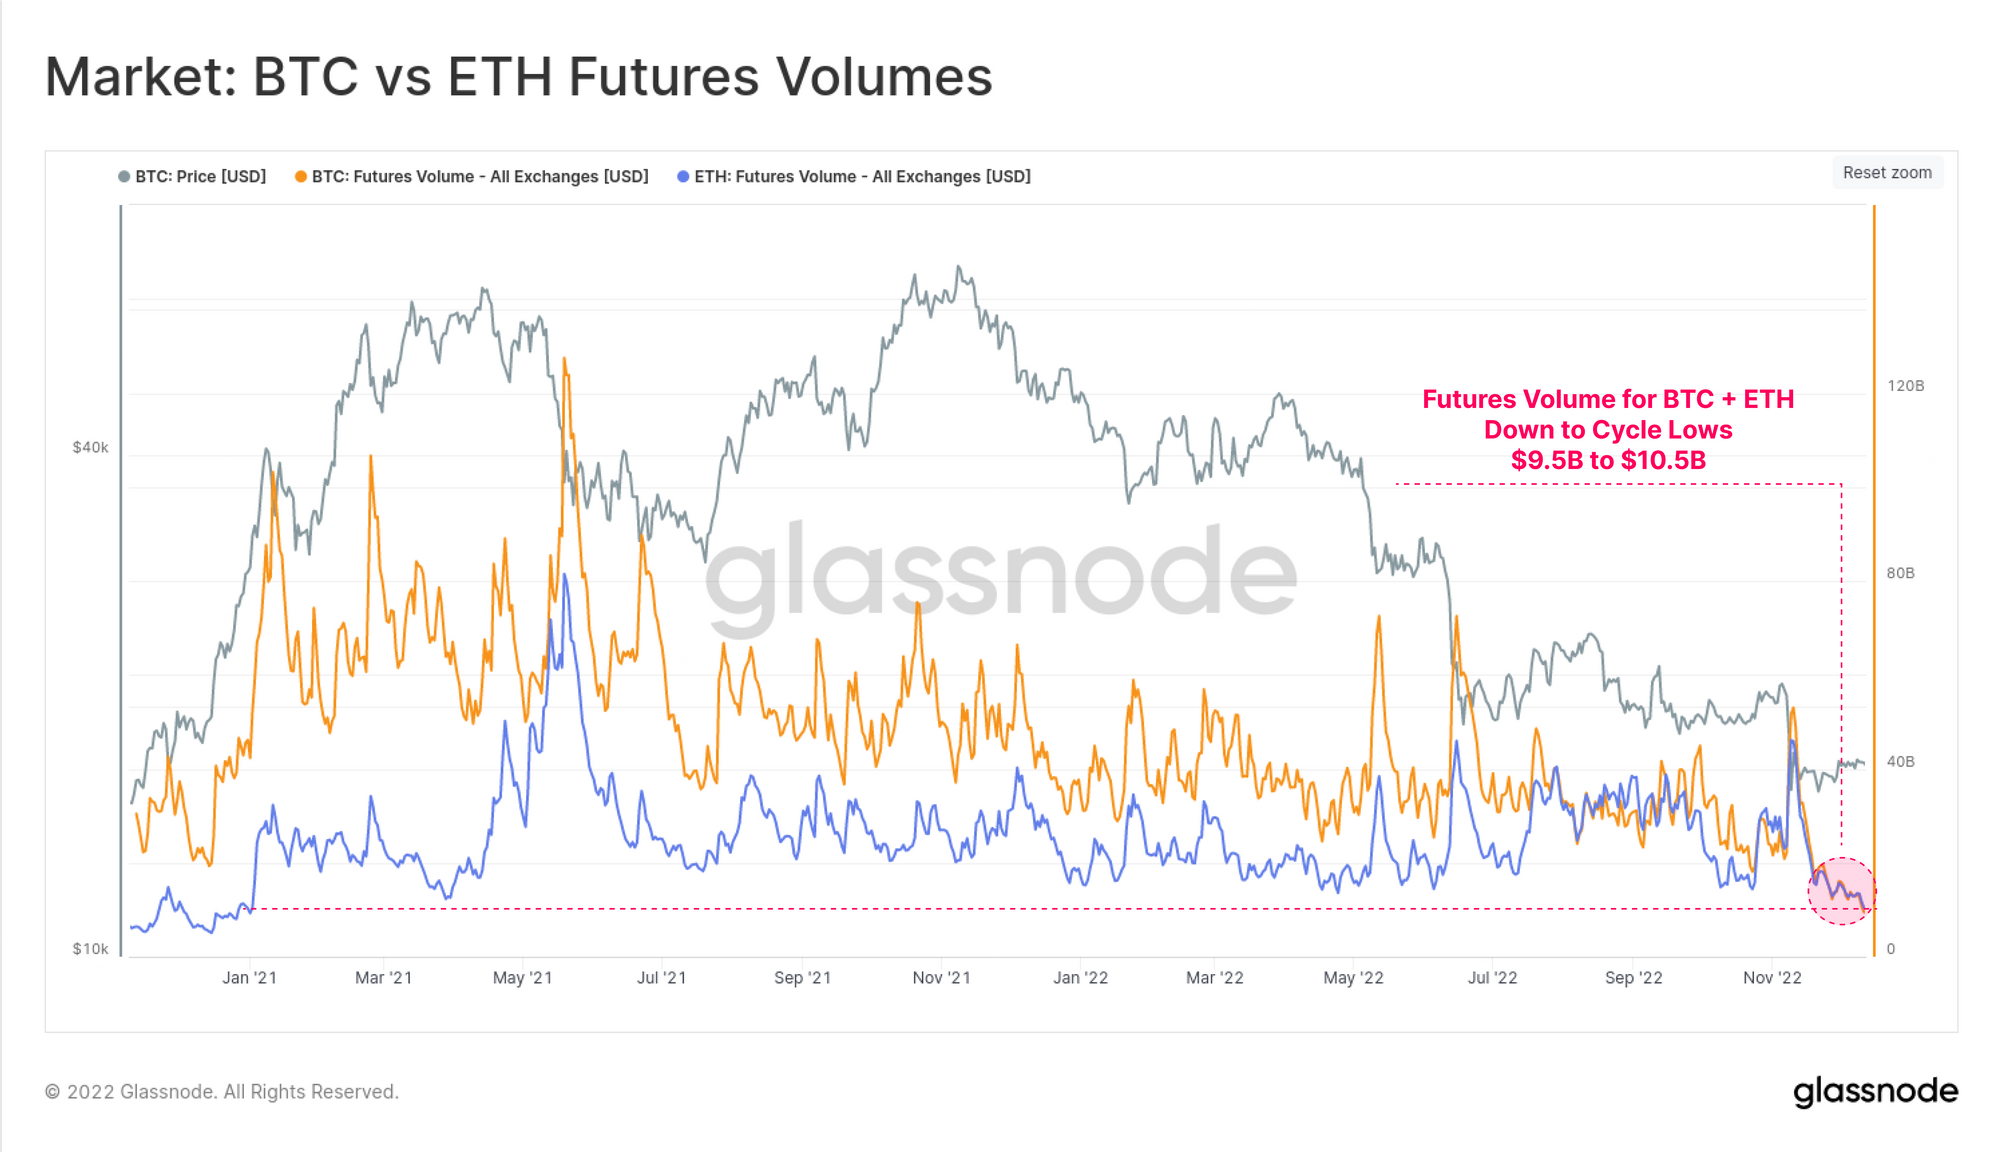
Futures volumes are similarly depressed, now probing multi-year lows. Both BTC and ETH markets are currently trading similar volumes between $9.5B and $10.5B per day. This shows the massive impact of tightening liquidity, widespread deleveraging, and the impairment of many lending and trading desks in the space.
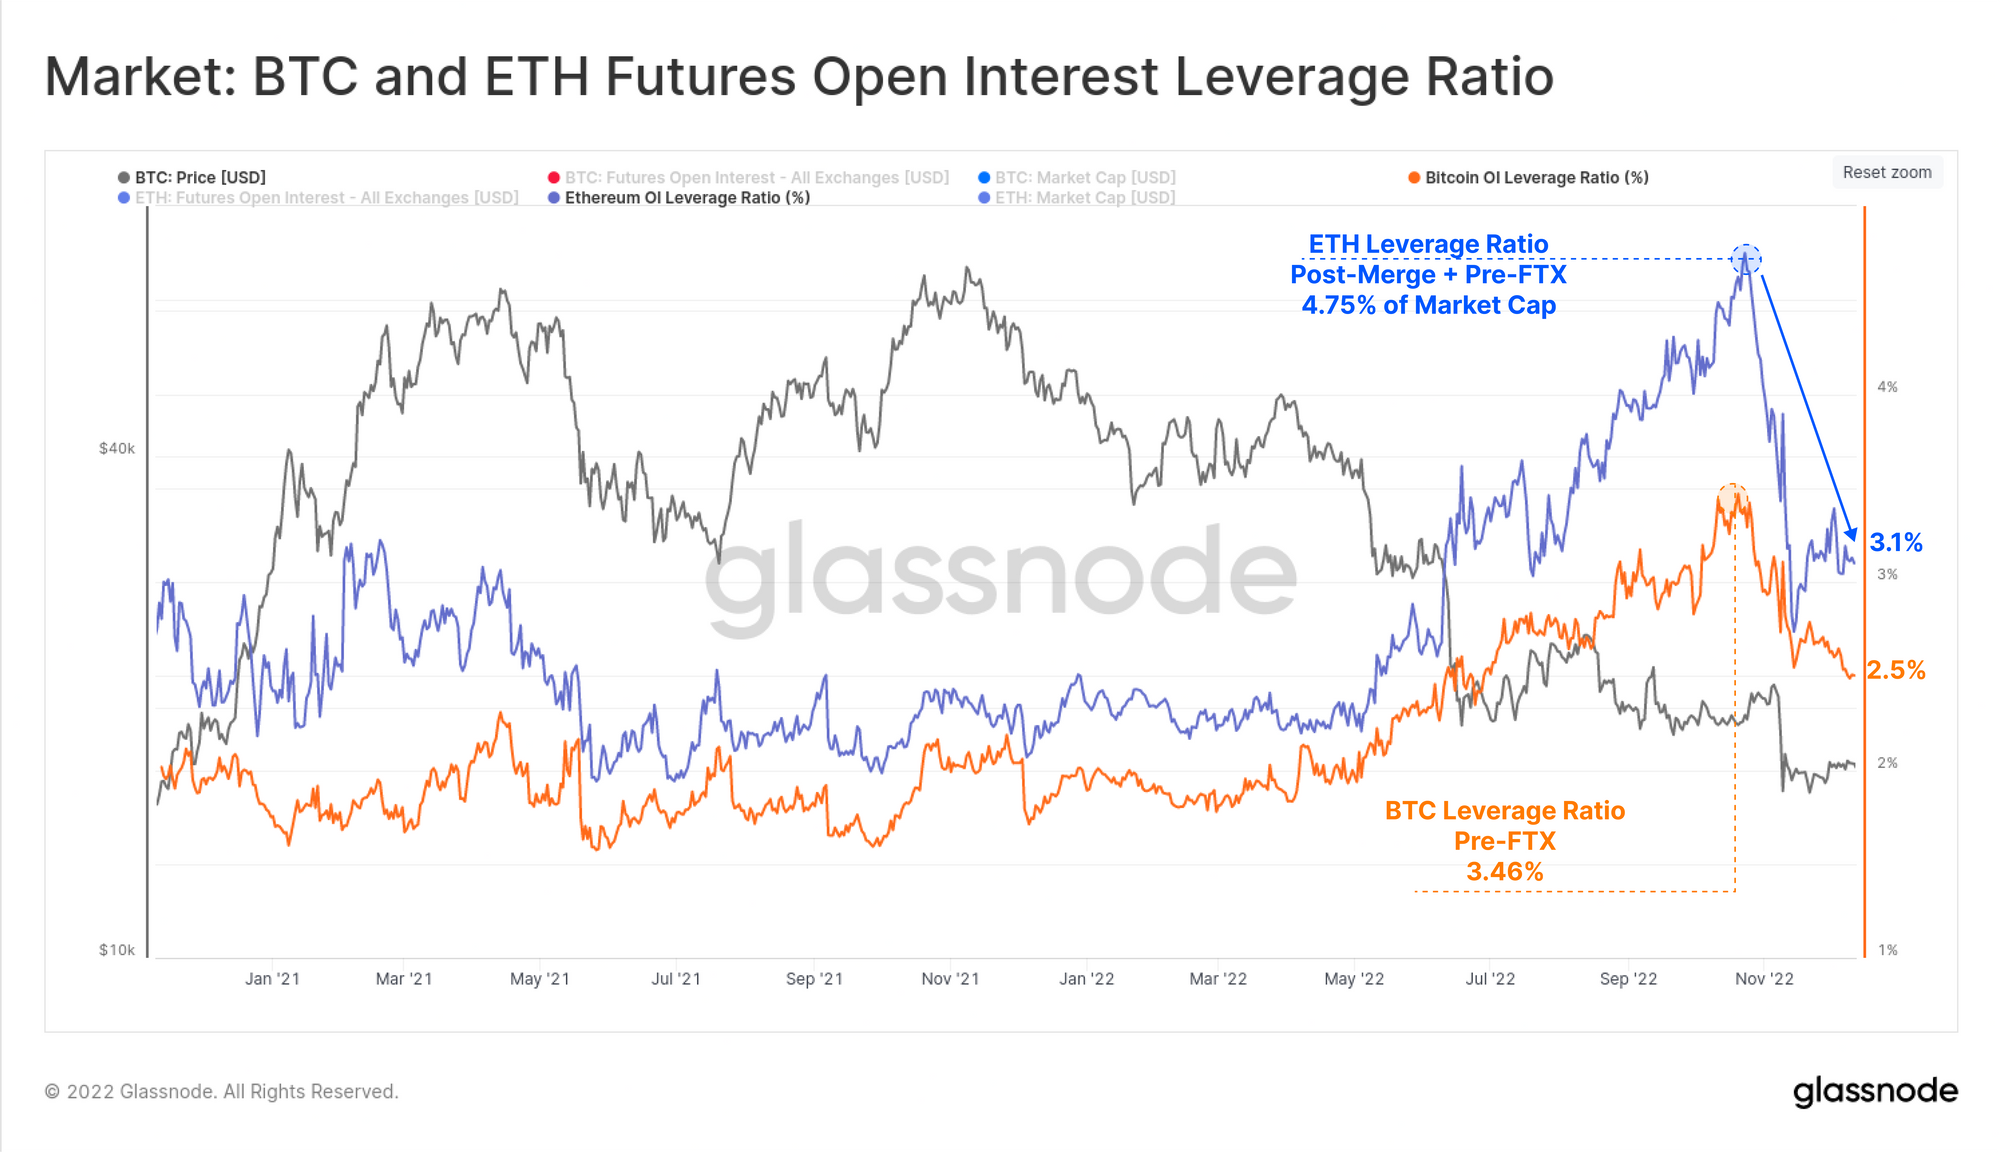
Open Interest in futures markets has pulled back significantly following the FTX implosion. The chart below shows the Leverage Ratio, calculated as the ratio between Futures Open Interest, and the corresponding asset market cap.
The build up, and unwind of futures leverage in November has been notably more severe for ETH, likely a result of residual 'Merge trades' being closed out. ETH open interest has fallen from 4.75%, to 3.10% of the Market cap. The BTC leverage ratio peaked a week before ETH markets, and has since declined from 3.46% to 2.50% of the market cap over the last month.
Both Bitcoin calendar futures and perpetual swaps are trading in a state of backwardation, with an annualized basis of -0.3%, and -2.5% respectively. Sustained periods of backwardation are uncommon, with the only similar period being the consolidation between May and July 2021. This suggests the market is relatively 'hedged' for further downside risk, and/or heavier with short speculators.

Giving Back to the Market
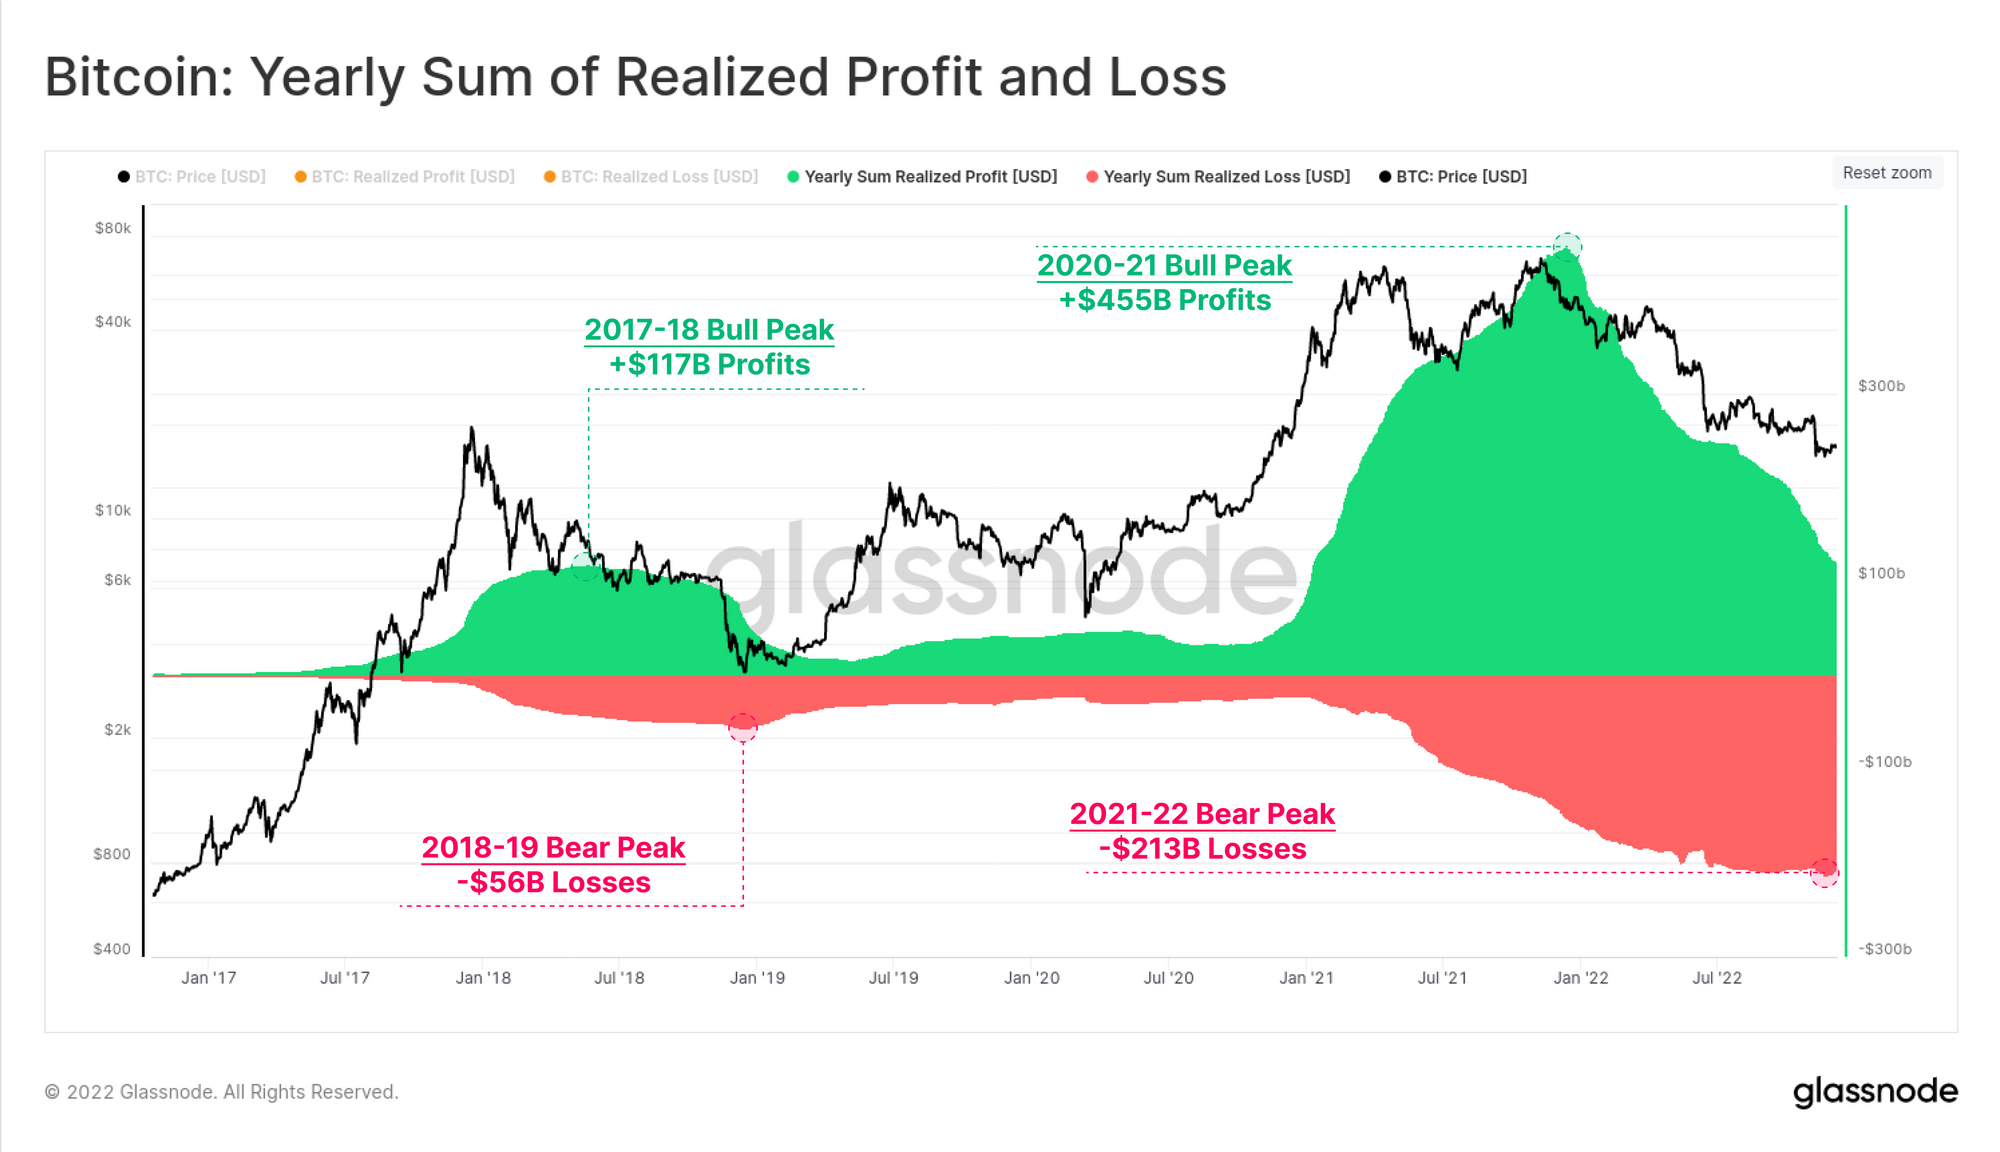
The excess liquidity bubble from the loose monetary policy era in 2020-21 created a record yearly total realized profit on-chain. Over $455 Billion in yearly profits were taken by Bitcoin investors moving funds on-chain, with the peak hit soon after the Nov 2021 ATH.
Since then, a bear market regime has dominated, and the market has given back over $213 Billion in realized losses. This equates to 46.8% of the 2020-21 bull profits, which is very similar in relative magnitude to the 2018 bear, where the market gave back 47.9%.
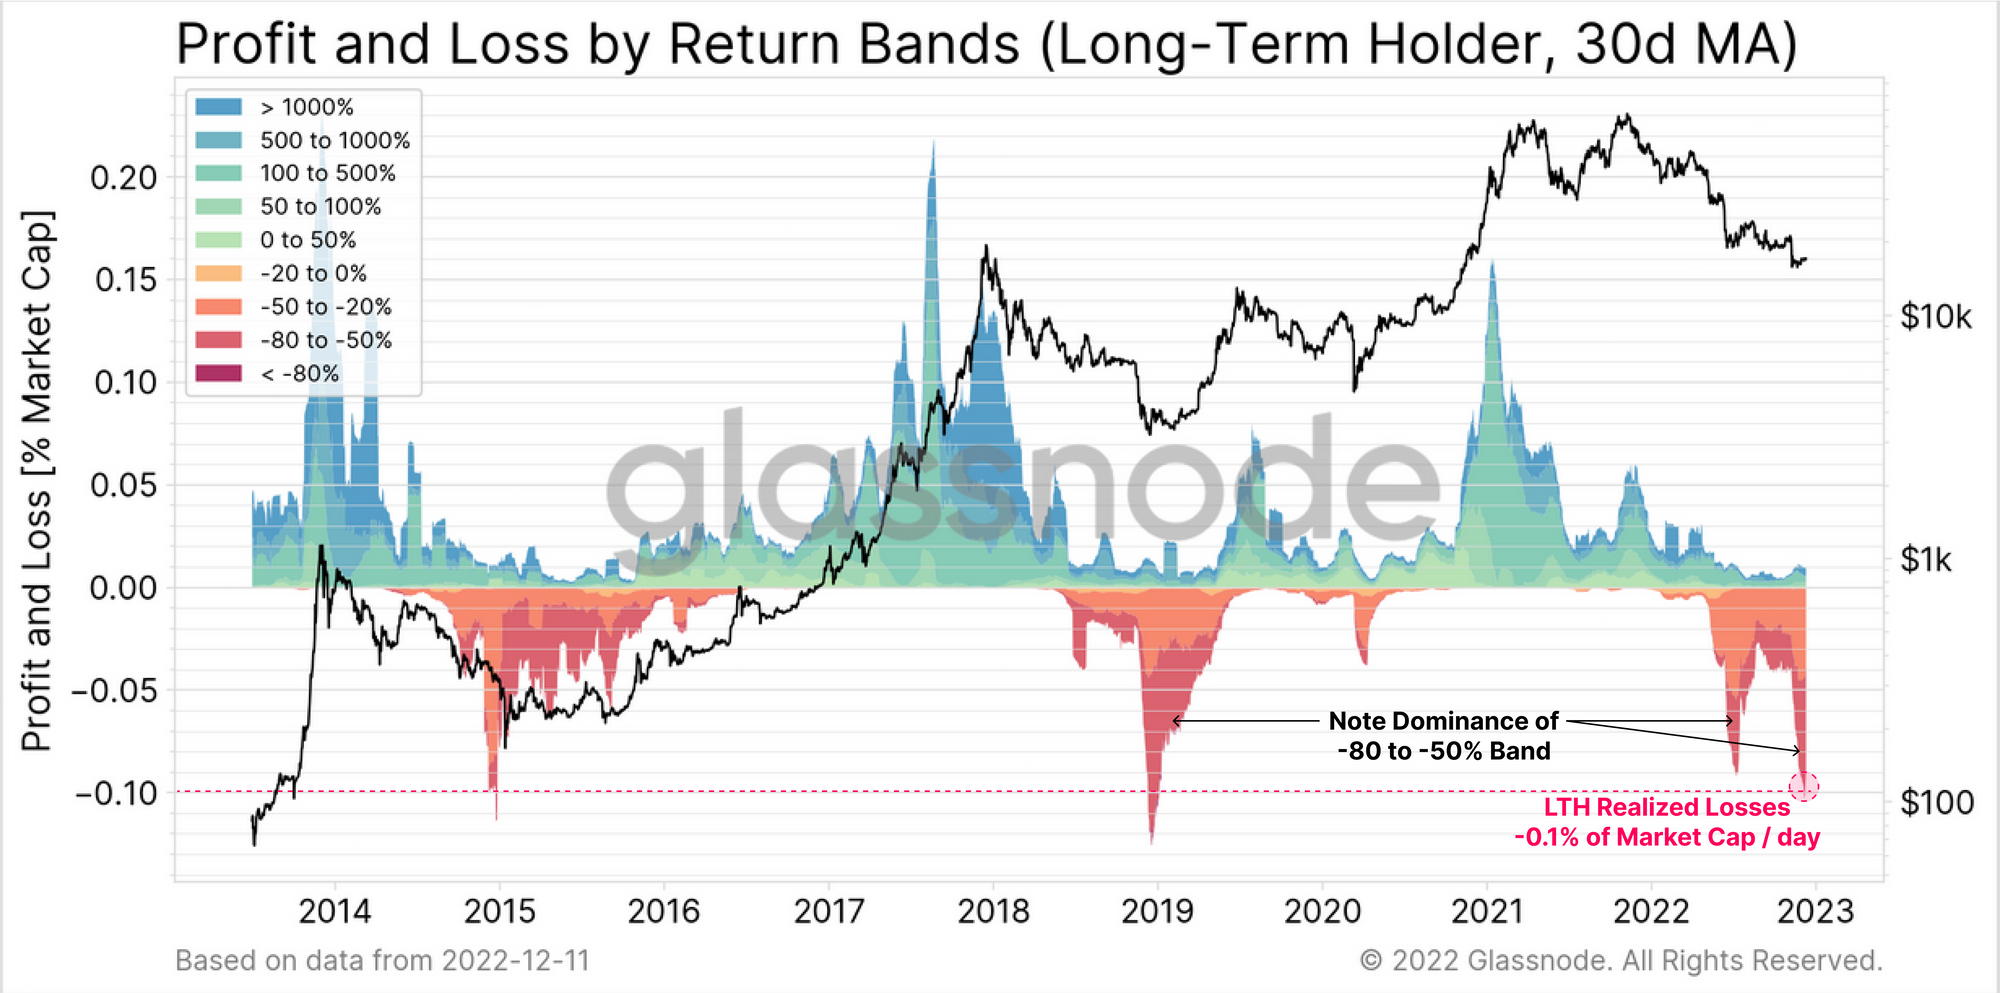
Of note is the contribution of Long-Term Holders, whom in this cycle realized two of the largest relative loss spikes in history. Through November, LTH losses peaked at -0.10% of the Market Cap per day, comparable in scale only to the 2015 and 2018 cycle lows. The sell-off in June is similarly impressive at -0.09% of the Market Cap per day, with heavy dominance of LTHs locking in -50% to -80% losses.
Taking a Long-Term View
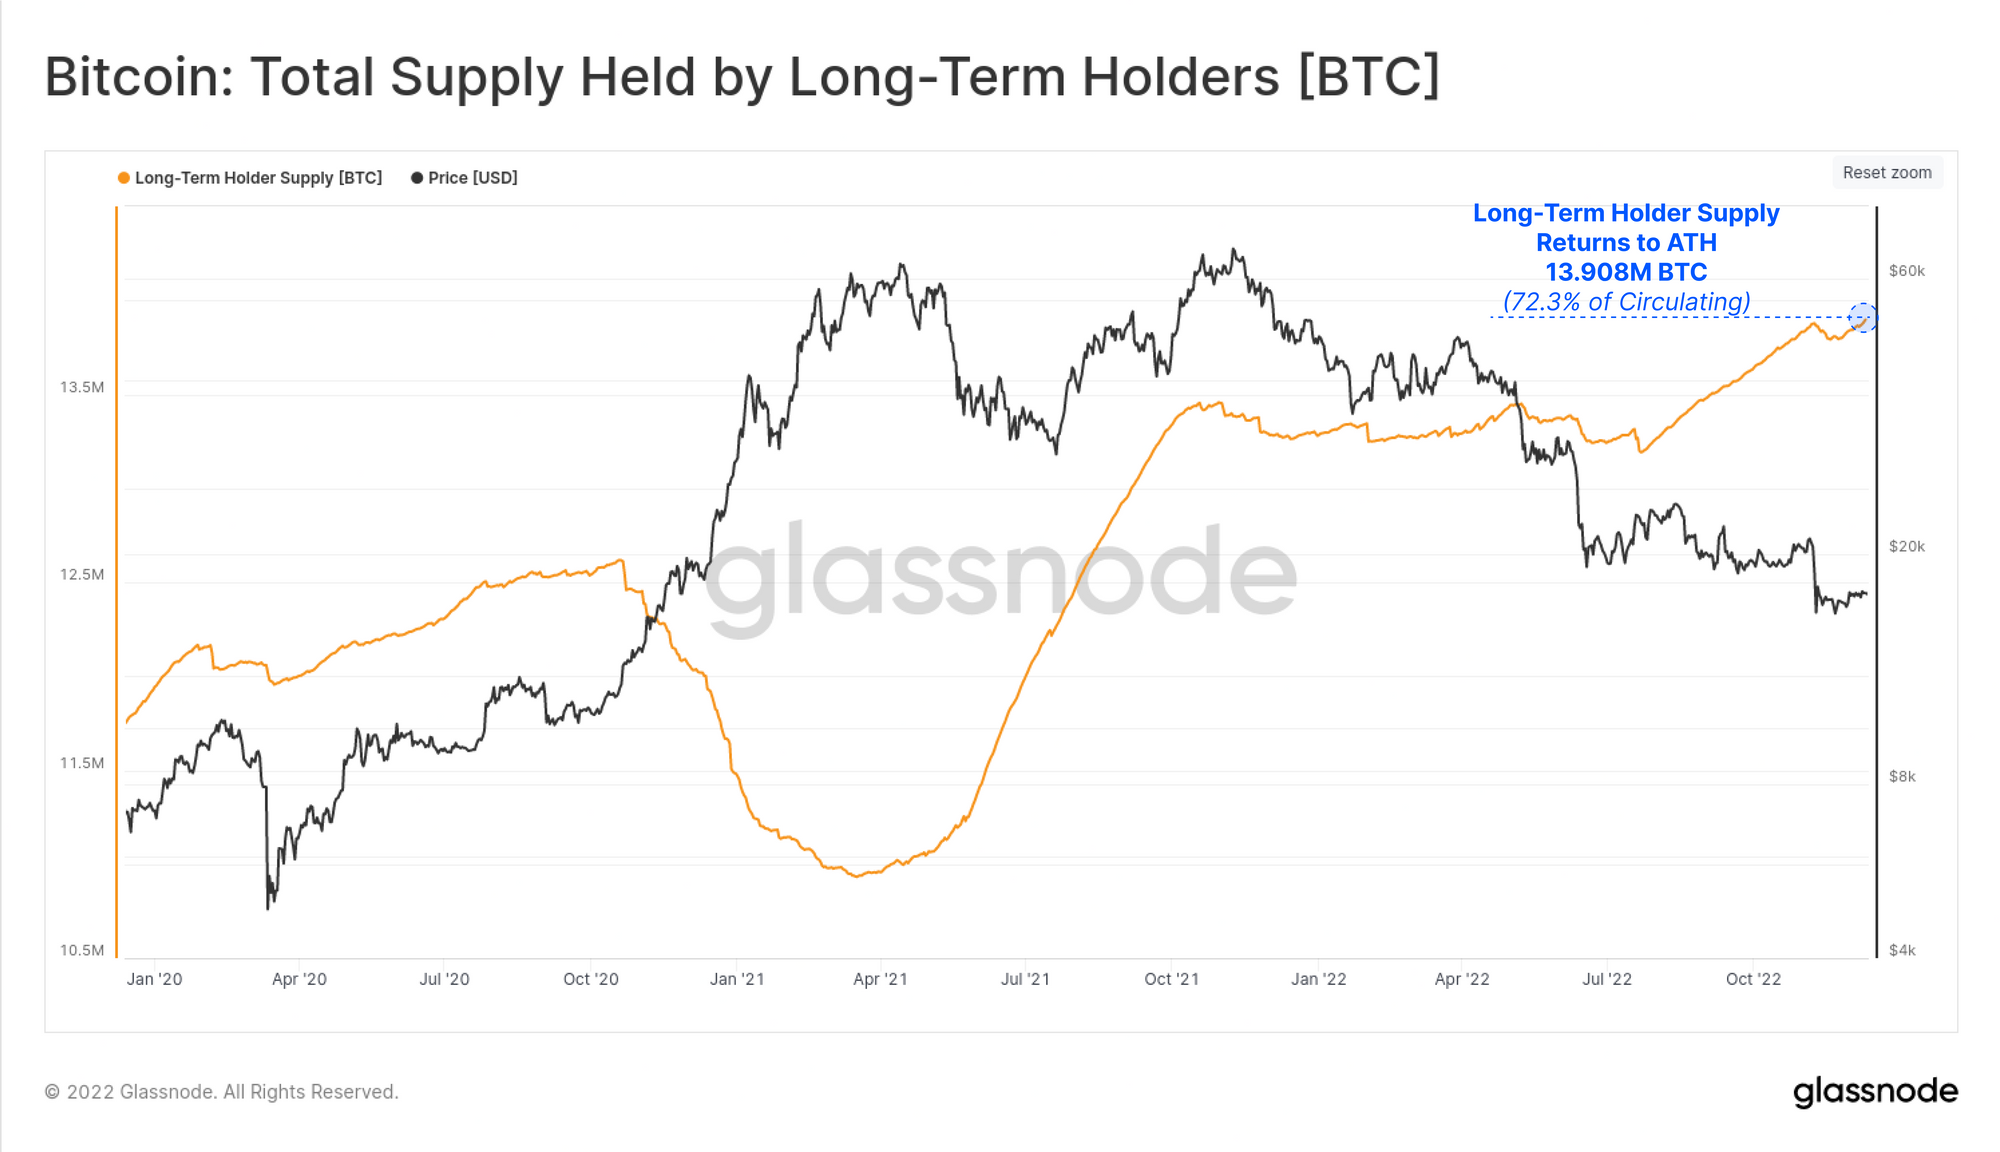
Despite these spectacularly large losses, the age of the coin supply, and propensity for HODLing by those who remain continues to rise. Long-Term Holder Supply has completely reverted the panic spending after the FTX fiasco, hitting a new ATH of 13.908M BTC (72.3% of circulating supply).
The near linear uptrend in this metric is a reflection of the heavy coin accumulation that occurred in June and July 2022, immediately after the deleveraging event inspired by 3AC and failing lenders in the space.
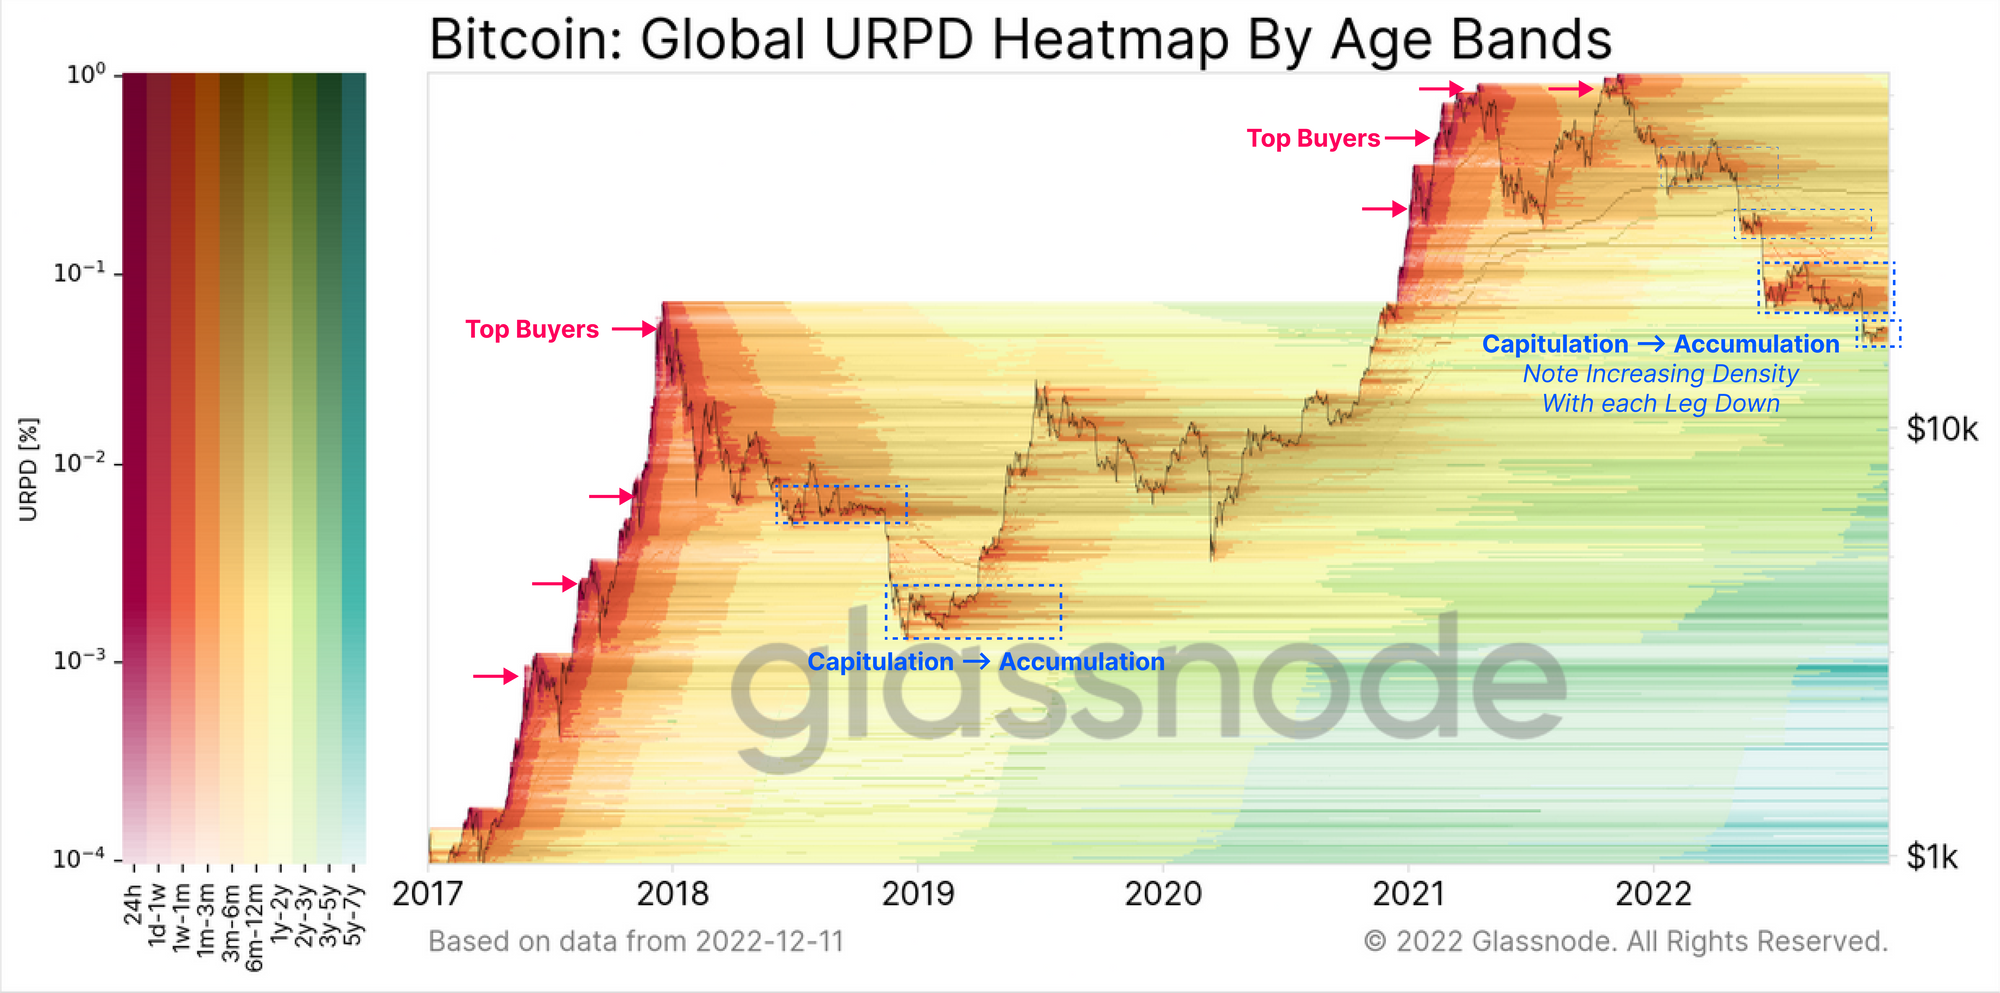
The chart below provides a view into the density and distribution of the coin-supply, colored by age bands.
- Warm colours indicate a heavy distribution by older coins, typically seen at market tops, and capitulation bottoms.
- Cooler colors indicate maturation, as investors accumulate and leave coins unspent.
- Darker bars indicate heavier coin density (and vice-versa for lighter bars).
After each market leg down in 2022, we can see density of coin re-distribution (and thus re-accumulation) has increased. In particular, the June to October 2022 zone stands out, with many coins acquired between $18k and $24k, which are now ageing into the 6-month+ band (hence the rising LTH Supply above).
A Hard Time for Miners
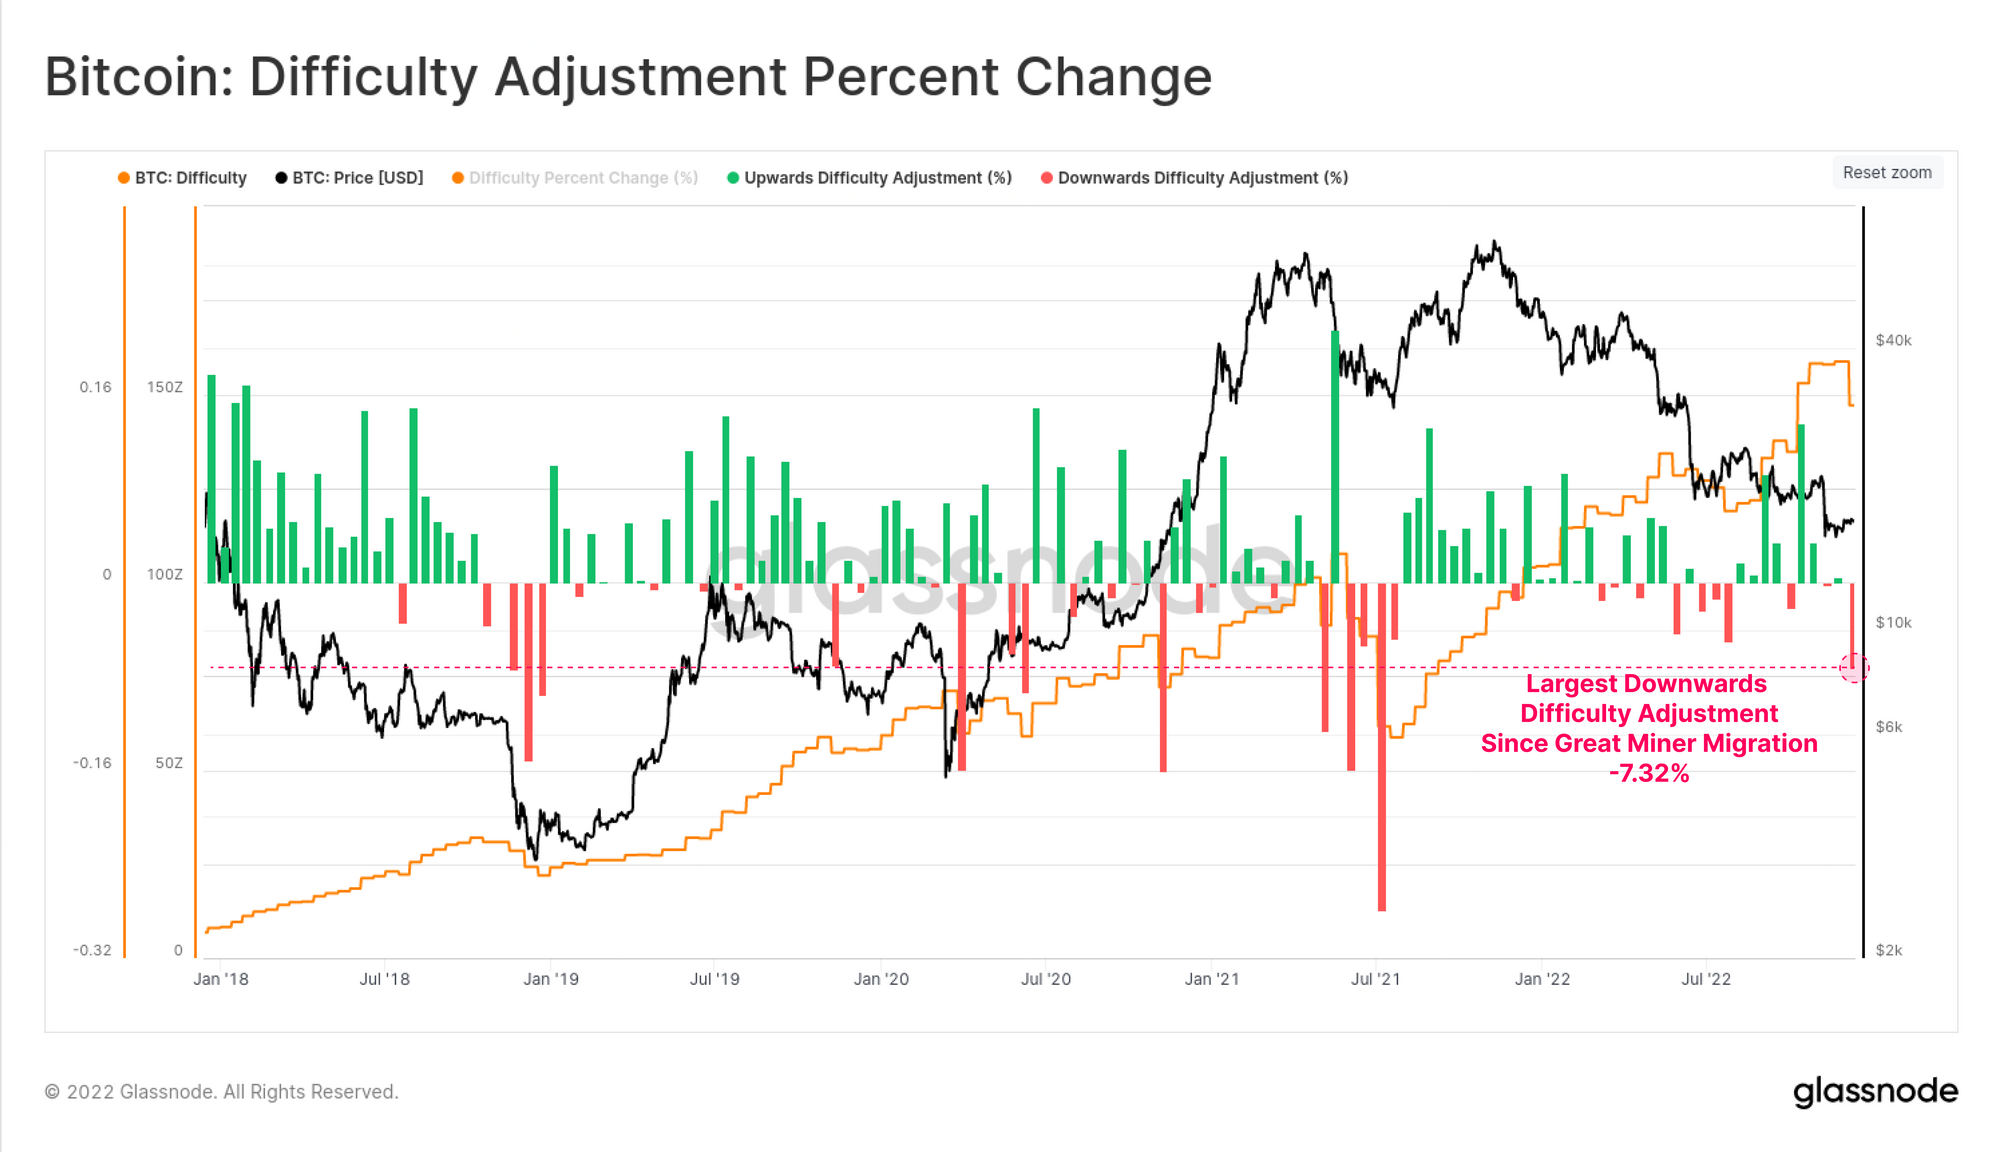
Last week saw the largest downwards difficulty adjustment since the Great Mining Migration in July 2021. Difficulty declined by 7.32%, signifying a reasonably large portion of the active hashrate was switched off, likely a result of continued income stress.
As a result, the hash-ribbons have inverted once again, with the cross-over occurring in late-Nov. This signifies that there is sufficient stress in the mining industry that some operators are taking ASIC rigs offline. This is typically associated with the miners income stream falling below their OPEX expense, making the rigs unprofitable.
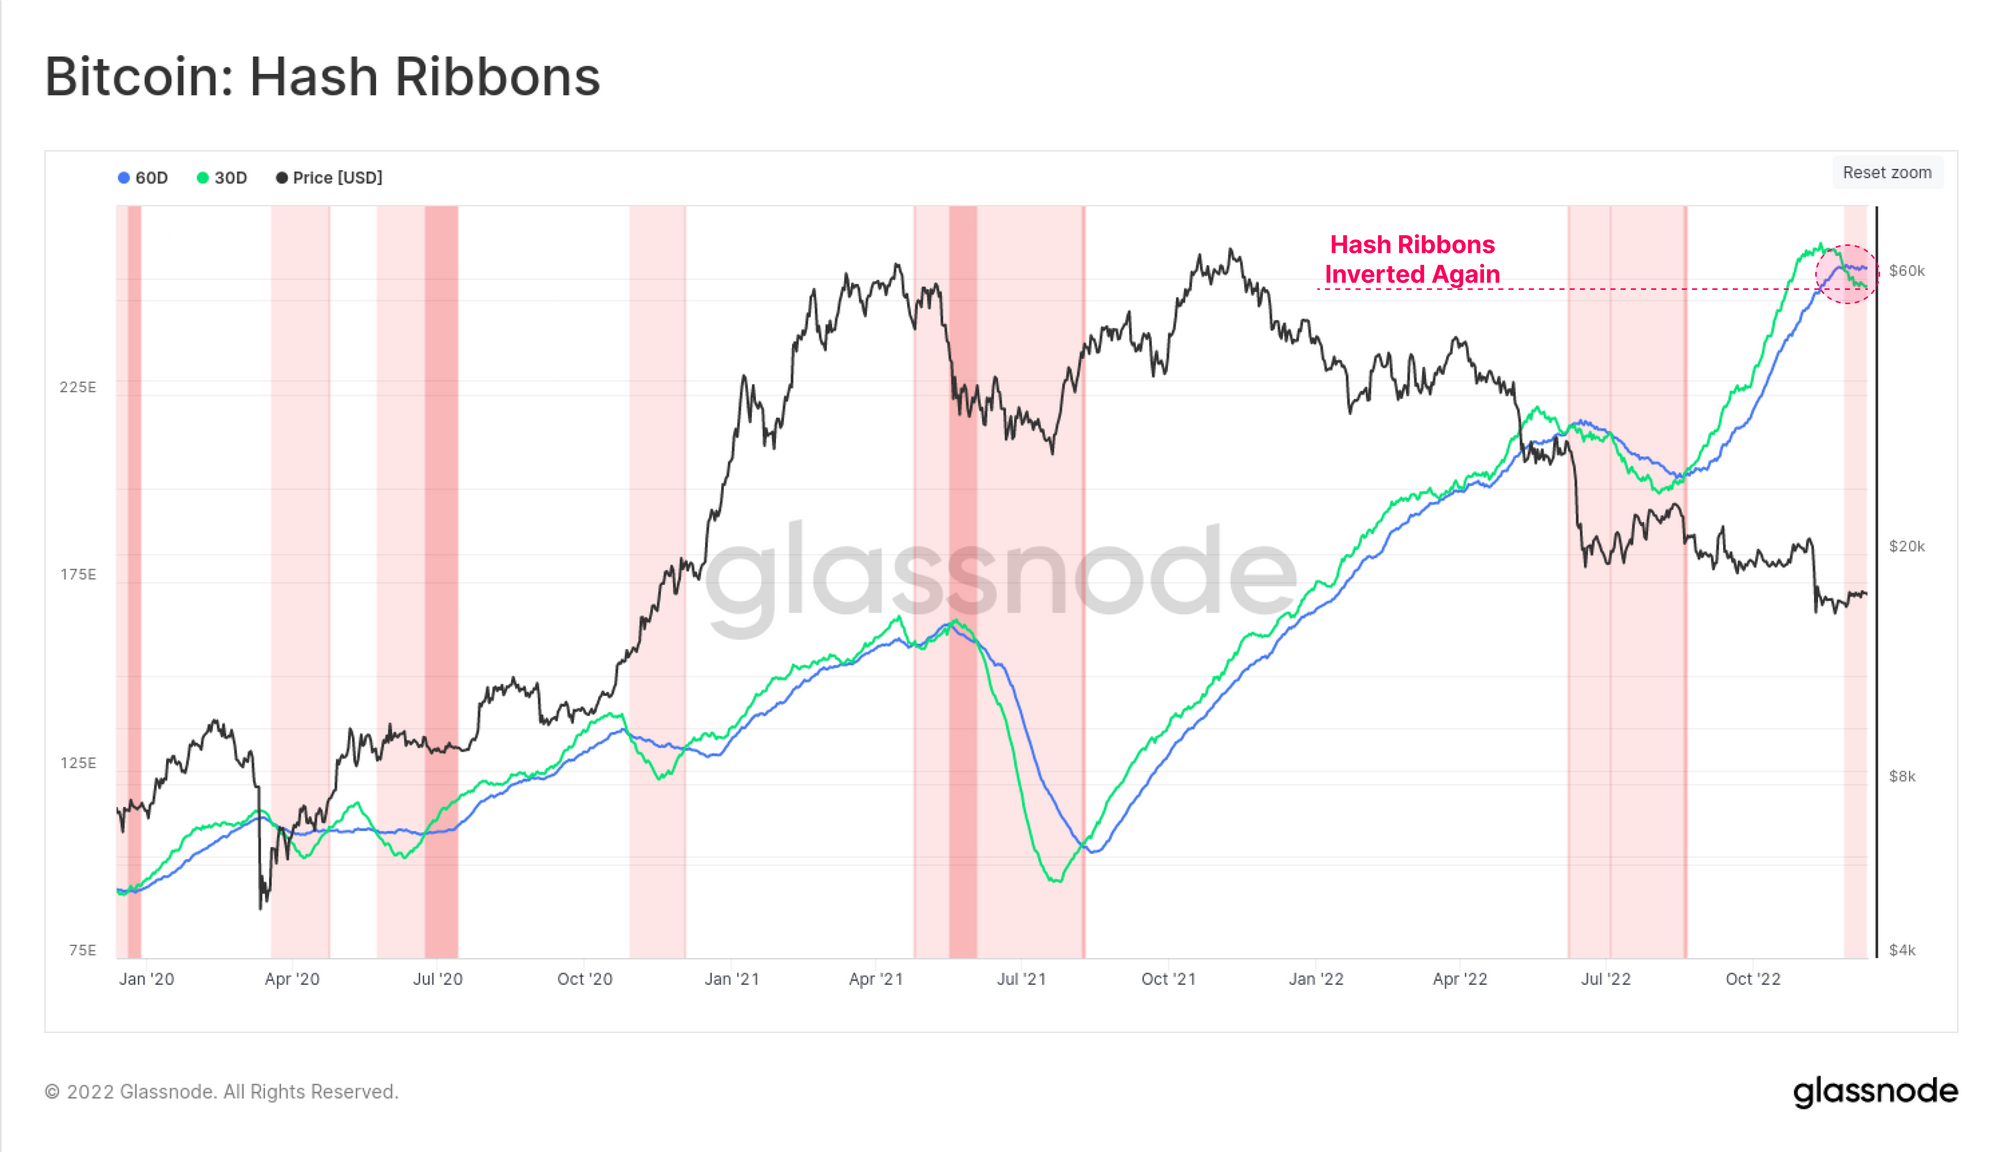
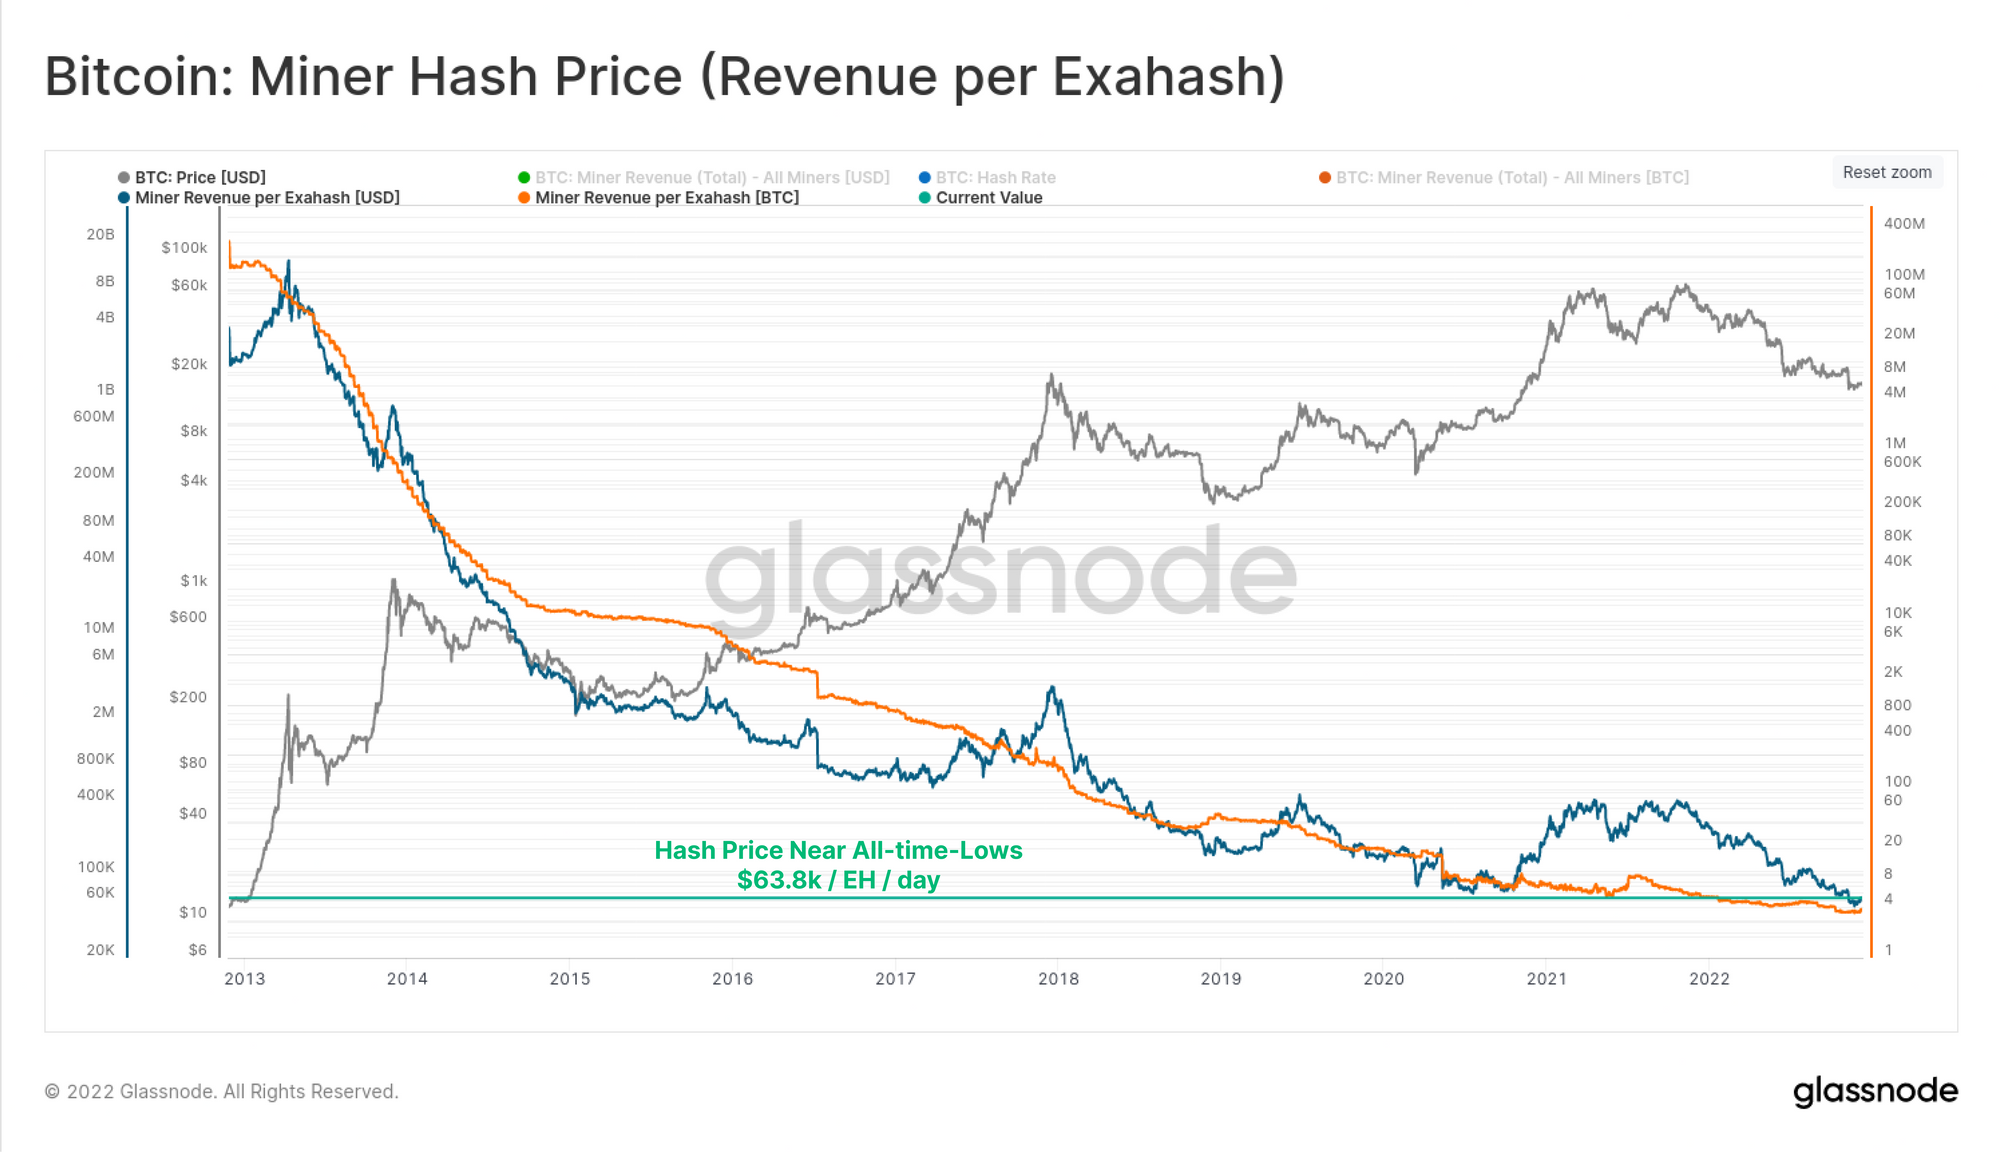
This doesn't come as too much of a surprise however, given that hash-price is only barely above all-time-lows. Despite spot prices (~$17k) being 70% higher than they were in October 2020 (~$10k), the amount of hashpower competing to find the next Bitcoin block is now 70% higher.
After the Merge
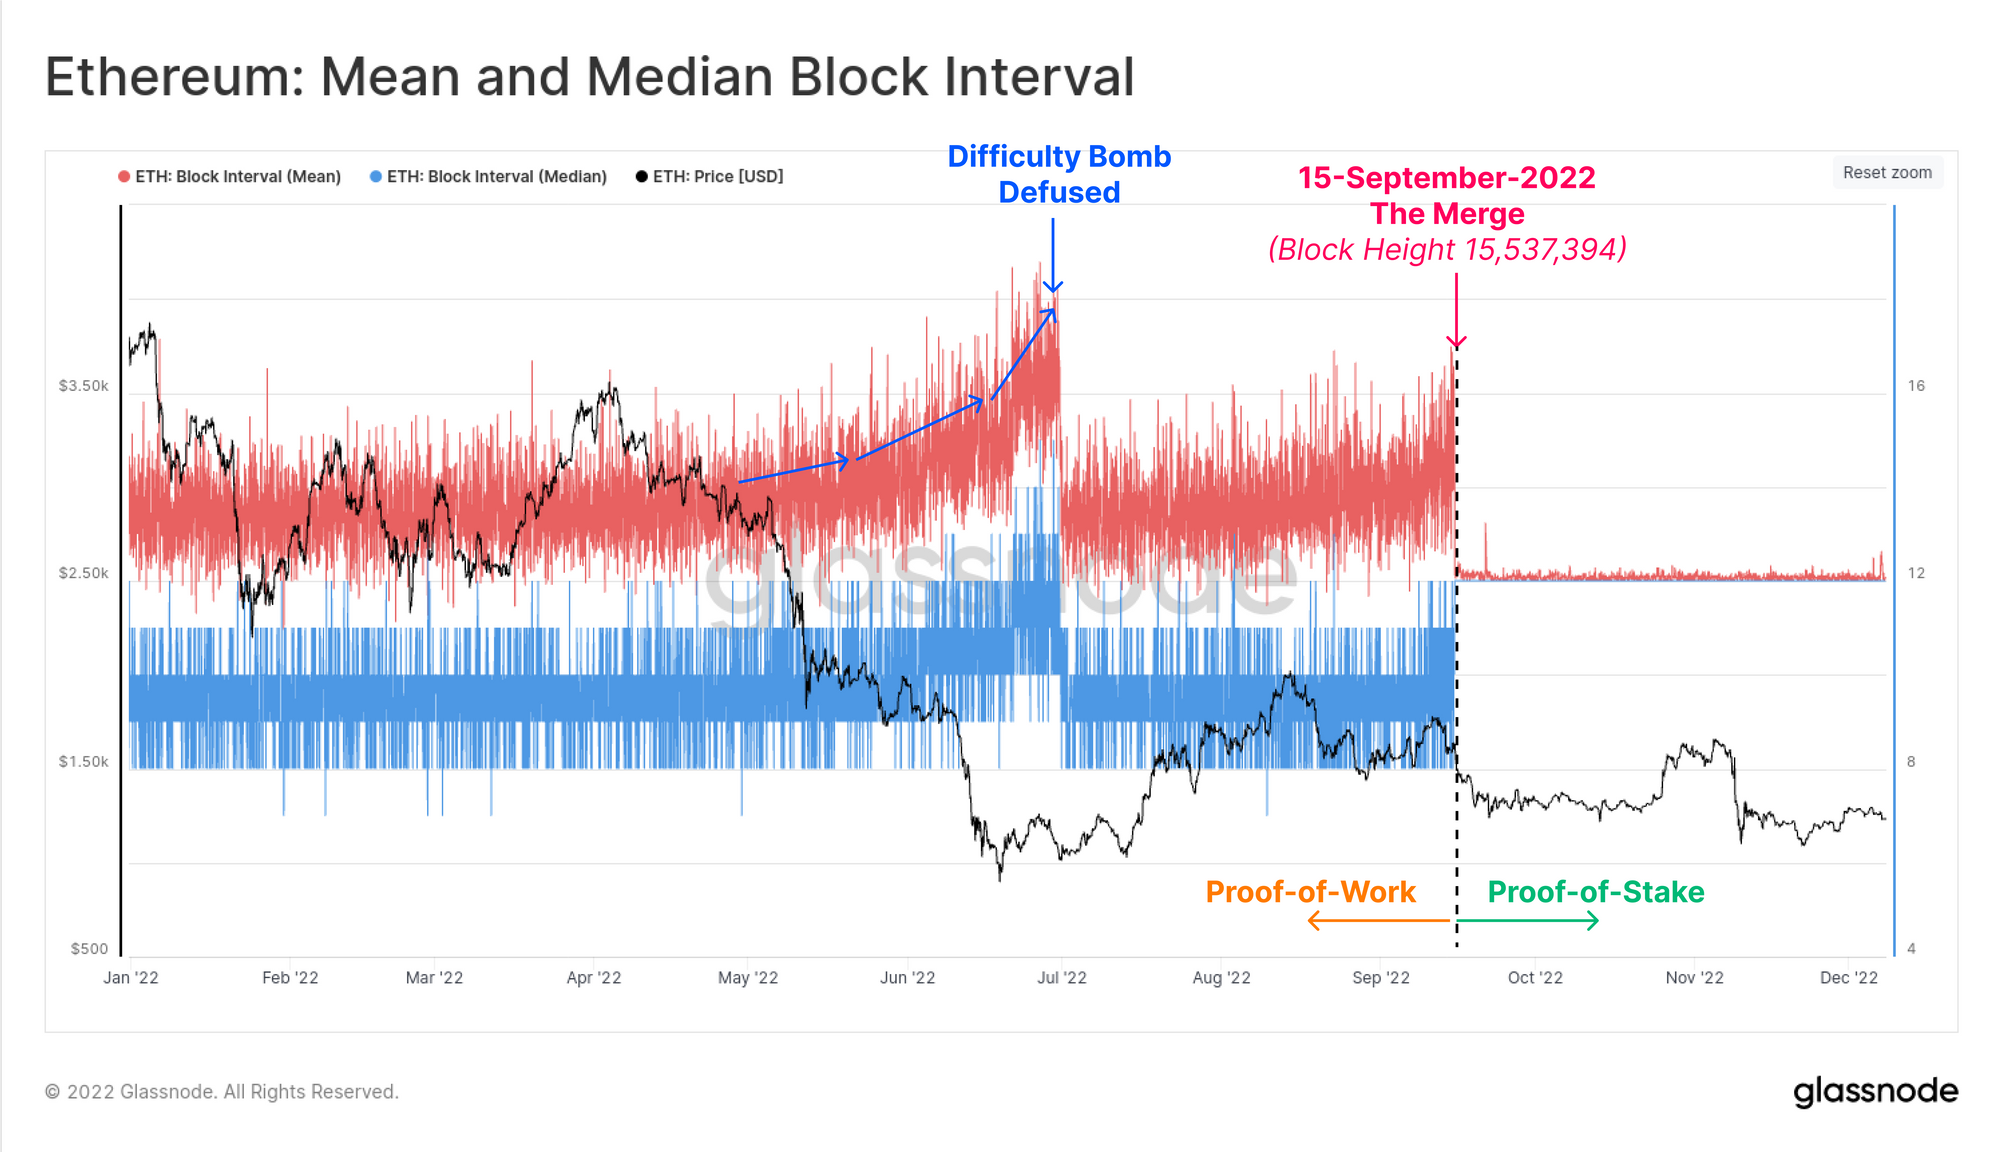
The Ethereum Merge, completed on 15-September, was arguably the most impressive engineering feat of the year. To visualise the immediacy of the event, the chart below shows the mean and median block interval over the course of 2022. It is immediately clear where the natural and probablistic variability of Proof-of-Work came to an end, and the precise, pre-determined 12-second blocktime of Proof-of-Stake came into effect.
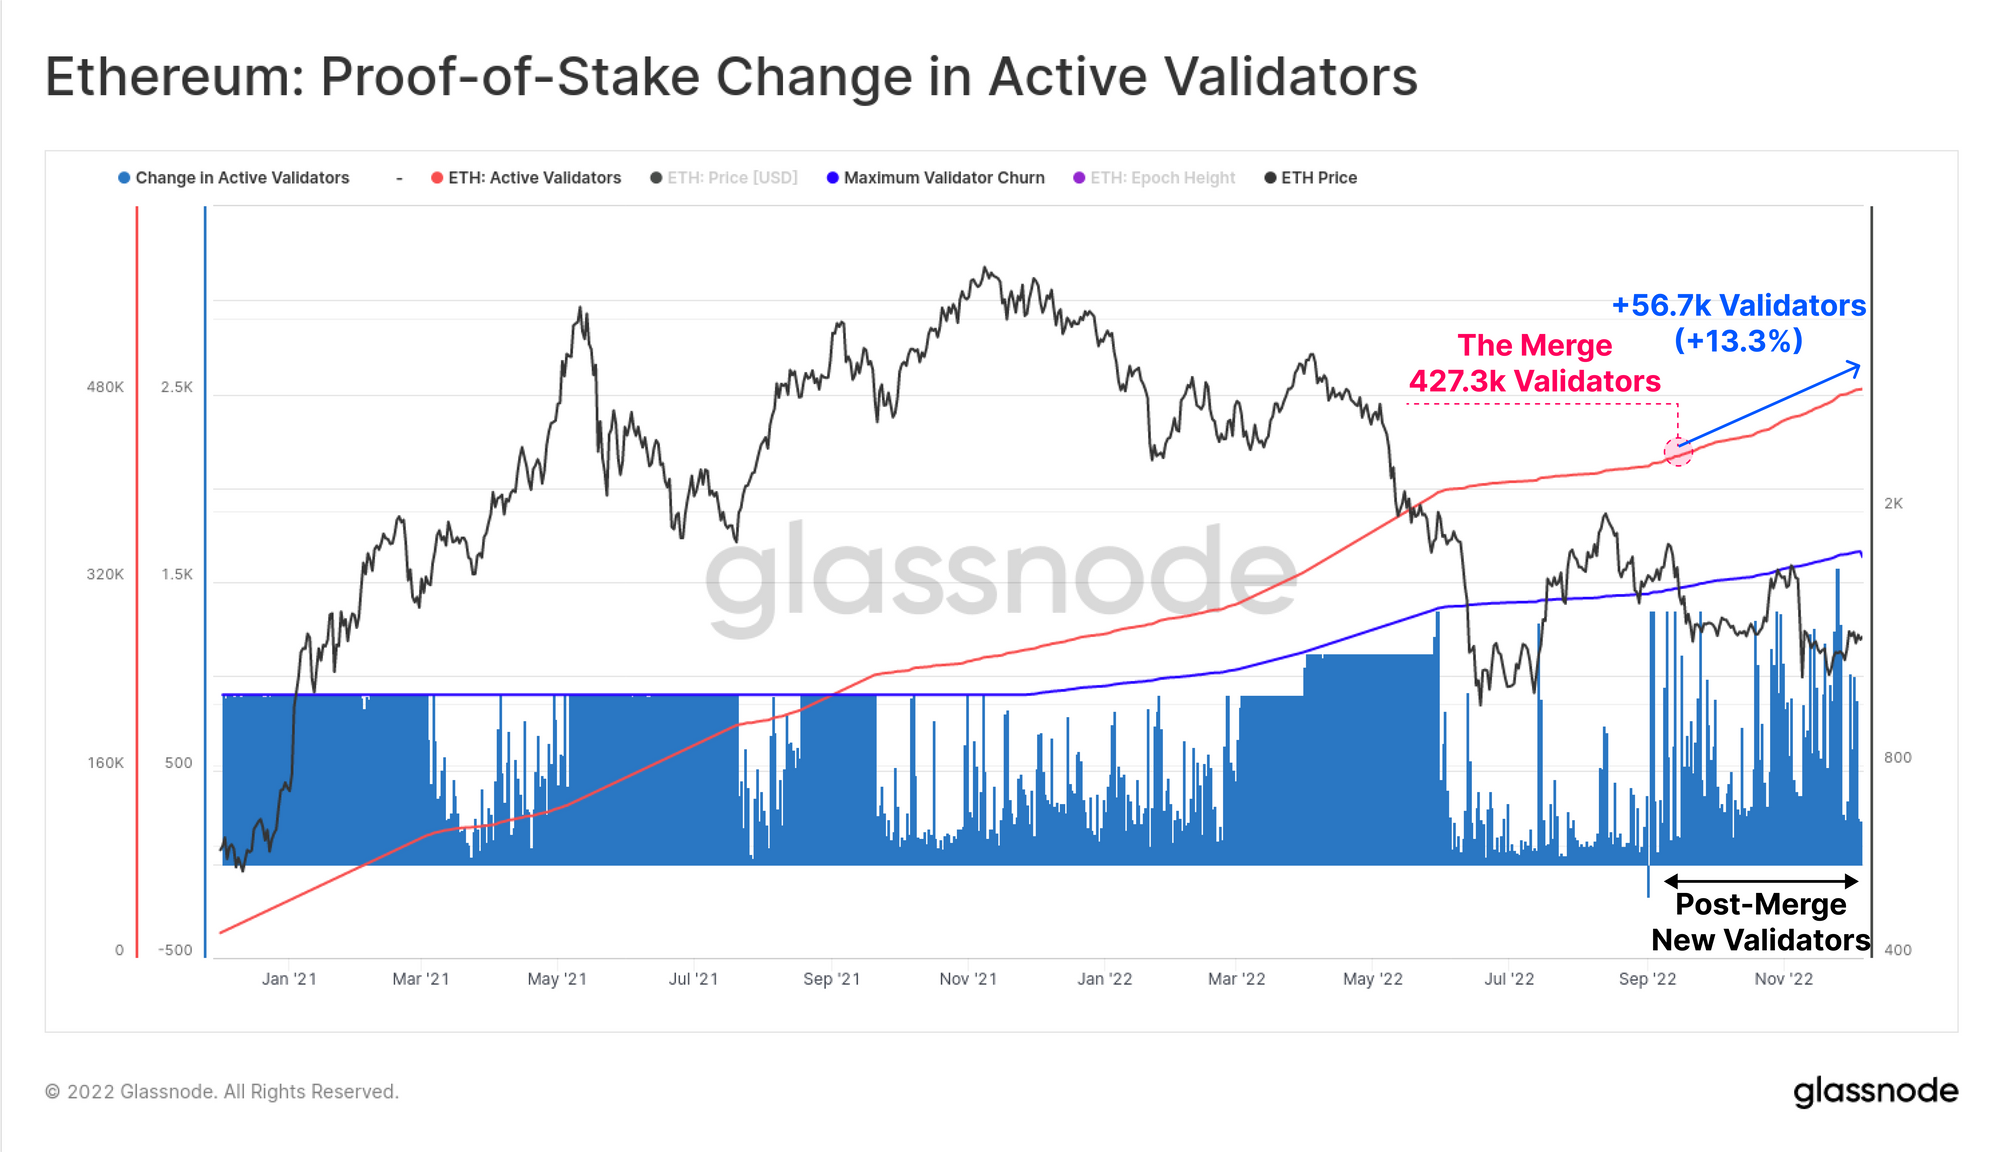
Since the Merge, the number of active validators has increased by 13.3%, with over 484k validators now operational. This brings the total ETH staked to 15.618M ETH, which is equivalent to 12.89% of the circulating supply.
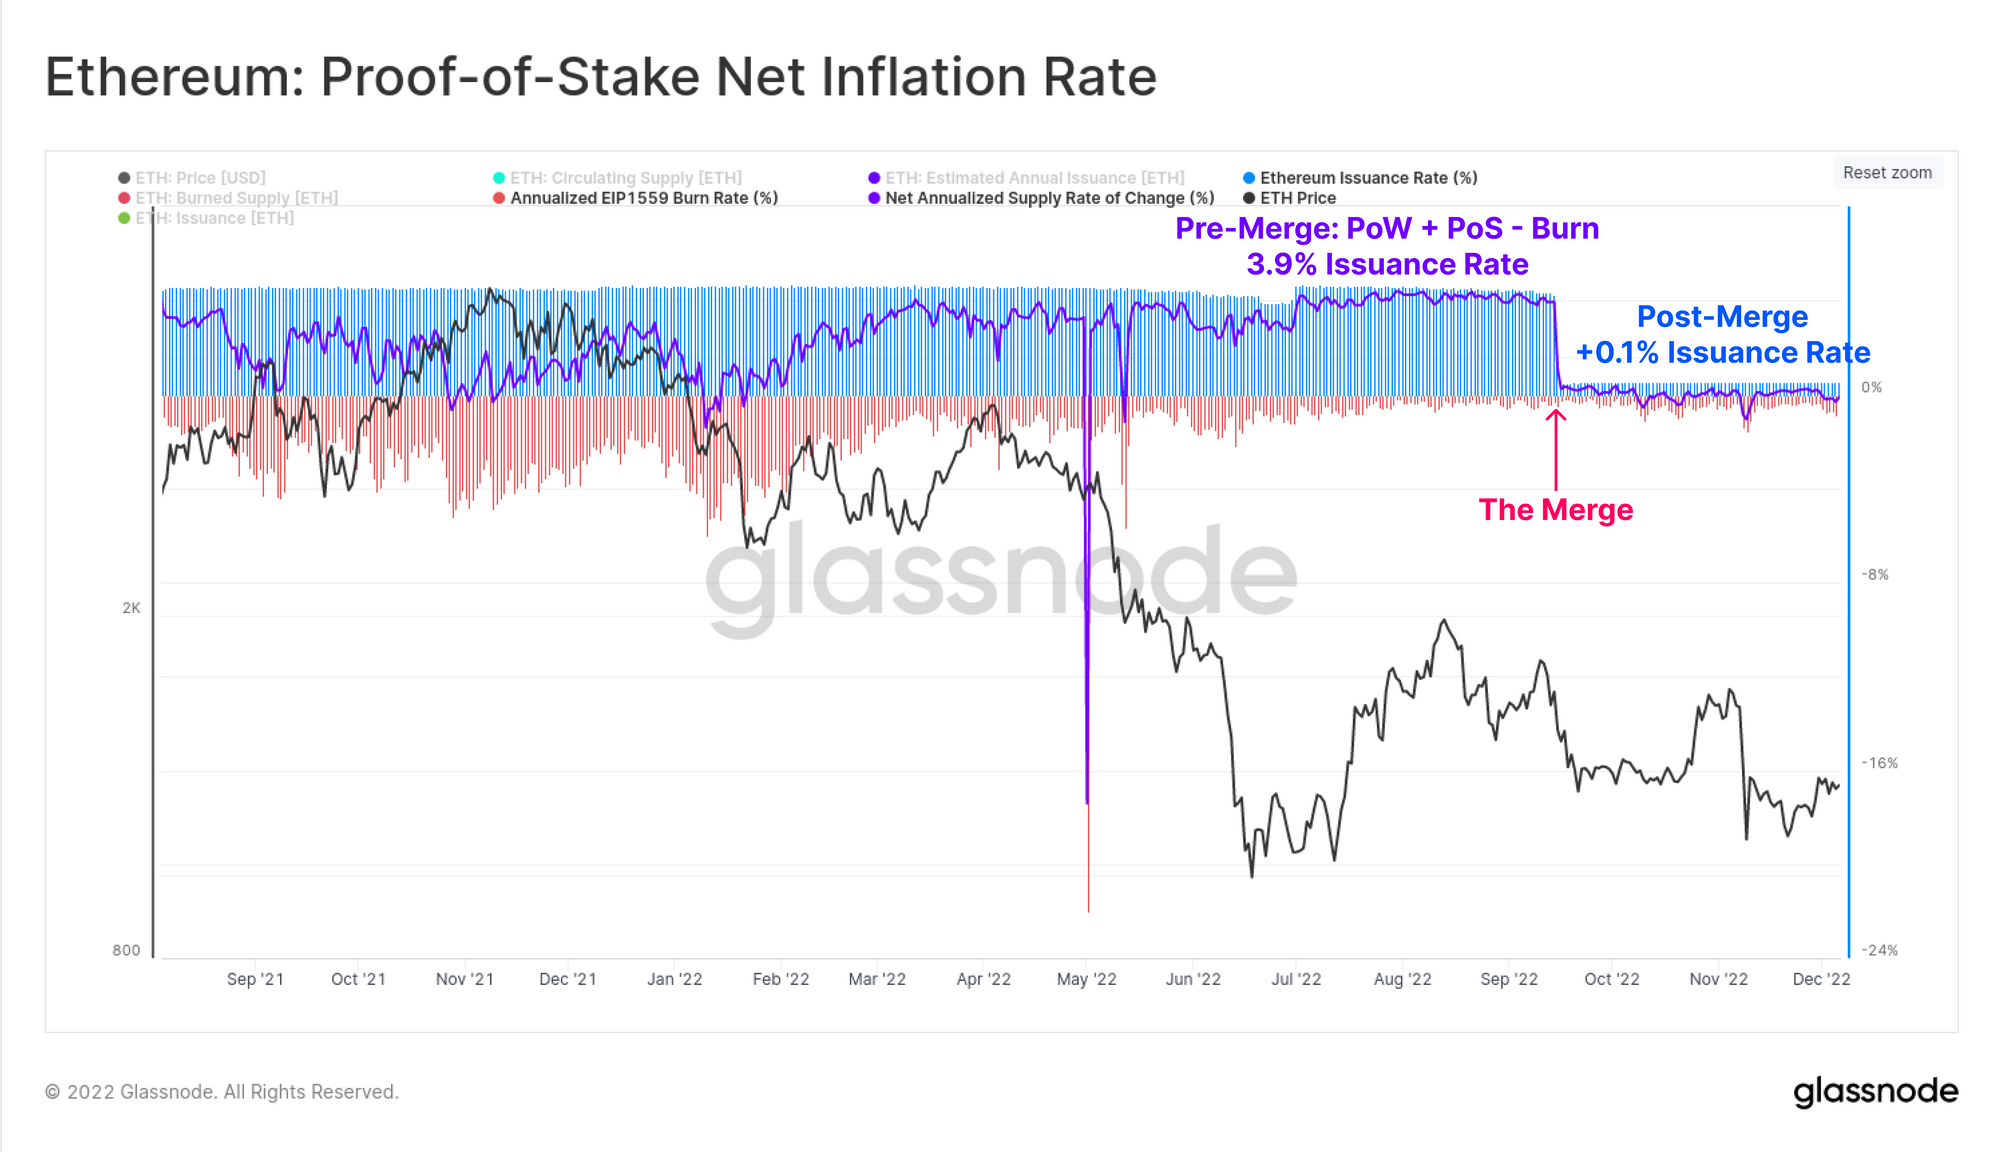
Along with the transition to Proof-of-Stake, the Ethereum monetary policy was adjusted to a significantly lower emission schedule. The nominal rate of issuance (blue) is around +0.5%, however after factoring in the EIP1559 burn mechanism (red), this is almost entirely offset to around +0.1% on a typical day. This compares to a net inflation rate of +3.9% prior to the Merge, showing just how dramatic the change to issuance has been.
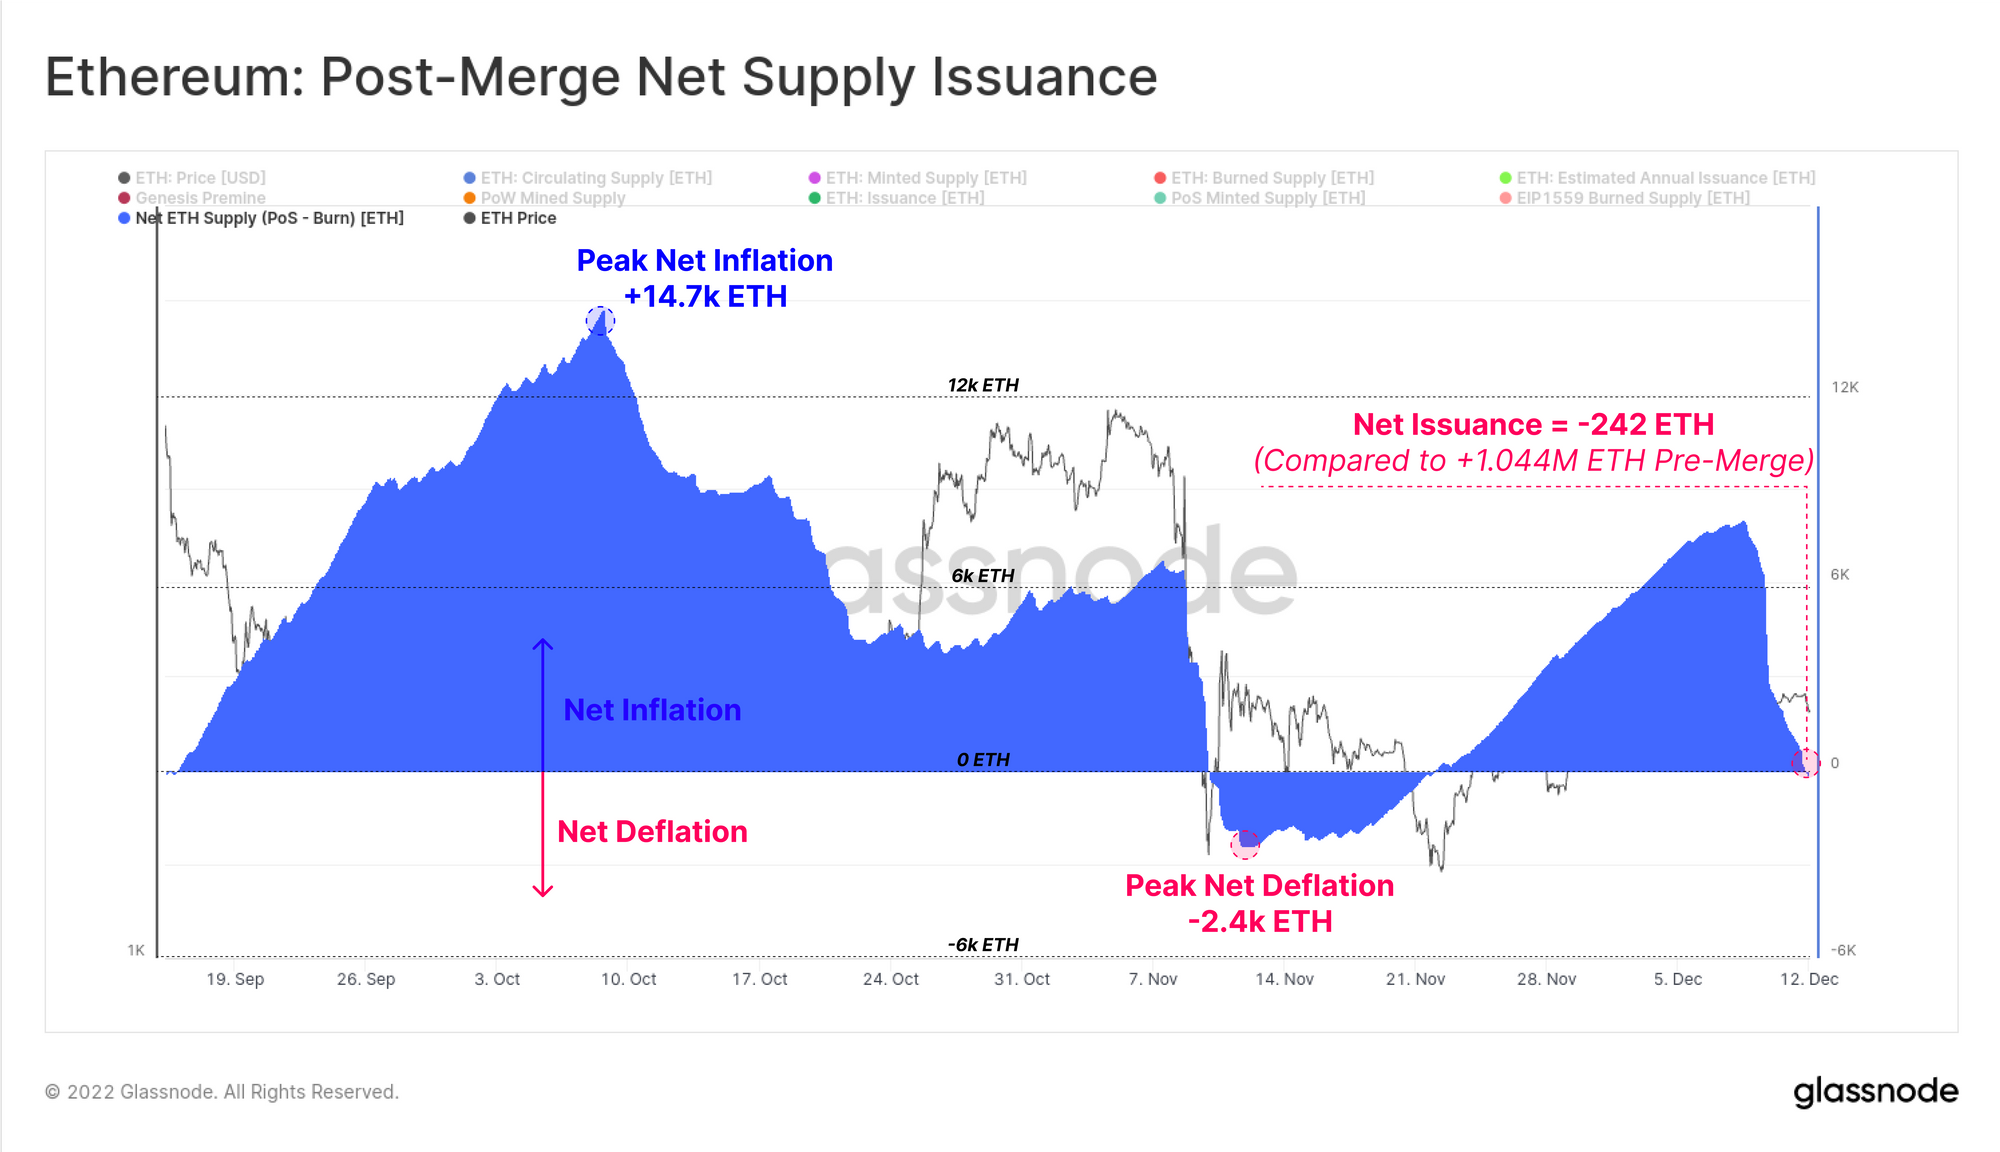
At the time of writing, the ETH supply change since the Merge has just turned net deflationary, with the current coin supply now -242 ETH lower than it was on at the Merge. This compares to an estimated 1.044M ETH that would have otherwise been issued into circulation under the previous issuance schedule.
We are Hiring an Ethereum Analyst.
If you are an analyst who specializes in Ethereum, DeFi, and associated ecosystems (or know someone who is), please get in touch. We are looking for a senior Ethereum analyst to join our team, and pioneer and advance the field of on-chain analytics across this ever evolving ecosystem.
DeFi Deleverages
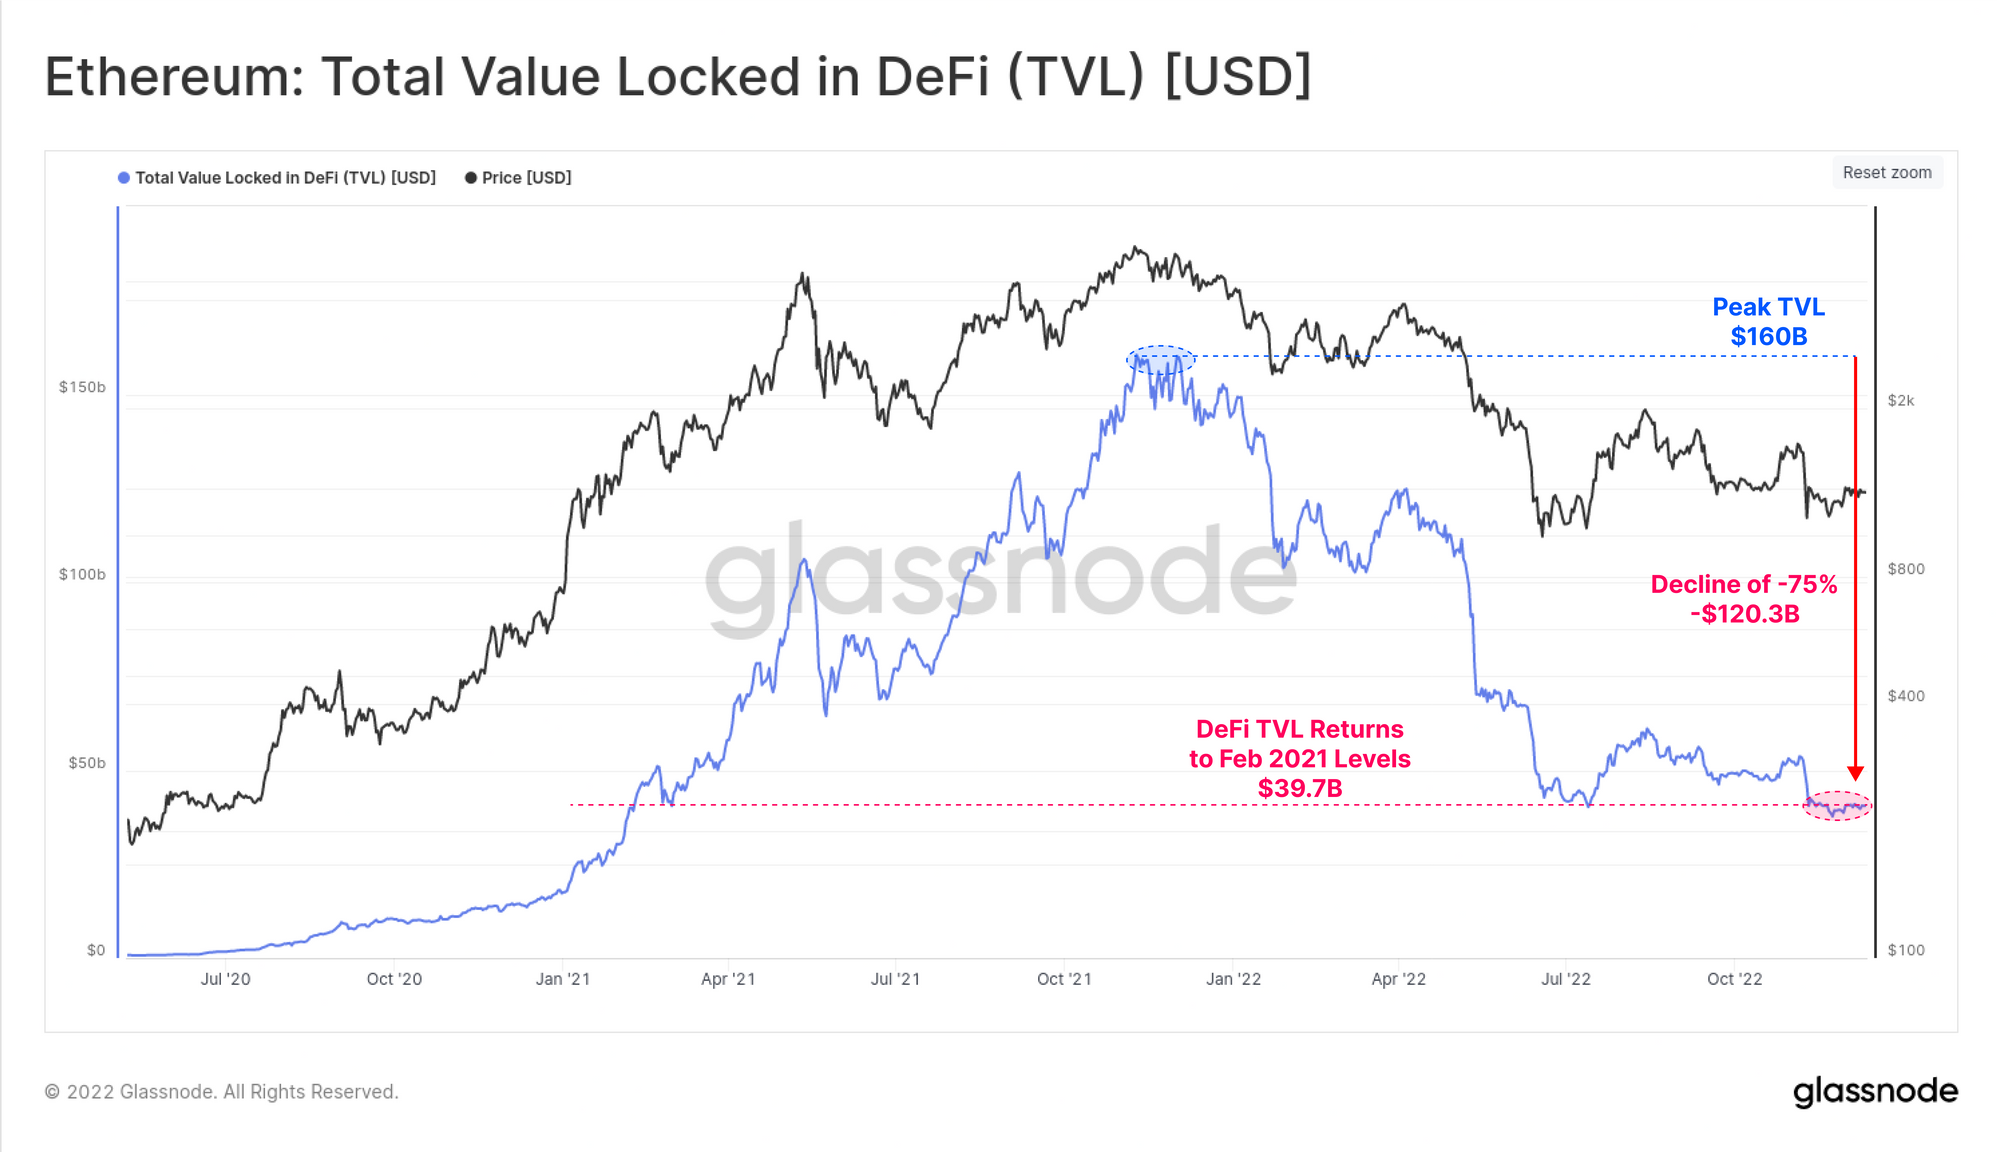
With such an extreme drawdown in token prices, and a severe contraction of liquidity, the total value locked in DeFi has fallen dramatically. After hitting a peak of $160B at the market ATH in Nov 2021, DeFi TVL has dropped by over $120.3B (-75%). This brings DeFi collateral values down to $39.7B, returning to Feb 2021 levels.
The dominance of gas consumption by transaction type has also demonstrated a shifting market preference over the last two years. DeFi protocols commanded between 25% and 30% of all gas consumption from July 2020, until May 2021, but have since fallen to just 14%.
In a similar boom-bust cycle, NFT related transactions accounted for 20% to 38% of gas usage through H1 2022, but have now also fallen to 14% dominance. Stablecoins have held a steady 5% to 6% dominance throughout this year.

Stablecoin Outflows
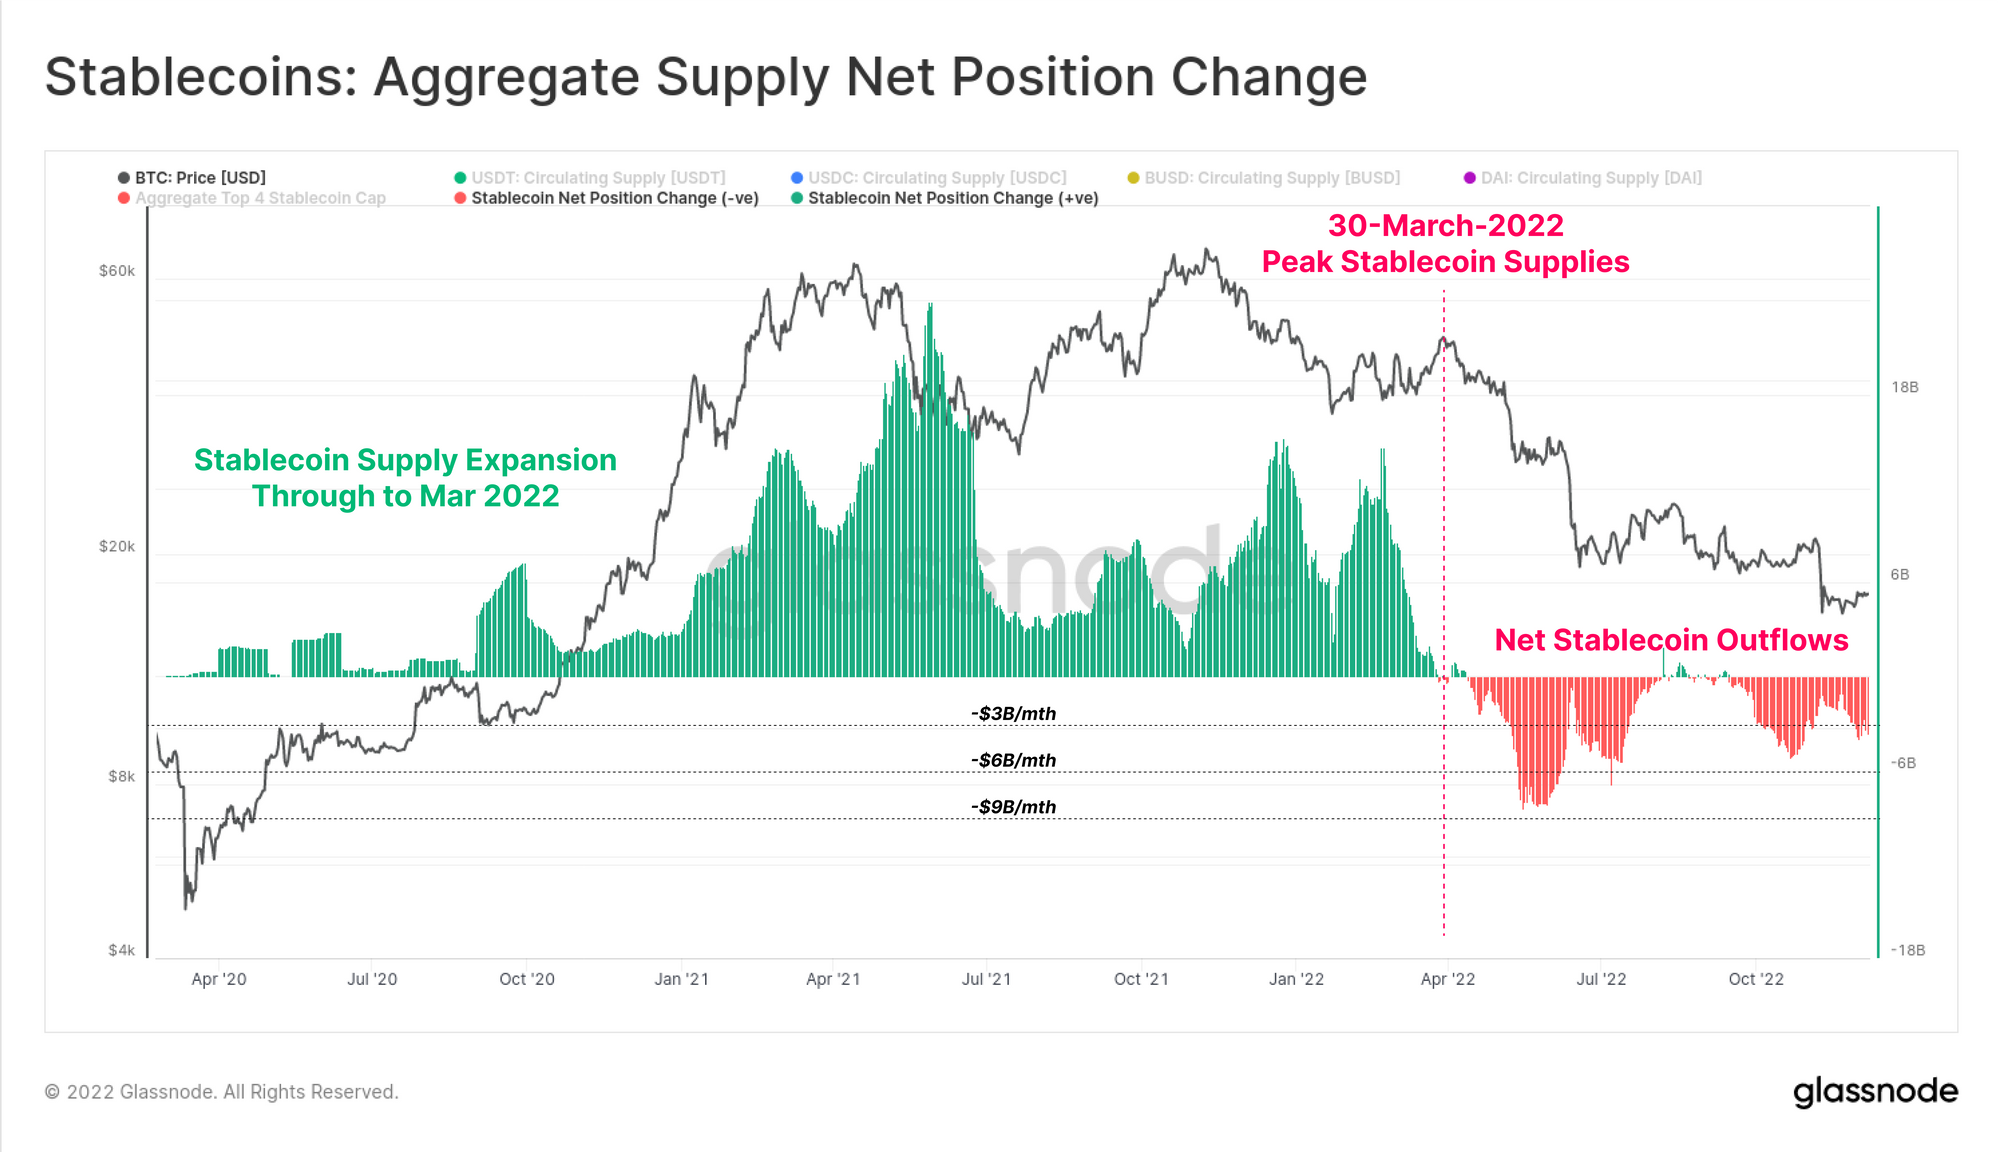
Stablecoins have become a cornerstone asset of the industry since 2020, with 3 of the top 6 assets by market cap now being stablecoins. Total stablecoin supply peaked at $161.5B in March 2022, however has since seen large scale redemptions exceeding $14.3B.
Overall this reflects a net capital outflows from the space of between -$4B and $-8B per month. However, is also notable that this reflects just 8% of the peak stablecoin supply, suggesting a majority of this capital still remains in this new digital dollar format.
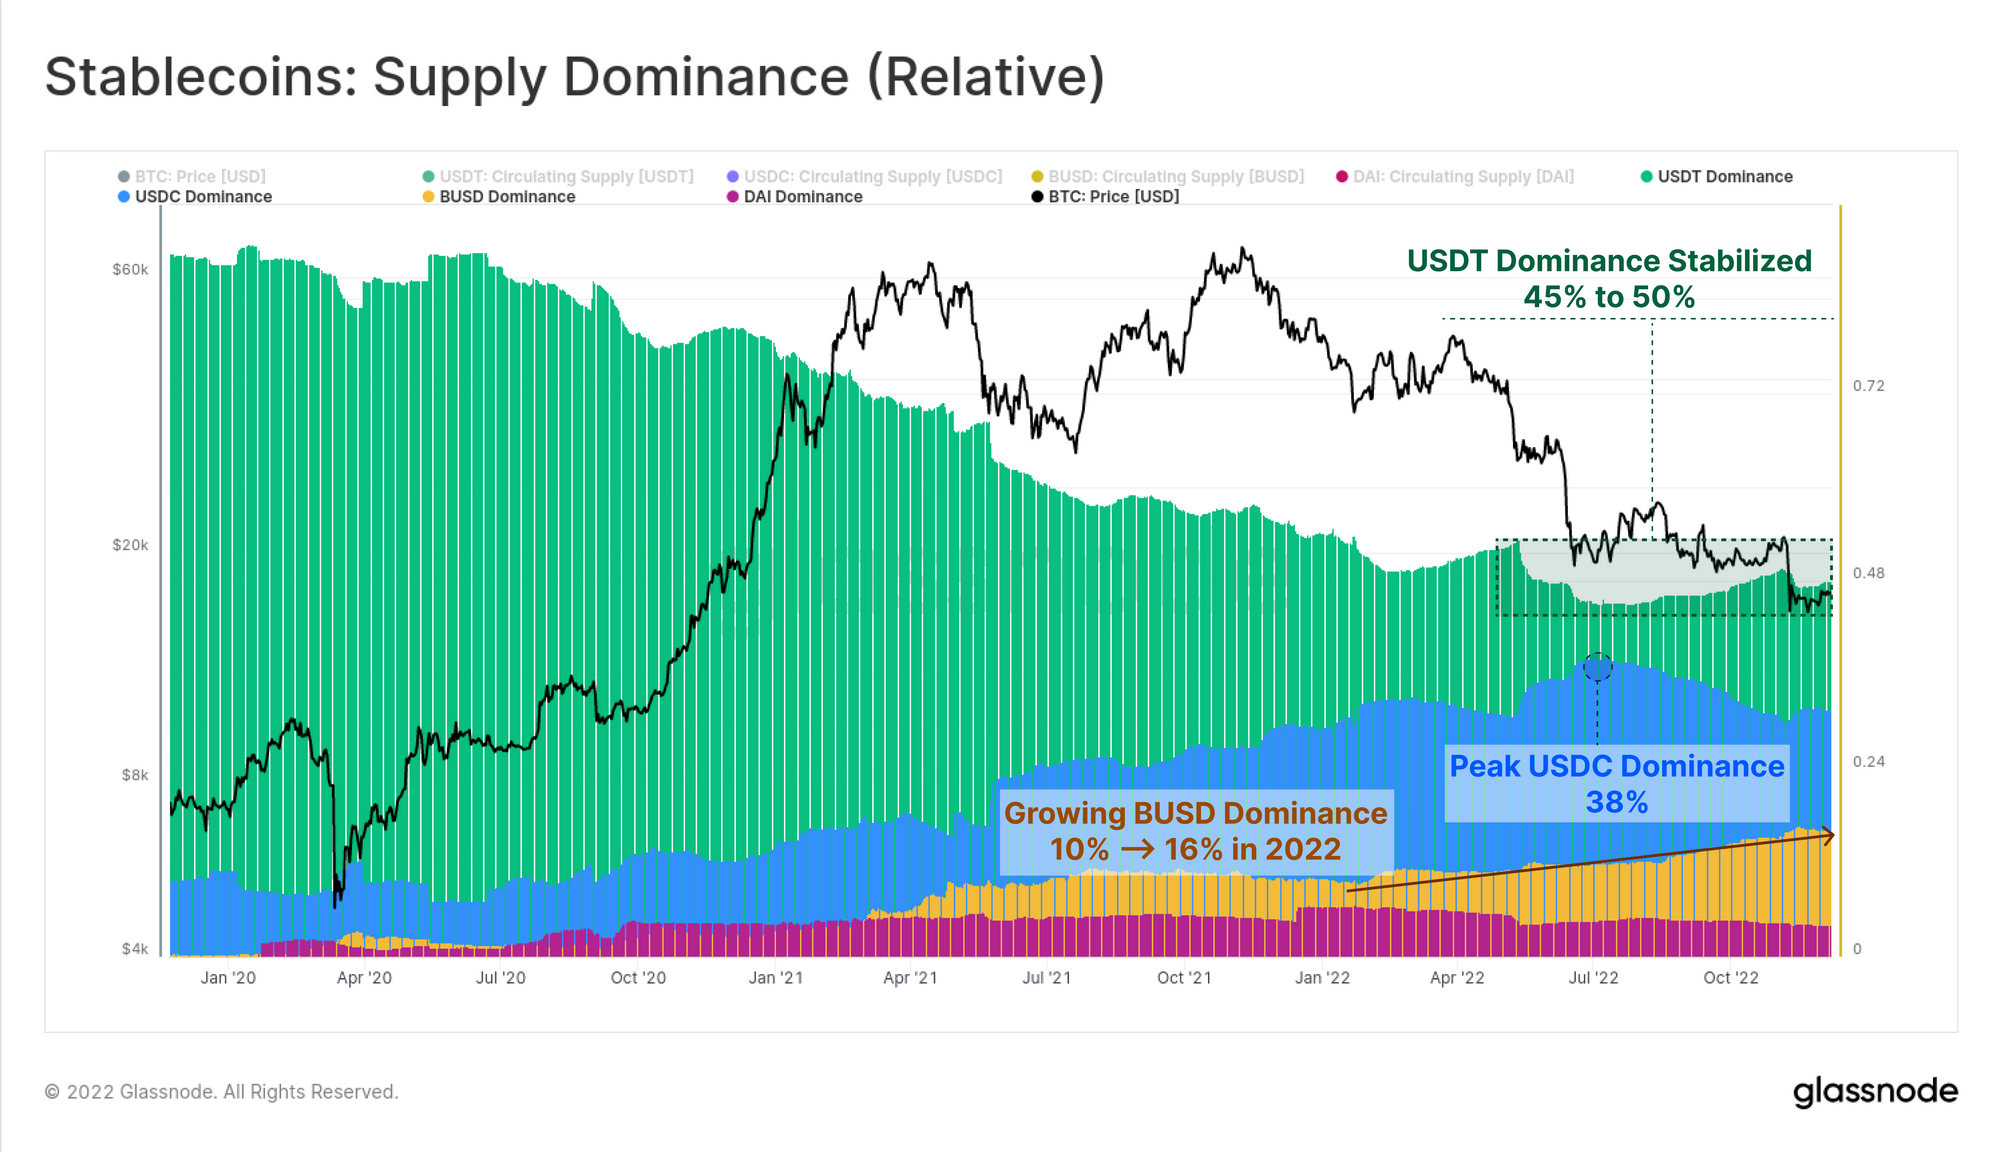
There have also been notable shifts taking place in relative stablecoin supply dominance.
- BUSD stands out, having increased its market share from 10% to 16% in 2022, and now representing $22.0B in total asset value.
- Tether has maintained a relatively consistent 45% to 50% market share, despite a total of $18.42B in USDT redemption since May.
- USDC dominance peaked at 38% in June, but has since fallen to 31.3%, now accounting for $44.75B in value.
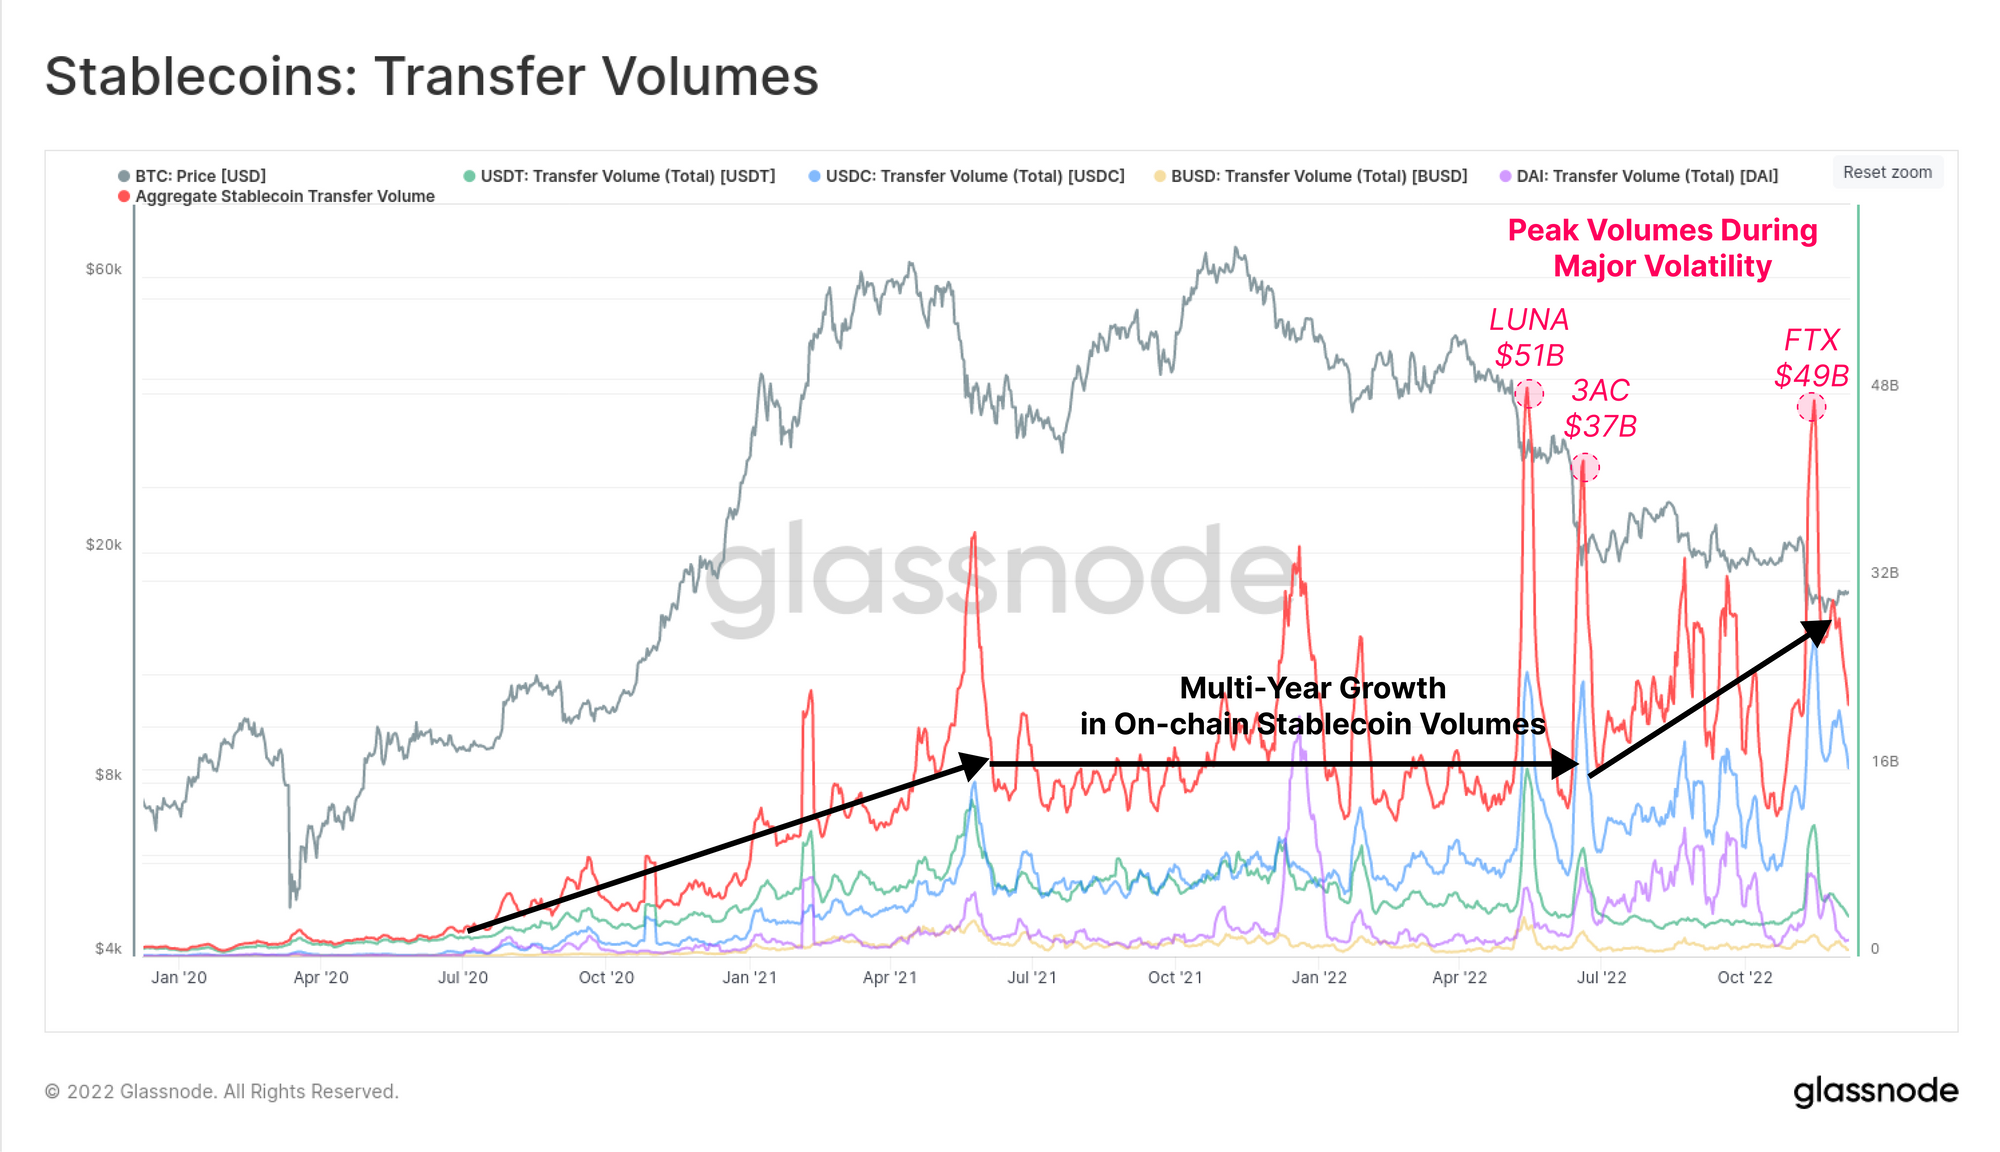
Whilst stablecoins are currently experiencing redemptions, and capital outflows on net, transfer volumes on Ethereum have continued to climb throughout H2 2022. Aggregate transfer volumes for stablecoins were stable at around $16B per day through much of 2021-22, but have continued to climb to between $20B and $30B per day since July.
During the high volatility sell-off events in May, June, and November, total stablecoin transfer volumes peak between $37B and $51B, suggesting an extreme demand for USD liquidity during deleveraging events.
Summary and Conclusions
This year has seen both BTC and ETH reach drawdowns exceed -75% off the all-time-high set in November. Since May, this has been punctuated by a wide-scale, and massive deleveraging event. This resulted in significant credit contraction, numerous bankruptcies, the unfortunate collapse of multi-billion dollar ponzi project (LUNA-UST), and sadly what appears to be fraud in the case of FTX.
2022 was a brutal year, and it has driven volatility and volumes to multi-year lows, as liquidity and speculative dries up. With speculators gone, Bitcoin Long-term Holder supply has pushed to yet another ATH, and investors appear to be stepping in with increasing coin volume on each price leg down. The Ethereum Merge was also executed successfully in September, and stablecoins continue to demonstrate a meaningful product market fit.
The resilience of decentralized systems is built through many years of trials, and battle scars, however these events are ultimately what forges the HODLer cohort, the buyers of last resort. After all the challenegs of 2022, the digital asset industry still stands, lessons are learned, and Bitcoin blocks keep being found.
Irrespective of what comes in 2023, we believe this industry will stand the test of time, and we will keep building the tools and data needed to analyze, study, and understand why.
Tick tock, next block, and we will see you in 2023.