Input Data For GLEAM 3
Herd Parameters
Manure Management Systems
Live Weights
Dry Matter Intake
Emissions
Emissions by species
Emissions Map
Welcome to the GLEAM dashboard
Livestock emission data at a glance
To start, please select one of the pages below.
Animal Population
Data on the population of different livestock species, herd, and production system. Animal population estimates are based on the Gridded Livestock of the World GLW4.
Animal Products
Data for livestock products (meat, milk and eggs) by species, herd, production system and commodity, per unit of protein, and weight.
Emissions
Estimated GHG emissions from the entire livestock supply chain by species, herd, production system, commodity, source, and gas.
Emission Intensities
Estimated GHG emissions per unit of livestock product and stock by species, herd, and production system. Data is downloadable at a chosen geographic level.
Explore with more detail
Compare Regions
A tool to compare animal populations, animal products, emissions and emission intensities between multiple regions.
Input Data
Selected input data for the model, by species, herd and production systems. Data is downloadable at a chosen geographic level.
Regions
Regions for which the GLEAM data can be aggregated, based on geographic, economic or administrative criteria.
Supplementary information
About GLEAM
Background information about GLEAM, the underlying data, methods and parameters, and the differences in methodology between versions of the model.
Change Log
Reference list describing all recent changes made to the dashboard.
Pathways Report

Pathways Towards Lower Emissions - A global assessment of the greenhouse gas emissions and mitigation options from livestock agrifood systems.
Compare regions against each other
Select regions
Select species, herd type and production system
Results
Animal Population
Animal Population Map
Emission Intensities
Emissions intensities of animal products
Emission Intensity Map
Animal Products
Production of animal products
Animal Products Map
The GLEAM dashboard creates downloadable reports with figures, tables, and analysis of key data sets that where produced by GLEAM or that serverd as input to the model. The country report report summarizes input data, as well as key figures and tables from the dashboard in one document. Reports are created on-the-fly, depending on the selected country or region , this can take a minute or two.
About GLEAM
What is GLEAM?
The Global Livestock Environmental Assessment Model (GLEAM) is a geospatial framework that simulates the bio-physical processes and activities within livestock systems, using a Life Cycle Assessment (LCA) approach. The aim of GLEAM is to quantify production and use of natural resources in livestock systems and to identify their environmental impacts. Estimating these impacts is essential to establish robust baselines, and to estimate the expected impacts of different livestock sector trends and actions to mitigate environmental impacts. GLEAM provides a systematic, global coverage of six livestock species and their edible products: meat and milk from cattle, buffalo, sheep and goats; meat from pigs; and meat and eggs from chickens. Further information on the methodology and the input data can be found on our website.
GLEAM 3 Data
While GLEAM uses a spatially explicit model at 5 arc minutes pixel resolution, the results shown in this dashbaoard represent regional a aggregates that mask considerable varations that exists across individual countries and even within countries. There is also a large range in data availability and data quality for different regions that results in very different regional uncertainties associated with the results. This limitation should be taken into account when interpreting data, in particular emissions and emission intensities. For example, using the regional emission intensities presented here to calculate life cycle emissions for a certain animal product in a given country might lead to a very misleading result that should not be used to draw conclusions on the emissions footprint of a certain product or to compare those footprints between countries. Similarly, these emission intensities may not appropriately represent the impacts associated with single companies or farms, as the input data used by the model may not be representative of their specific livestock breeding practices. Please contact us for more information.
Why GLEAM 3 GHG emission estimates (released 2022) must not be compared with earlier versions
The estimates of GHG emissions from GLEAM 3 are different both in absolute emissions and in terms of relative share of total anthropogenic emissions when compared to numbers reported in previous publications, such as “Livestock’s long shadow” (Steinfeld et al., 2006) and “Tackling Climate Change through Livestock” (Gerber et al., 2013). While all these estimates were simulated with FAO’s Global Livestock Environmental Assessment Model (GLEAM) and for different reference years (2005, 2010, and 2015 for GLEAM 1, 2, and 3), the methods and underlying data sets are different, and the different figures should not be interpreted as time series. It is, therefore, impossible to draw conclusions like “emissions went up” or “livestock emissions are becoming less important compared to total anthropogenic emissions” from those data sets. Key differences among the three versions are summarised below.
Global Warming Potential (GWP) values
The choice of GWP values for methane (CH4) and Nitrous Oxide (N2O) has an impact on the conversion of estimated emissions to CO2-equivalents, therefore influencing absolute values for both livestock and total anthropogenic emissions and the share of livestock emissions. The conversion factors were taken from the respective IPCC assessment reports for the 100-year period, as summarised in Table 1.Table 1. Greenhouse gas conversion factors.
Source: IPCC 1995 - Table 2.9; IPCC 2007 - Table 2.14; IPCC 2013 - Table 8.7, with carbon feedback; IPCC 2021 - Table 7.15.
For illustration of the impact of different GWP values, the emission estimates on the dashboard can be summarised for different GWP100 sets.
Different data and methods
The different model versions of GLEAM rely on very different data sets for input data such as: animal numbers and distribution, production and availability of feed crops and pastures, livestock production systems, parameters of herd performances and productivity, manure management systems, fertilizer and pesticides applications, and many others. For many of those data, the underlying methods and definitions, in turn, vary for different years as well and require changes in the model workflow and differences in some of the modelling approaches within GLEAM from one version to another. In addition, there are methodological changes that reflect updated guidelines or advances in the scientific literature. Some examples are:- The inclusion and refinement of feedlots models,
- Use of bilateral trade data to adjust emissions, inputs and parameters for internationally traded feed items,
- Differences in nitrogen modelling along the livestock supply chain based on mass balance principles (European Environmental Agency 2016; Uwizeye et al. 2020), or
- Methodological updates from the 2006 IPCC Guidelines for National Greenhouse Gas Inventories (IPCC, 2006) to the latest 2019 Refinement to the 2006 IPCC Guidelines for National Greenhouse Gas Inventories (IPCC, 2019).
Livestock units
Livestock units (LSU) are a reference unit that is used to make different species comparable and to calculate stocking densities different species in one single value.In GLEAM, the reference unit that is used to calculate LSU is based on the weight of a North American dairy cow (1.0 LSU) and takes into account the variations in weights for different cohorts (based on the calculated herd structure).
LSU for different species and regions are provided in Tables 2, 3 and 4 below.
Table 2. Livestock units by FAO region.
Table 3. Livestock units by SDG region.
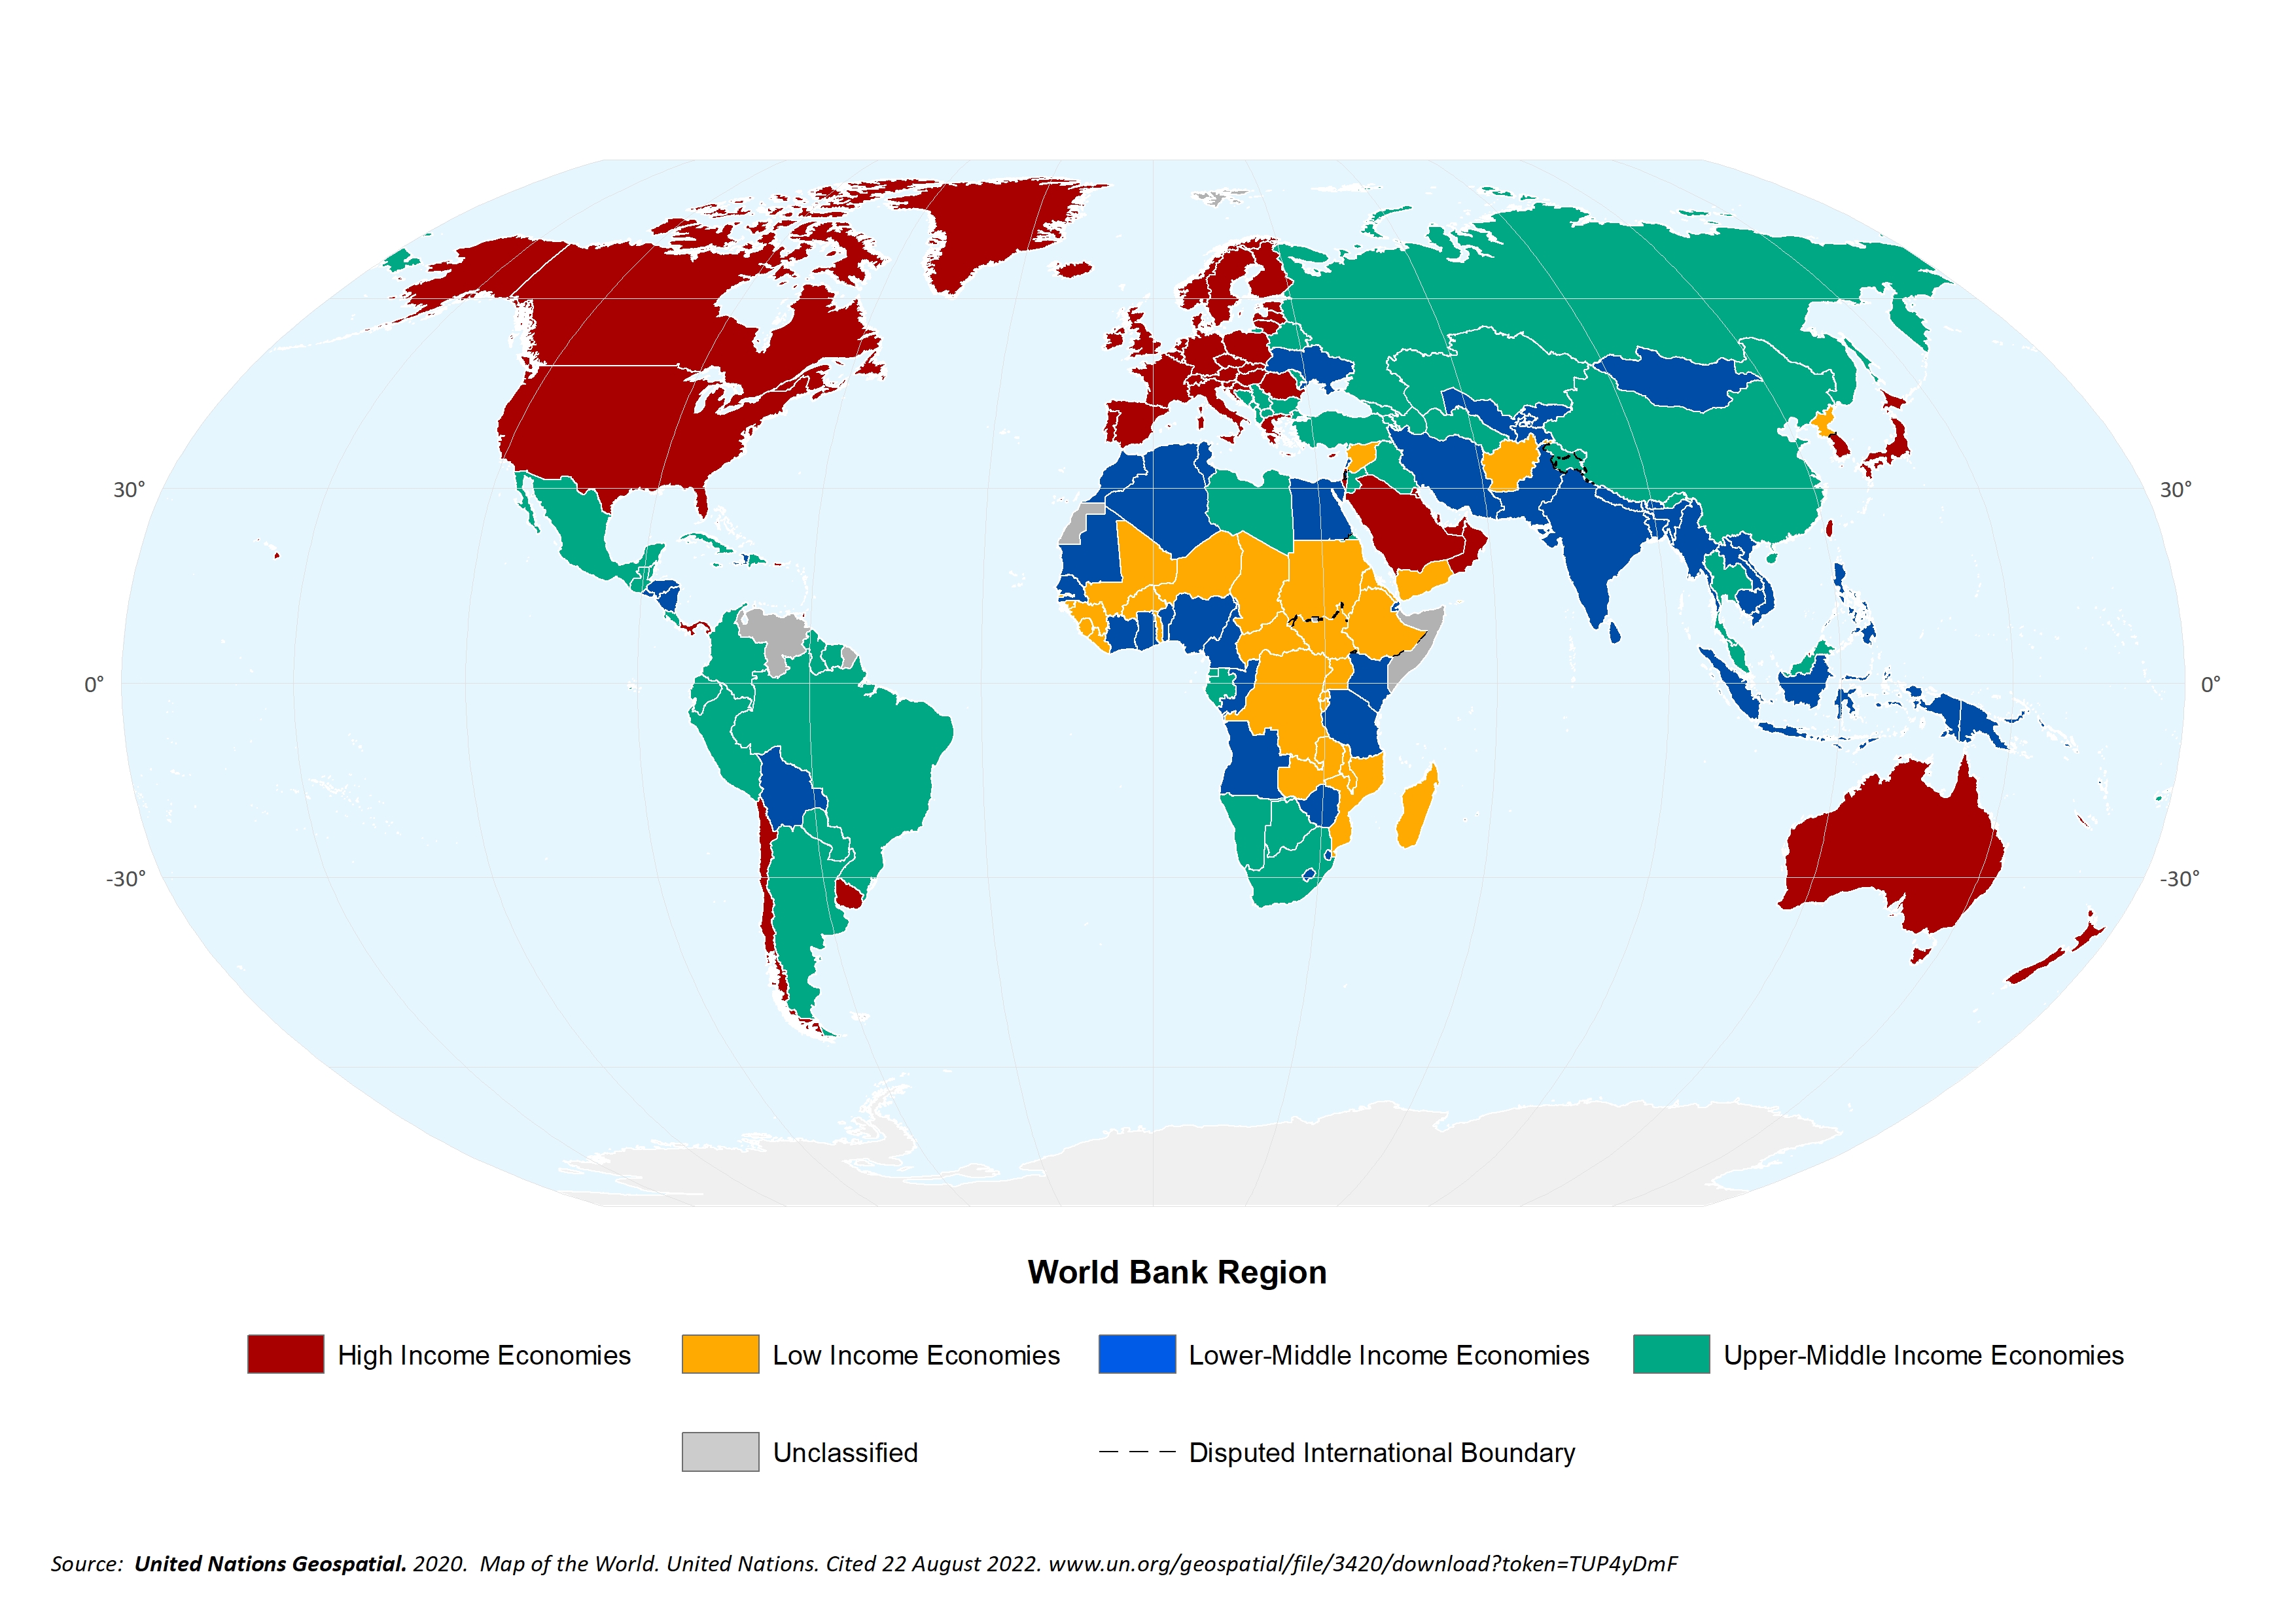
Table 4. Livestock units by World Bank region.
Reference List
- European Environmental Agency. 2016. EMEP/EEA air pollutant emission inventory guidebook 2016. Technical guidance to prepare national emission inventories. EEA Report No 21/2016, 24 pp. doi:10.2800/247535
- FAO. 2022. GLEAM v3 Model description. https://www.fao.org/gleam/resources/en/
- Gerber, P.J., Steinfeld, H., Henderson, B., Mottet, A., Opio, C., Dijkman, J., Falcucci, A. & Tempio, G. 2013. Tackling climate change through livestock – A global assessment of emissions and mitigation opportunities. Rome. FAO. https://www.fao.org/3/i3437e/i3437e00.htm
- IPCC. 1995. Climate Change 1995: The Science of Climate Change. Contribution of Working Groups I to the Second Assessment Report of the Intergovernmental Panel on Climate Change. Houghton, J.T., Meira Filho, L.G., Callander, B.A., Harris, N., Kattenberg, A. & Maskell, K. (eds). Cambridge University Press, Cambridge, United Kingdom and New York, NY, USA.
- IPCC. 2006. 2006 IPCC Guidelines for National Greenhouse Gas Inventories. Eggelston, S., Bendia, L., Miwa, K., Ngara, T. & Tanabe, K. (eds). Published: IPCC, Switzerland.
- IPCC, 2007. Climate Change 2007: The Physical Science Basis. Contribution of Working Group I to the Fourth Assessment Report of the Intergovernmental Panel on Climate Change [Solomon, S., D. Qin, M. Manning, Z. Chen, M. Marquis, K.B. Averyt, M. Tignor & H.L. Miller (eds.)]. Cambridge University Press, Cambridge, United Kingdom and New York, NY, USA, 996 pp.
- IPCC. 2013. Climate Change 2013: The Physical Science Basis. Working Groups I Contribution to the Fifth Assessment Report of the Intergovernmental Panel on Climate Change. Stocker, T.F., Dahe, Q., Plattner, G., Tignor, M.M.B., Allen, S.K., Boschung, J., Nauels, A., Xia, Y., Bex, V. & Midgley, P.M. (eds). Cambridge University Press, Cambridge, United Kingdom and New York, NY, USA,
- IPCC. 2019. Refinement to the 2006 IPCC Guidelines for National Greenhouse Gas Inventories. Calvo Buendia, E., Tanabe, K., Kranjc, A., Baasansuren, J., Fukuda, M., Ngarize S., Osako, A., Pyrozhenko, Y., Shermanau, P. & Federici, S. (eds). Published: IPCC, Switzerland.
- IPCC. 2021. Climate Change 2021: The Physical Science Basis. Contribution of Working Group I to the Sixth Assessment Report of the Intergovernmental Panel on Climate Change. [Masson-Delmotte, V., P. Zhai, A. Pirani, S.L. Connors, C. Péan, S. Berger, N. Caud, Y. Chen, L. Goldfarb, M.I. Gomis, M. Huang, K. Leitzell, E. Lonnoy, J.B.R. Matthews, T.K. Maycock, T. Waterfield, O. Yelekcéi, R. Yu, & B. Zhou (eds.)]. Cambridge University Press, Cambridge, United Kingdom and New York, NY, USA, 2391 pp. doi:10.1017/9781009157896.
- Steinfeld, H., Gerber, P., Wassenaar, T., Castel, V., Rosales, M. & de Haan, C. 2006. Livestock's Long Shadow. The Livestock, Environment and Development Initiative (LEAD). Rome. FAO. http://www.fao.org/docrep/010/a0701e/a0701e00.htm
- Uwizeye, A., de Boer, I.J.M., Opio, C.I., Shulte, R.P.O., Falcucci, A., Tempio, G., Teillard, F., Casu, F., Rulli, M., Galloway, J.N., Leip, A., Erisman,W.J., Robinson,T.P., Steinfeld, H. & Gerber, P.J. 2020. Nitrogen emissions along global livestock supply chains. Nat Food 1, 437–446. doi.org/10.1038/s43016-020-0113-y
Required Citation
When referencing the data, please use the following citation: FAO. 2022. GLEAM 3 Dashboard. In: Shiny Apps. Cited [date accessed]. https://foodandagricultureorganization.shinyapps.io/GLEAMV3_Public/
Change log
2023-01-26
The mask for aggregating country values was adjusted. This change will mostly affect countries and regions with a long coast line compared to the land area, and regions with many small islands and generally leads to slightly smaller values for some variables. A small glitch that affected the allocation of emissions related to pasture expansion was also fixed.2023-03-21
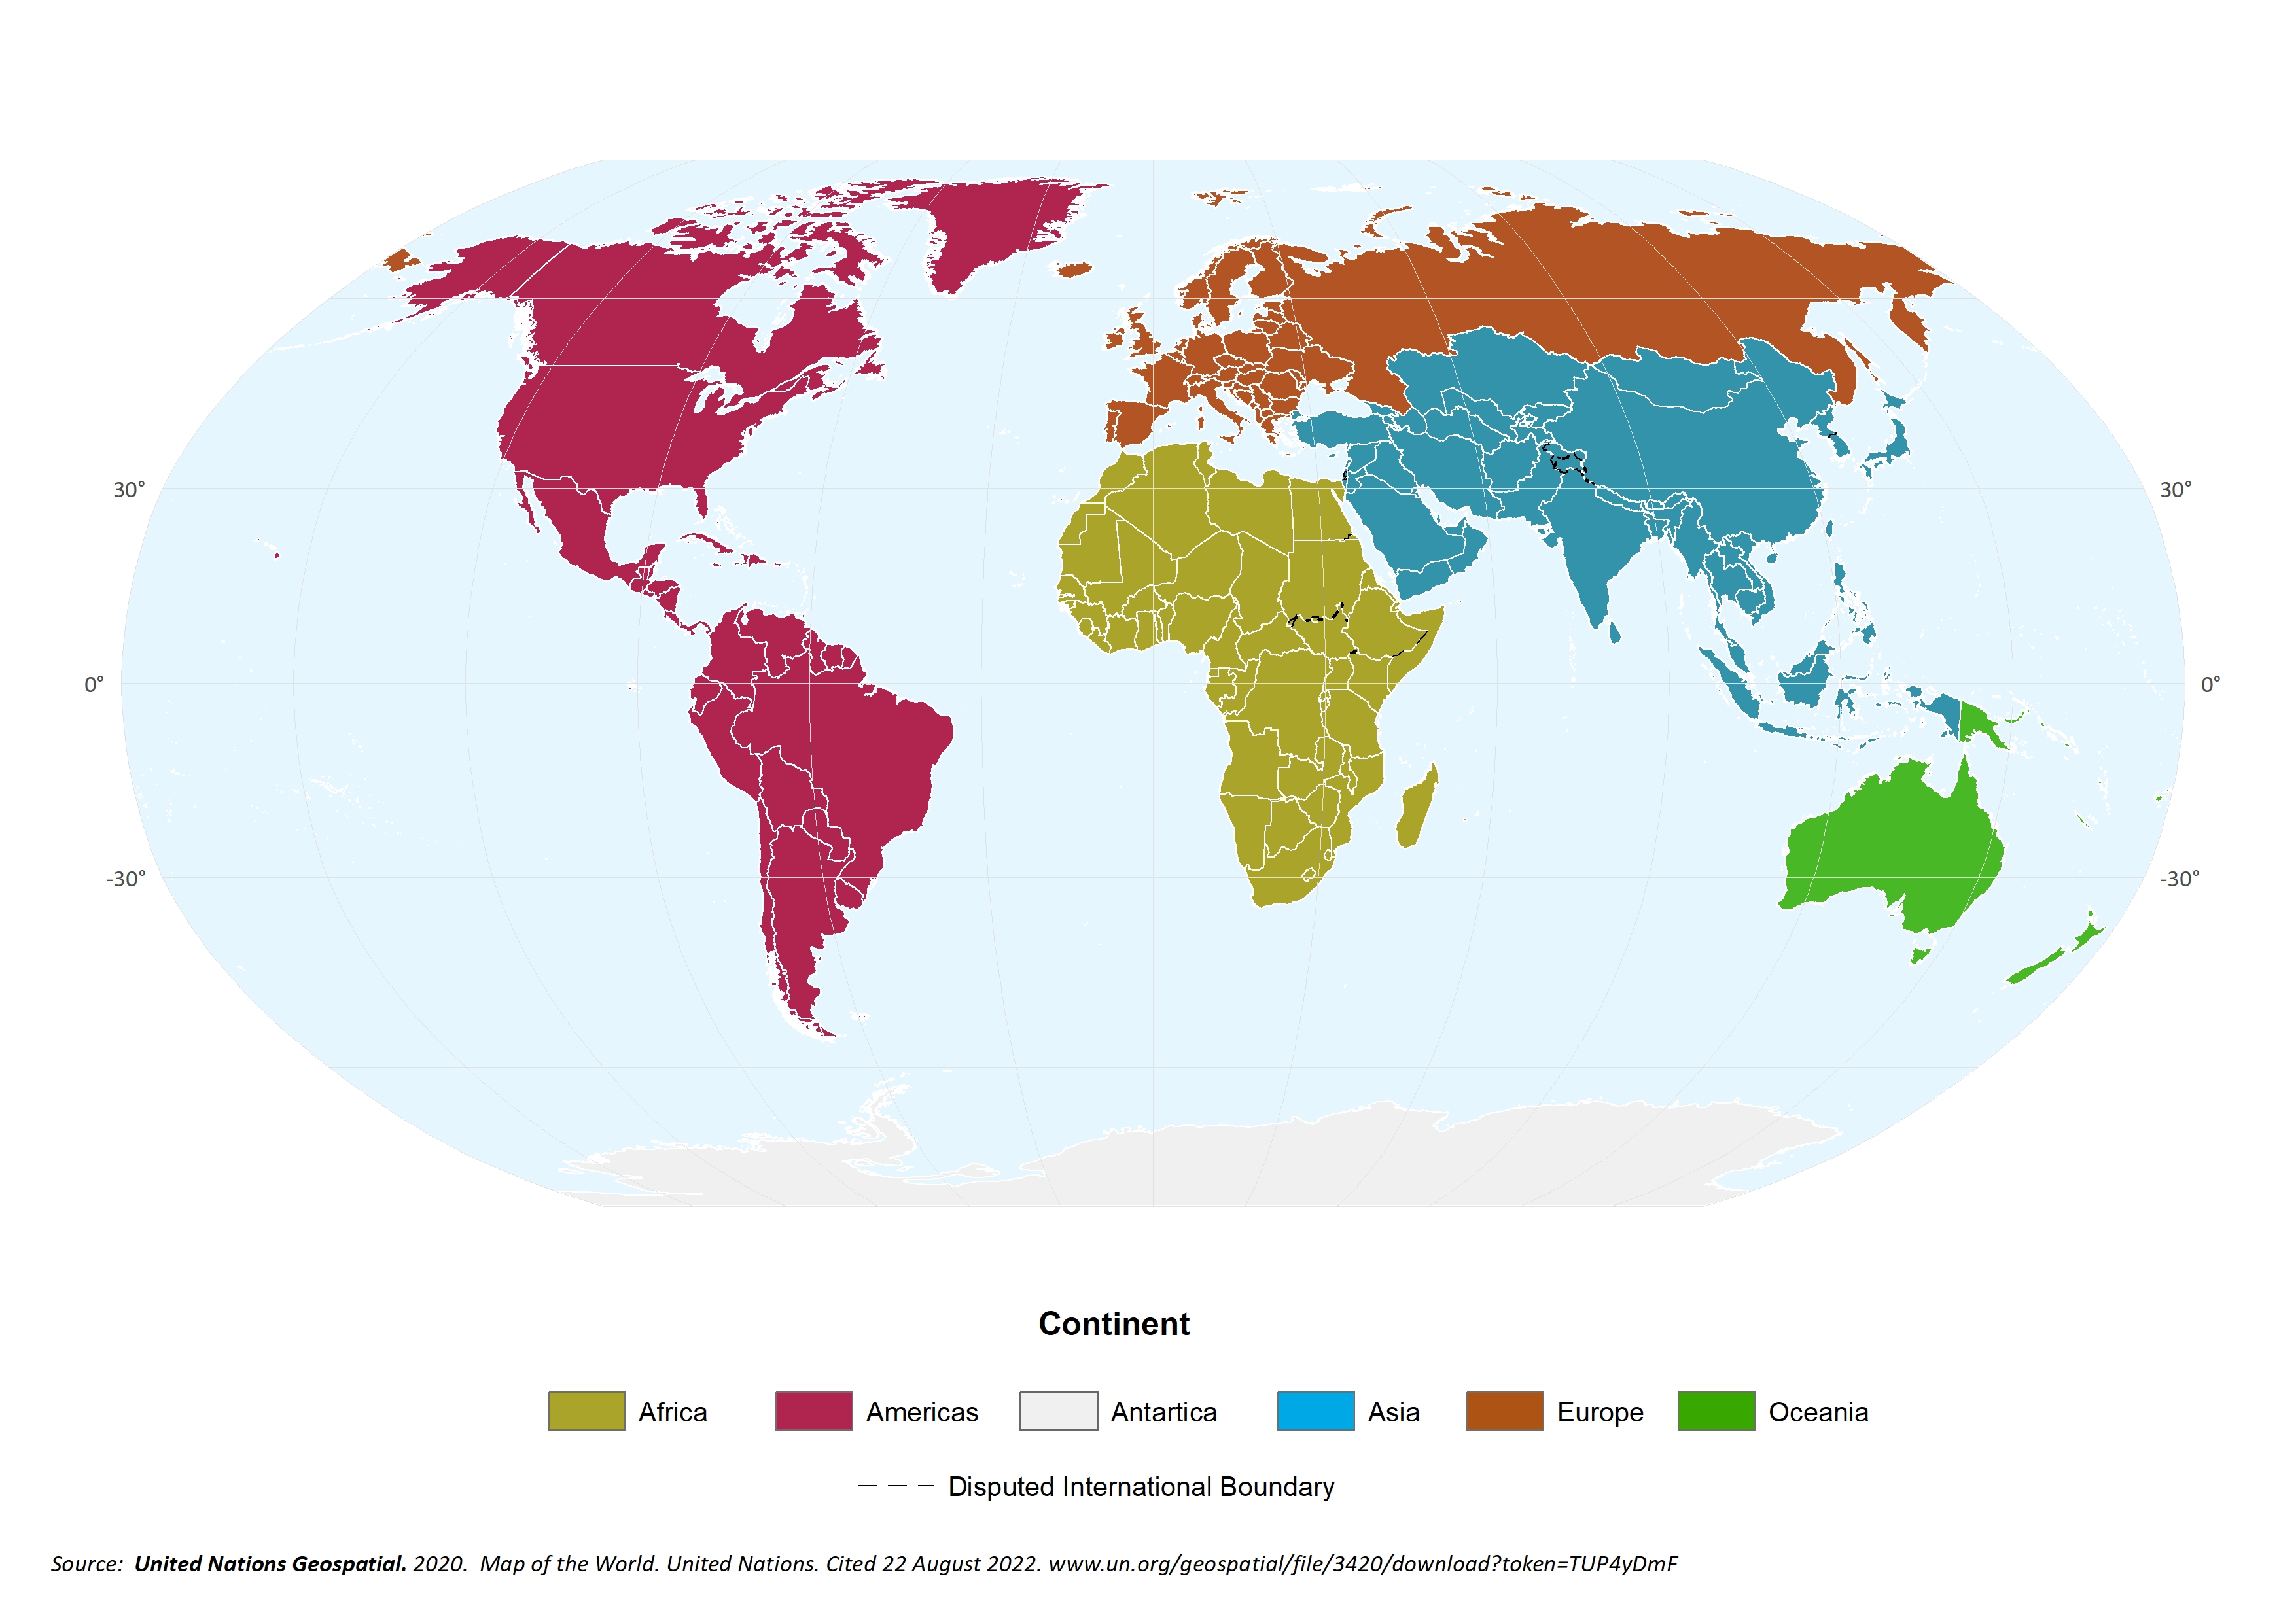
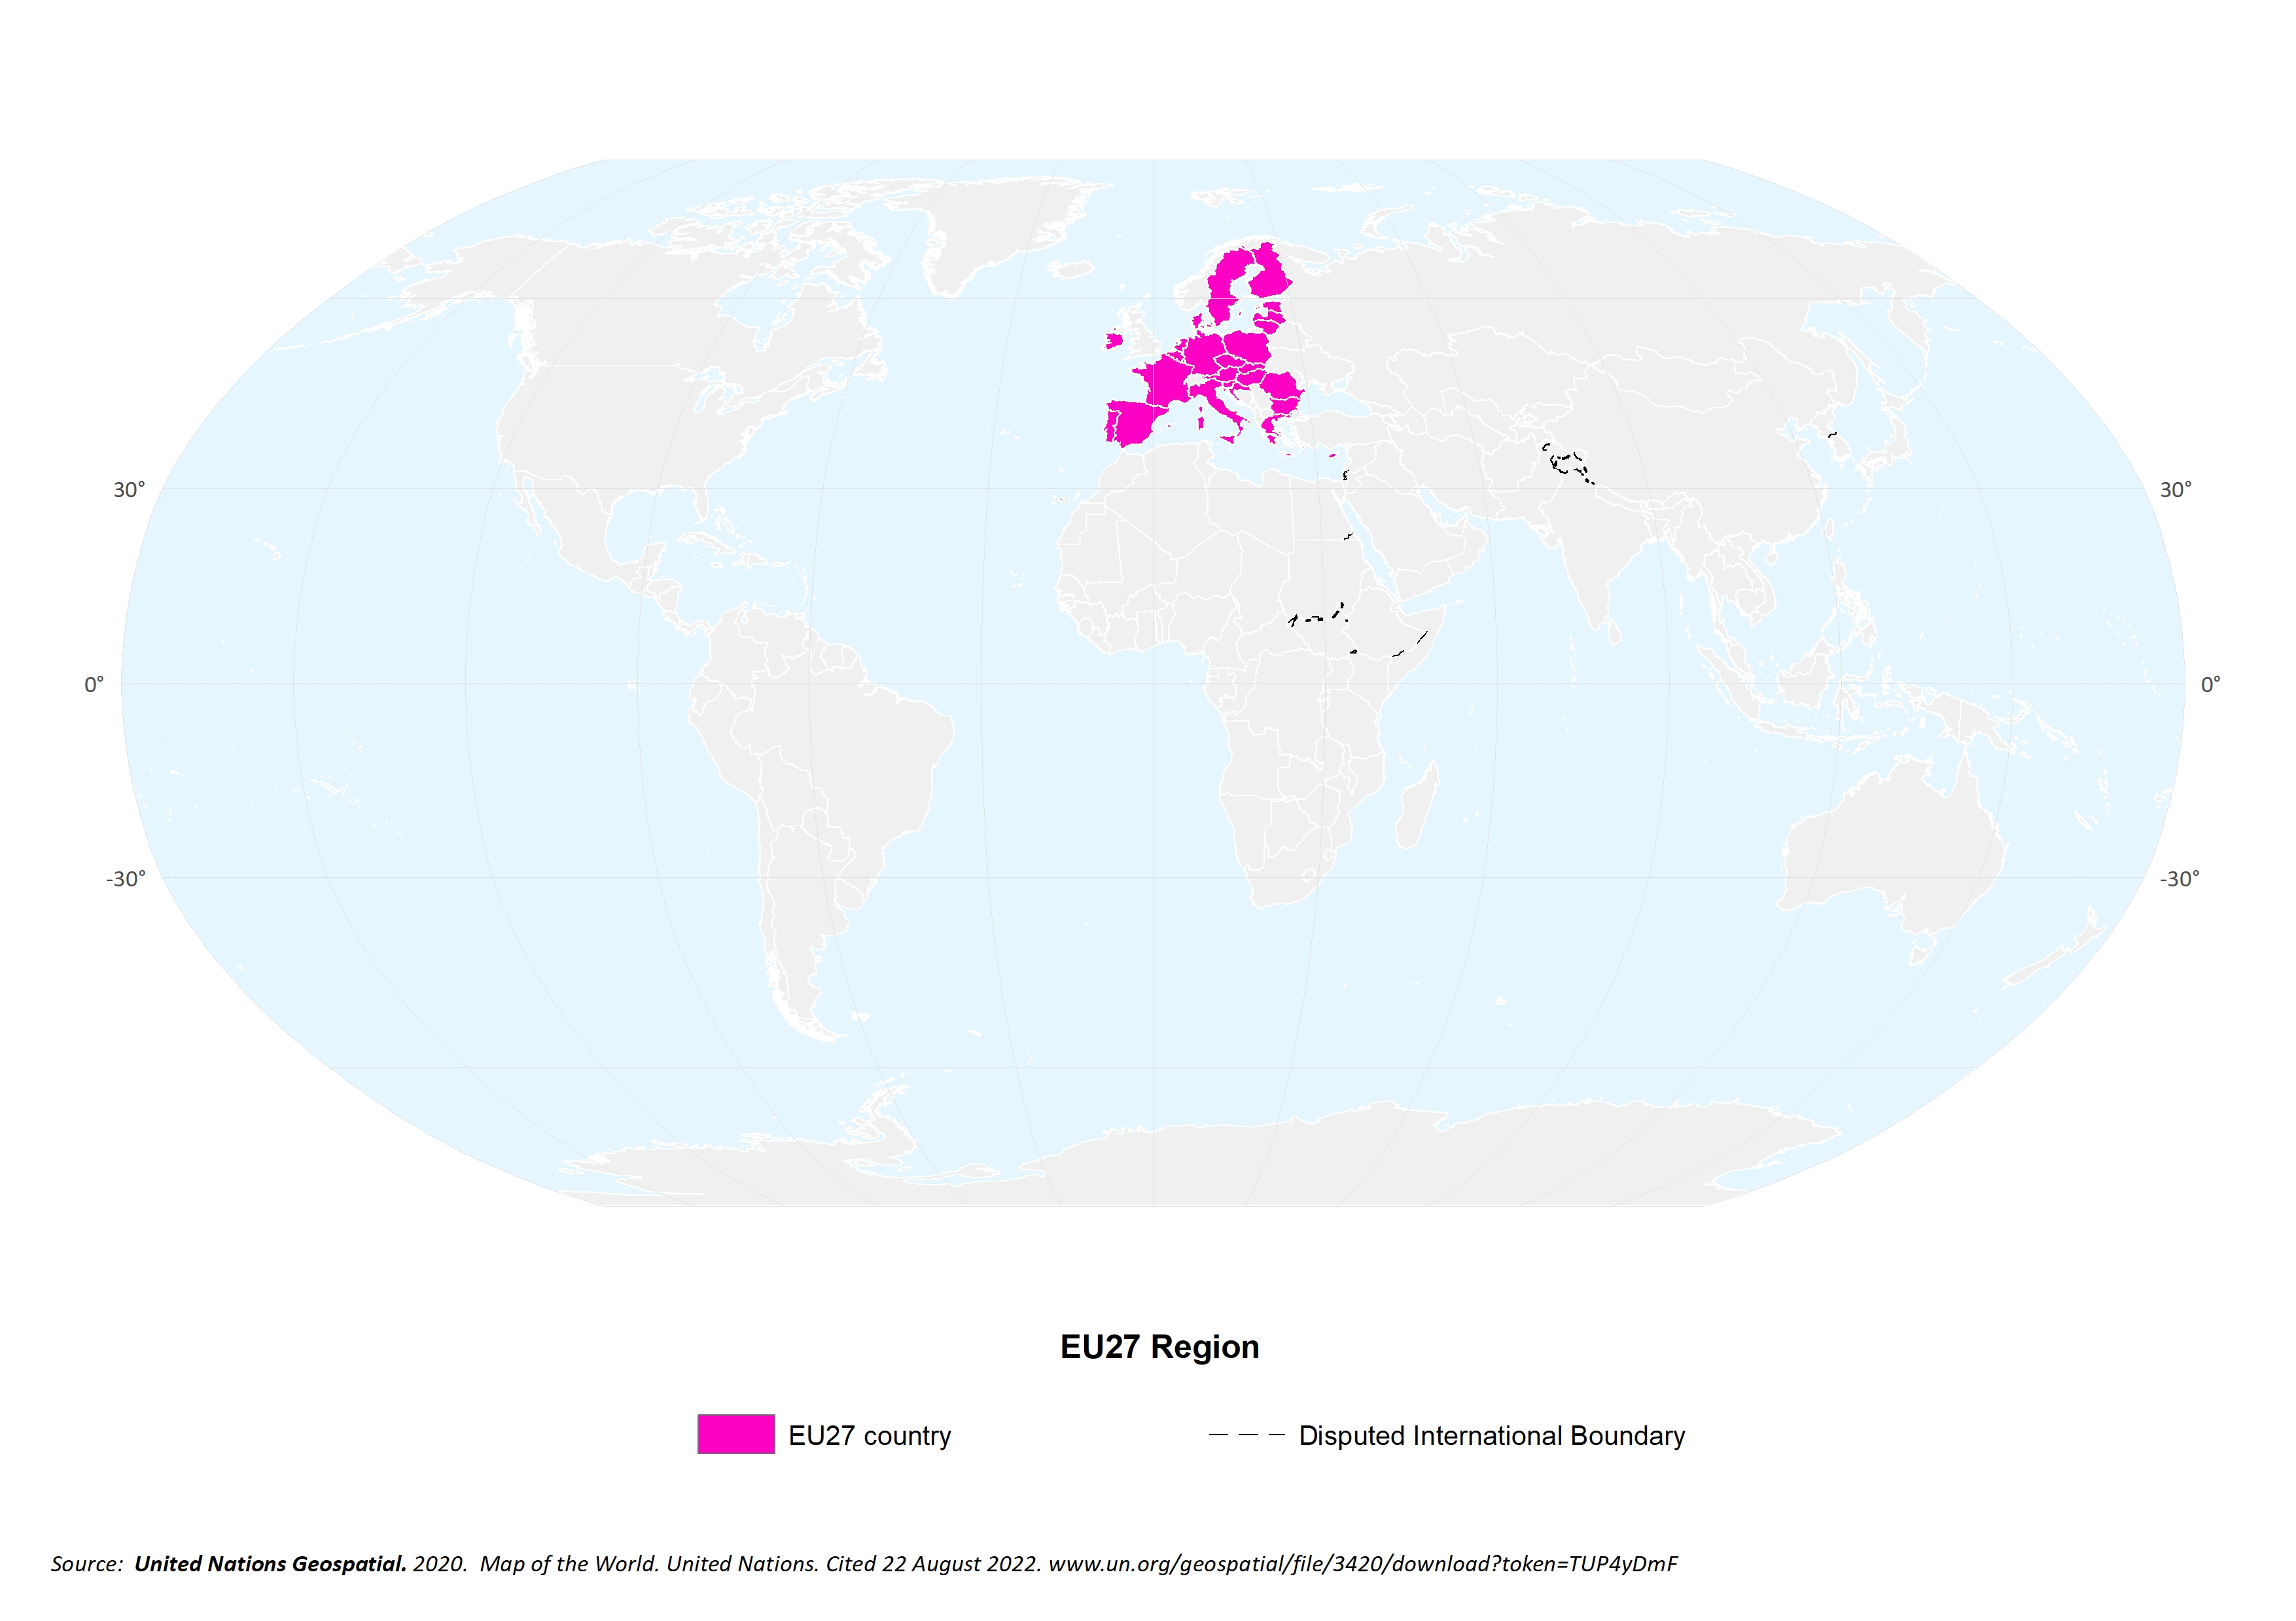
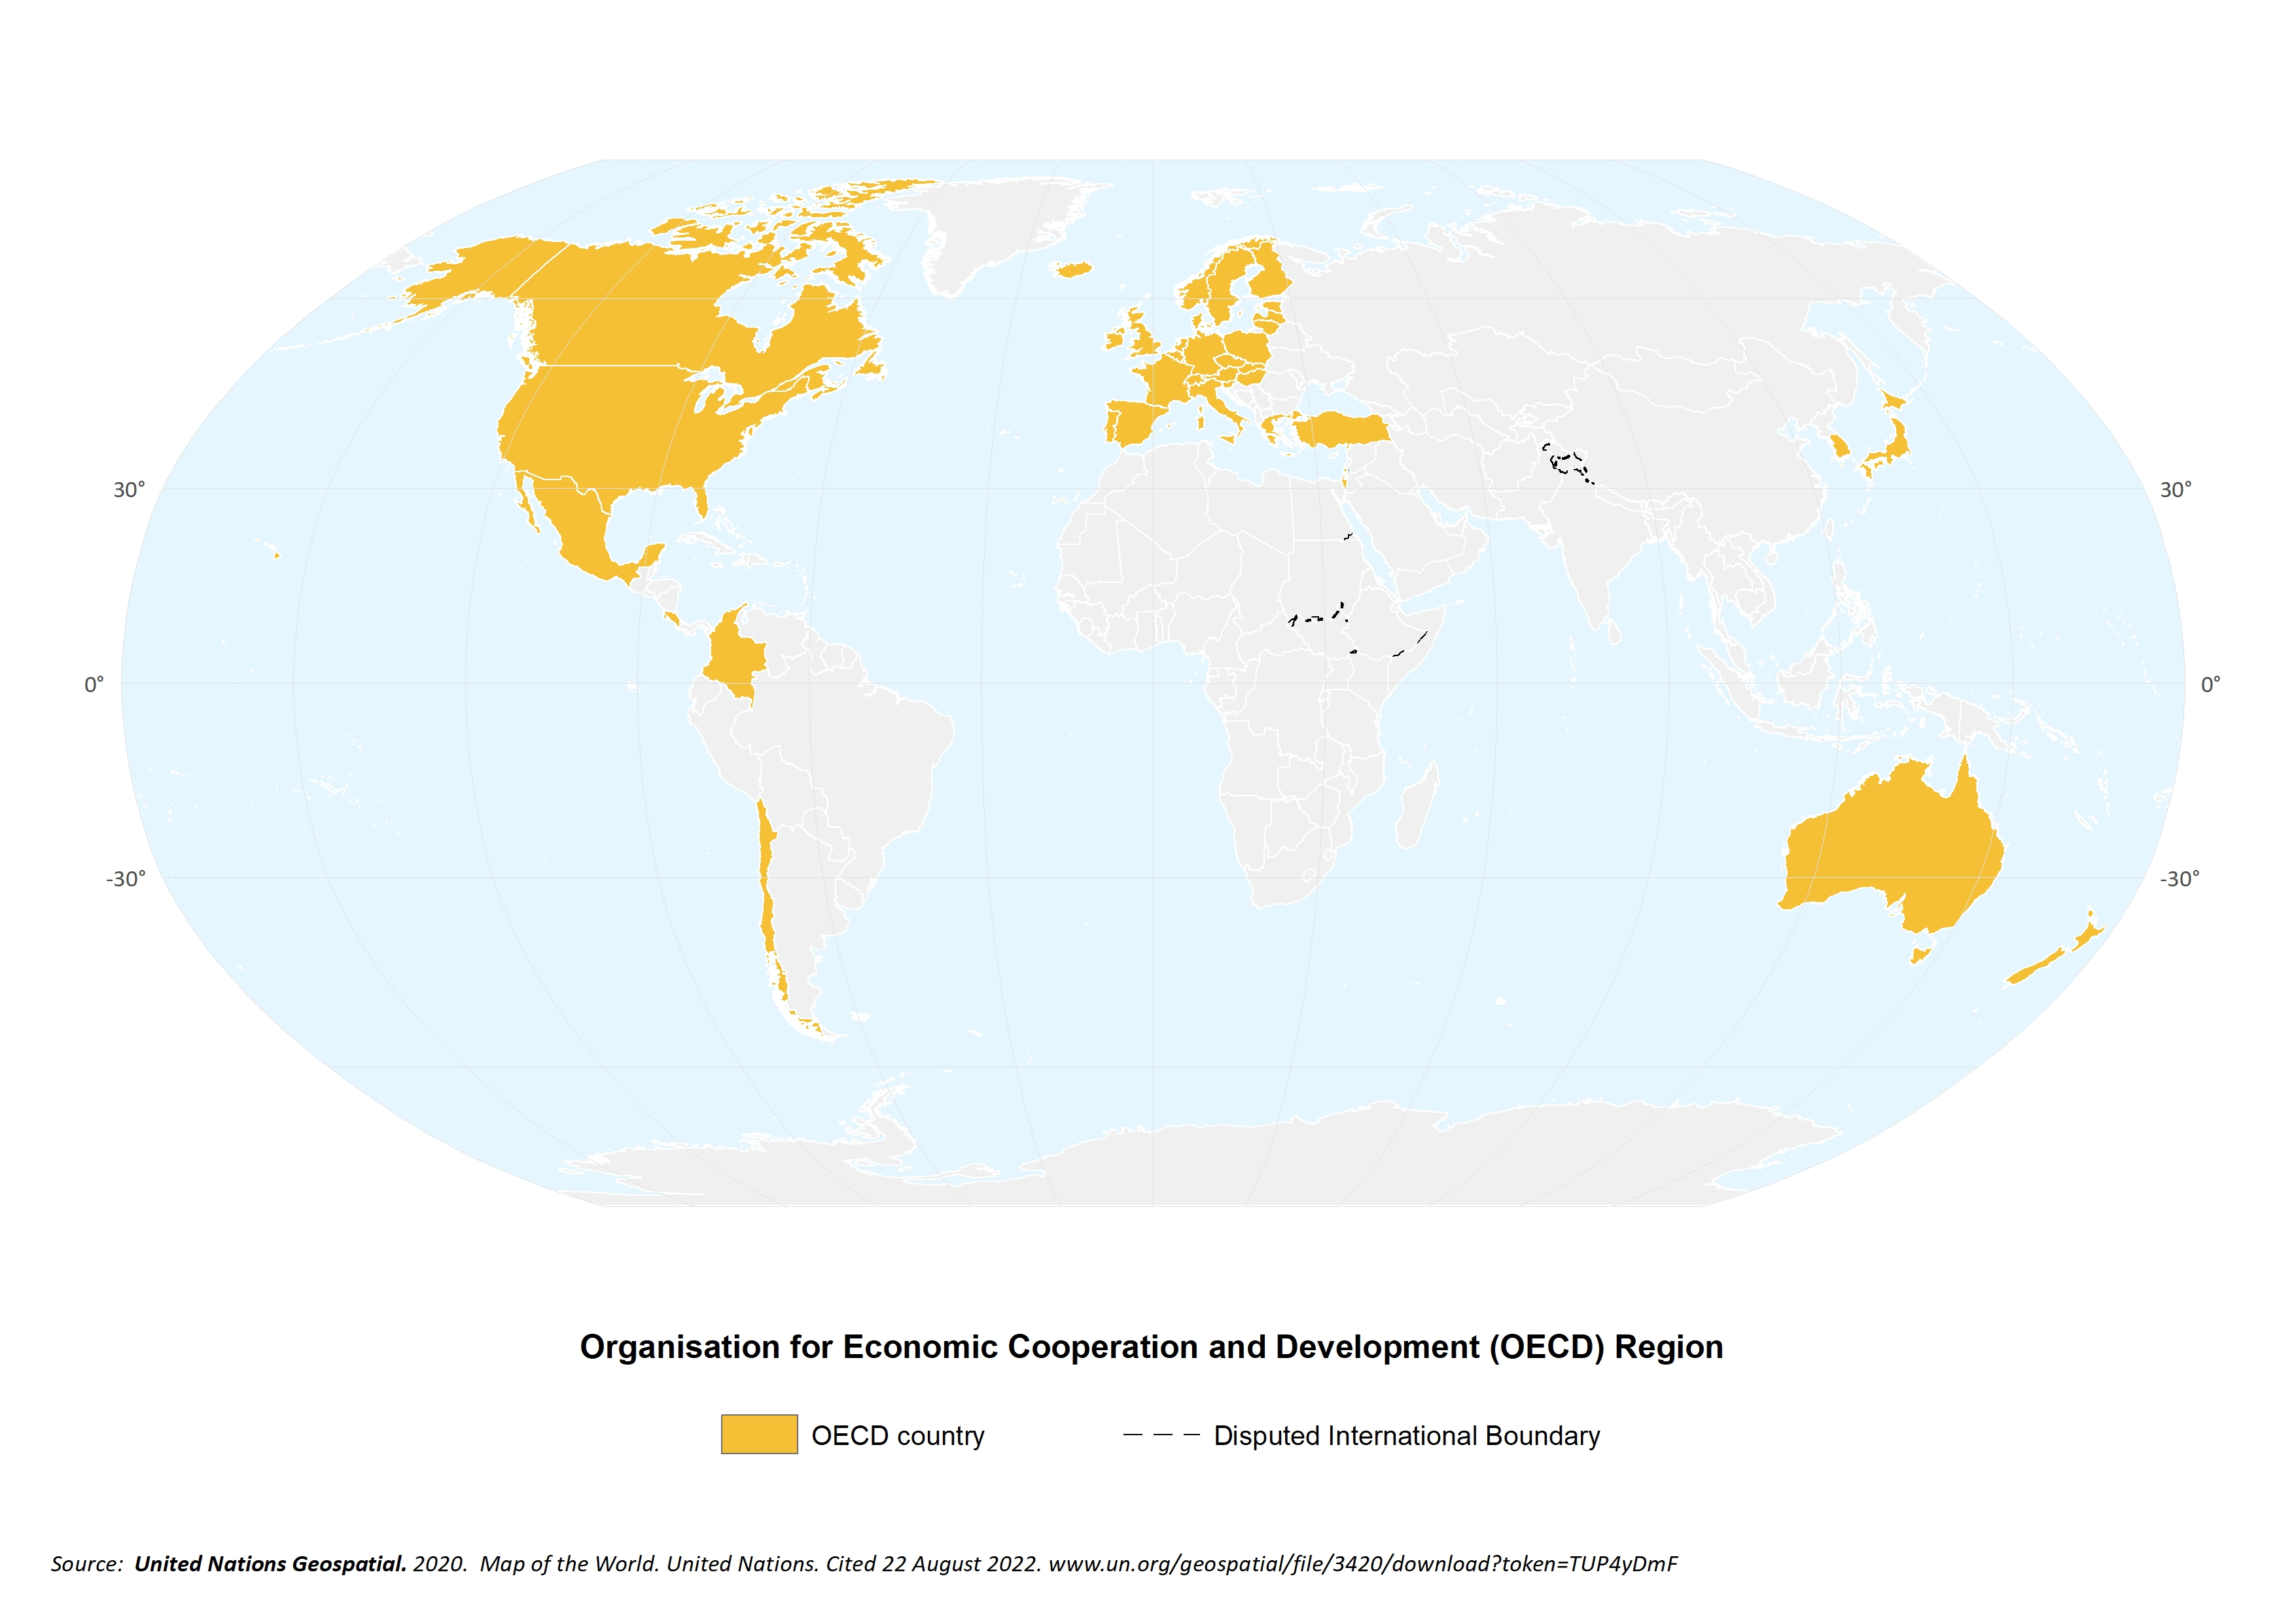
New regional aggregations are available. New regions were added: World Bank Economic Regions, Organisation for Economic Cooperation and Development (OECD), EU27, Continents, and FAO Regions with their aggregated values. Please see the "Regions" link on the left menu.2023-03-27
A little problem with NA values in regional aggregation of input data (Manure managment and others), that caused some inconsitencies in regional aggregates, was fixed.2023-05-15
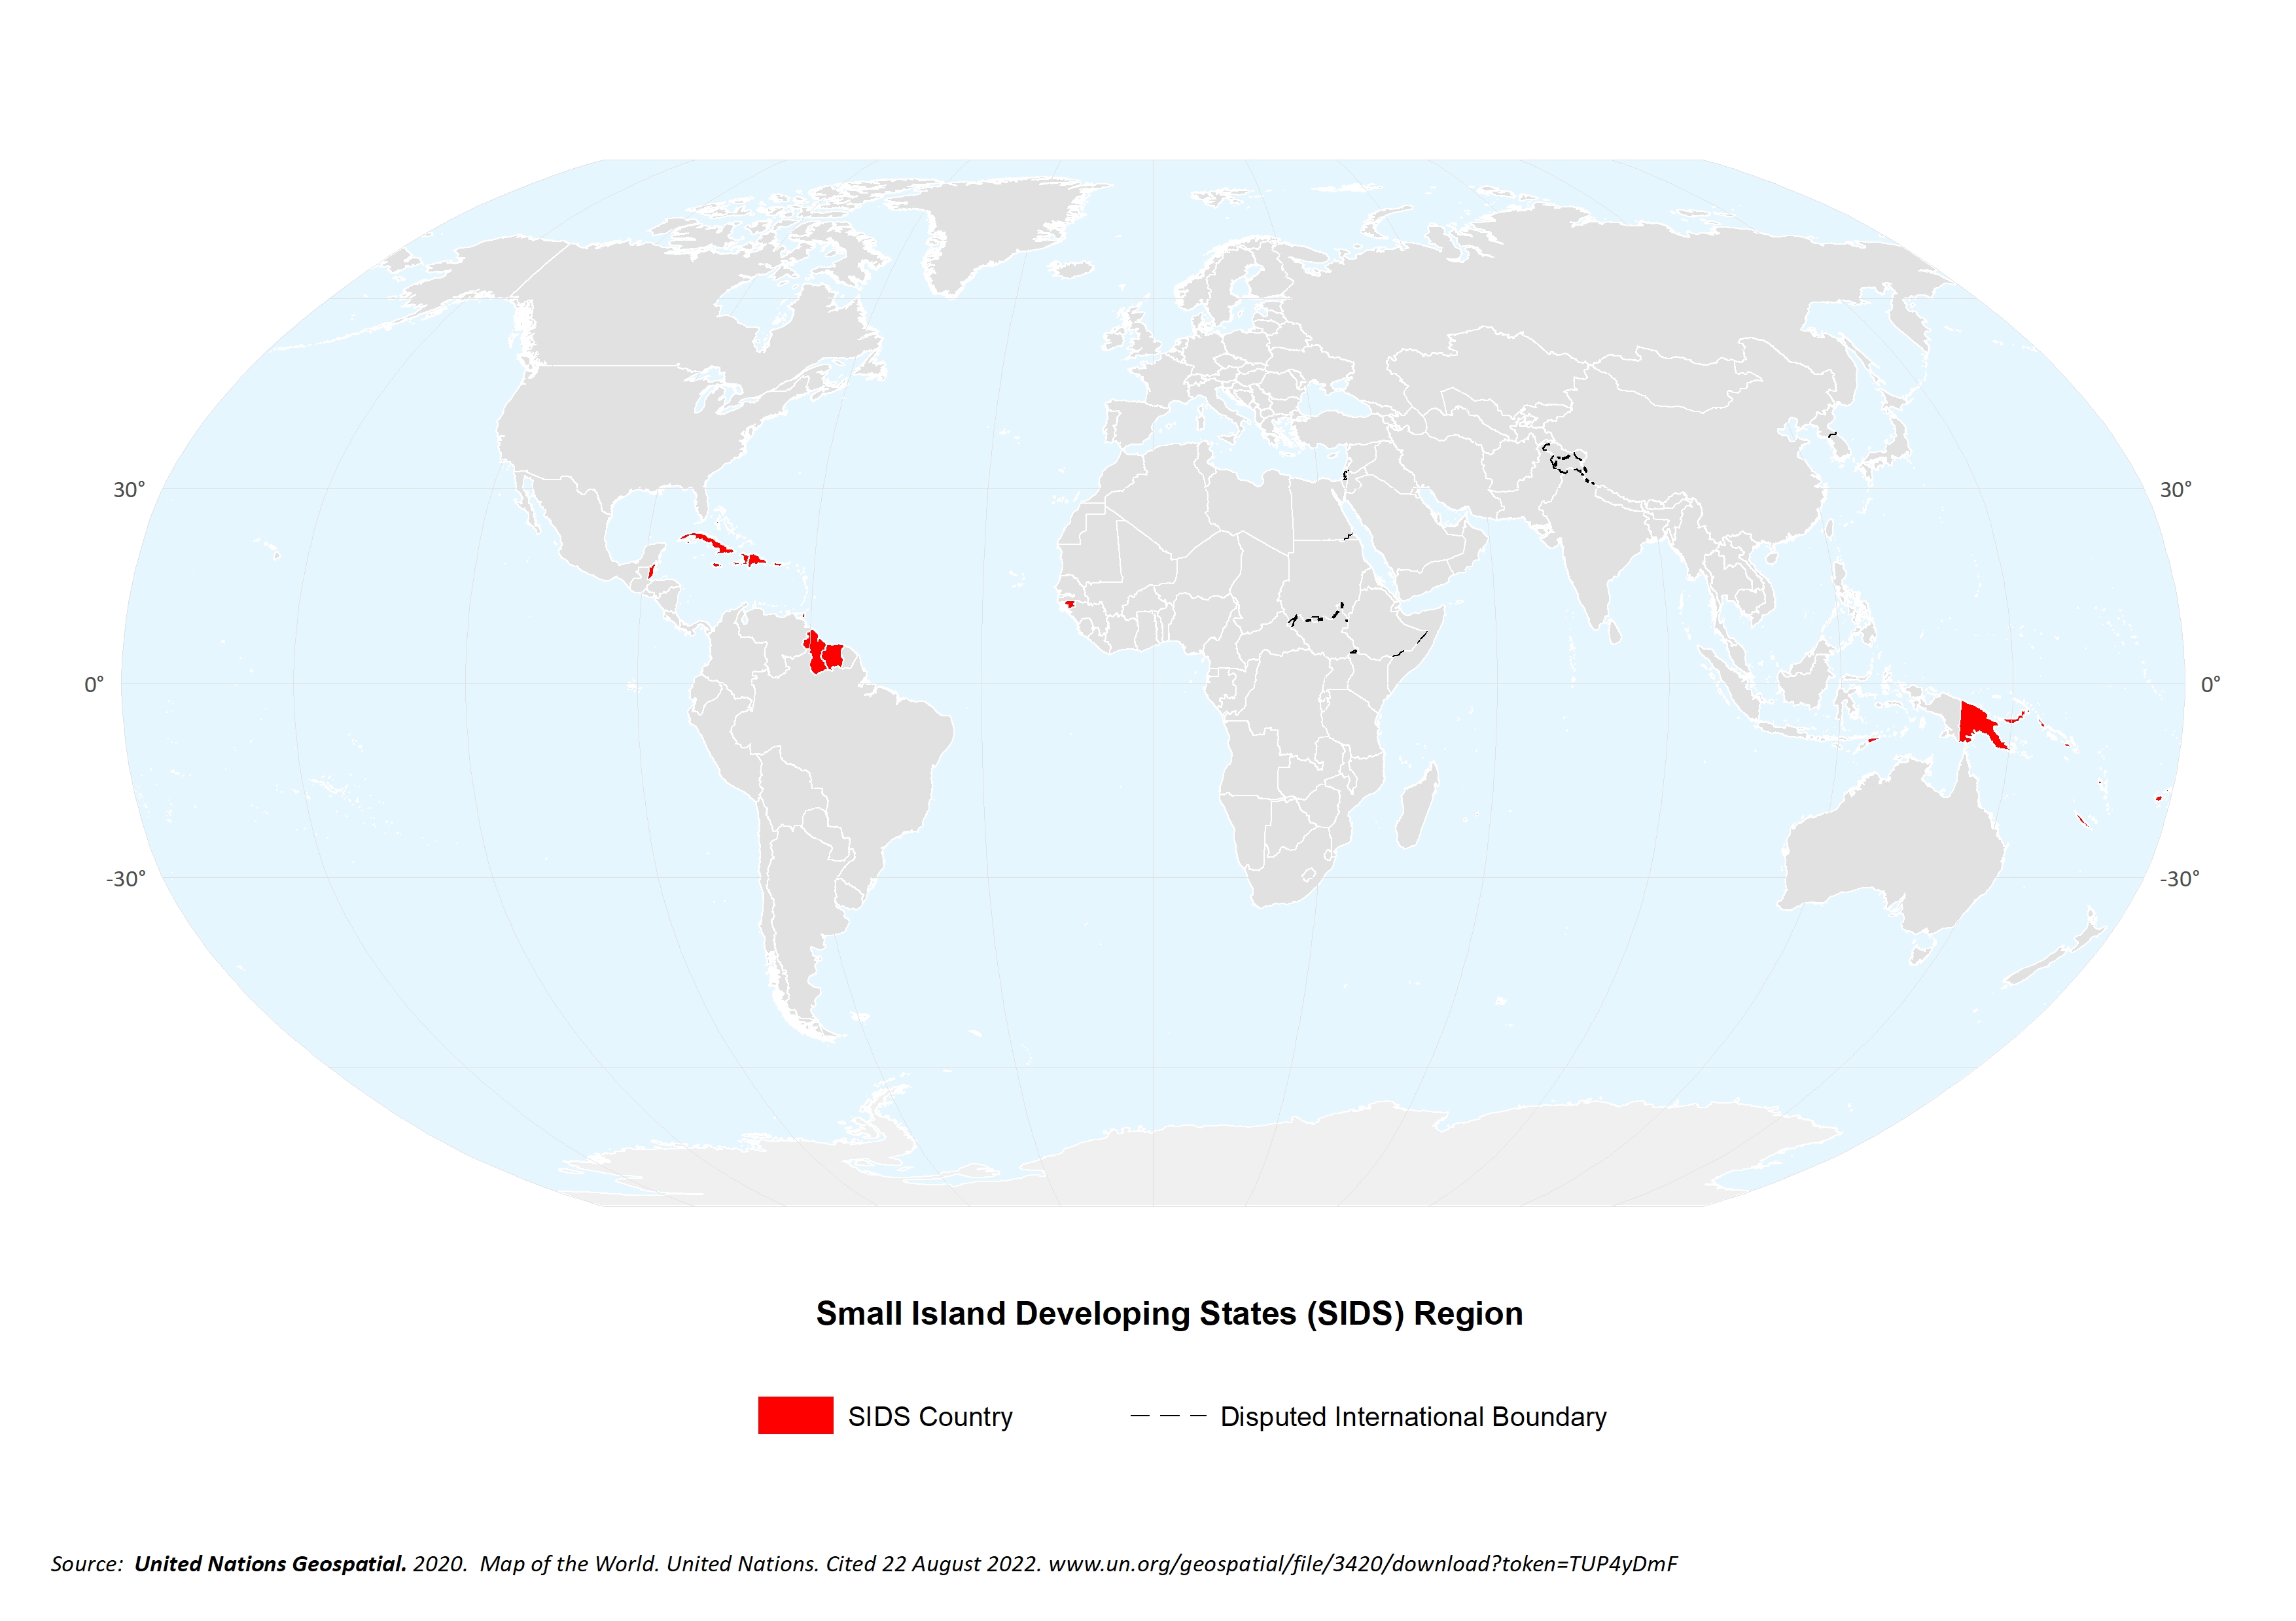
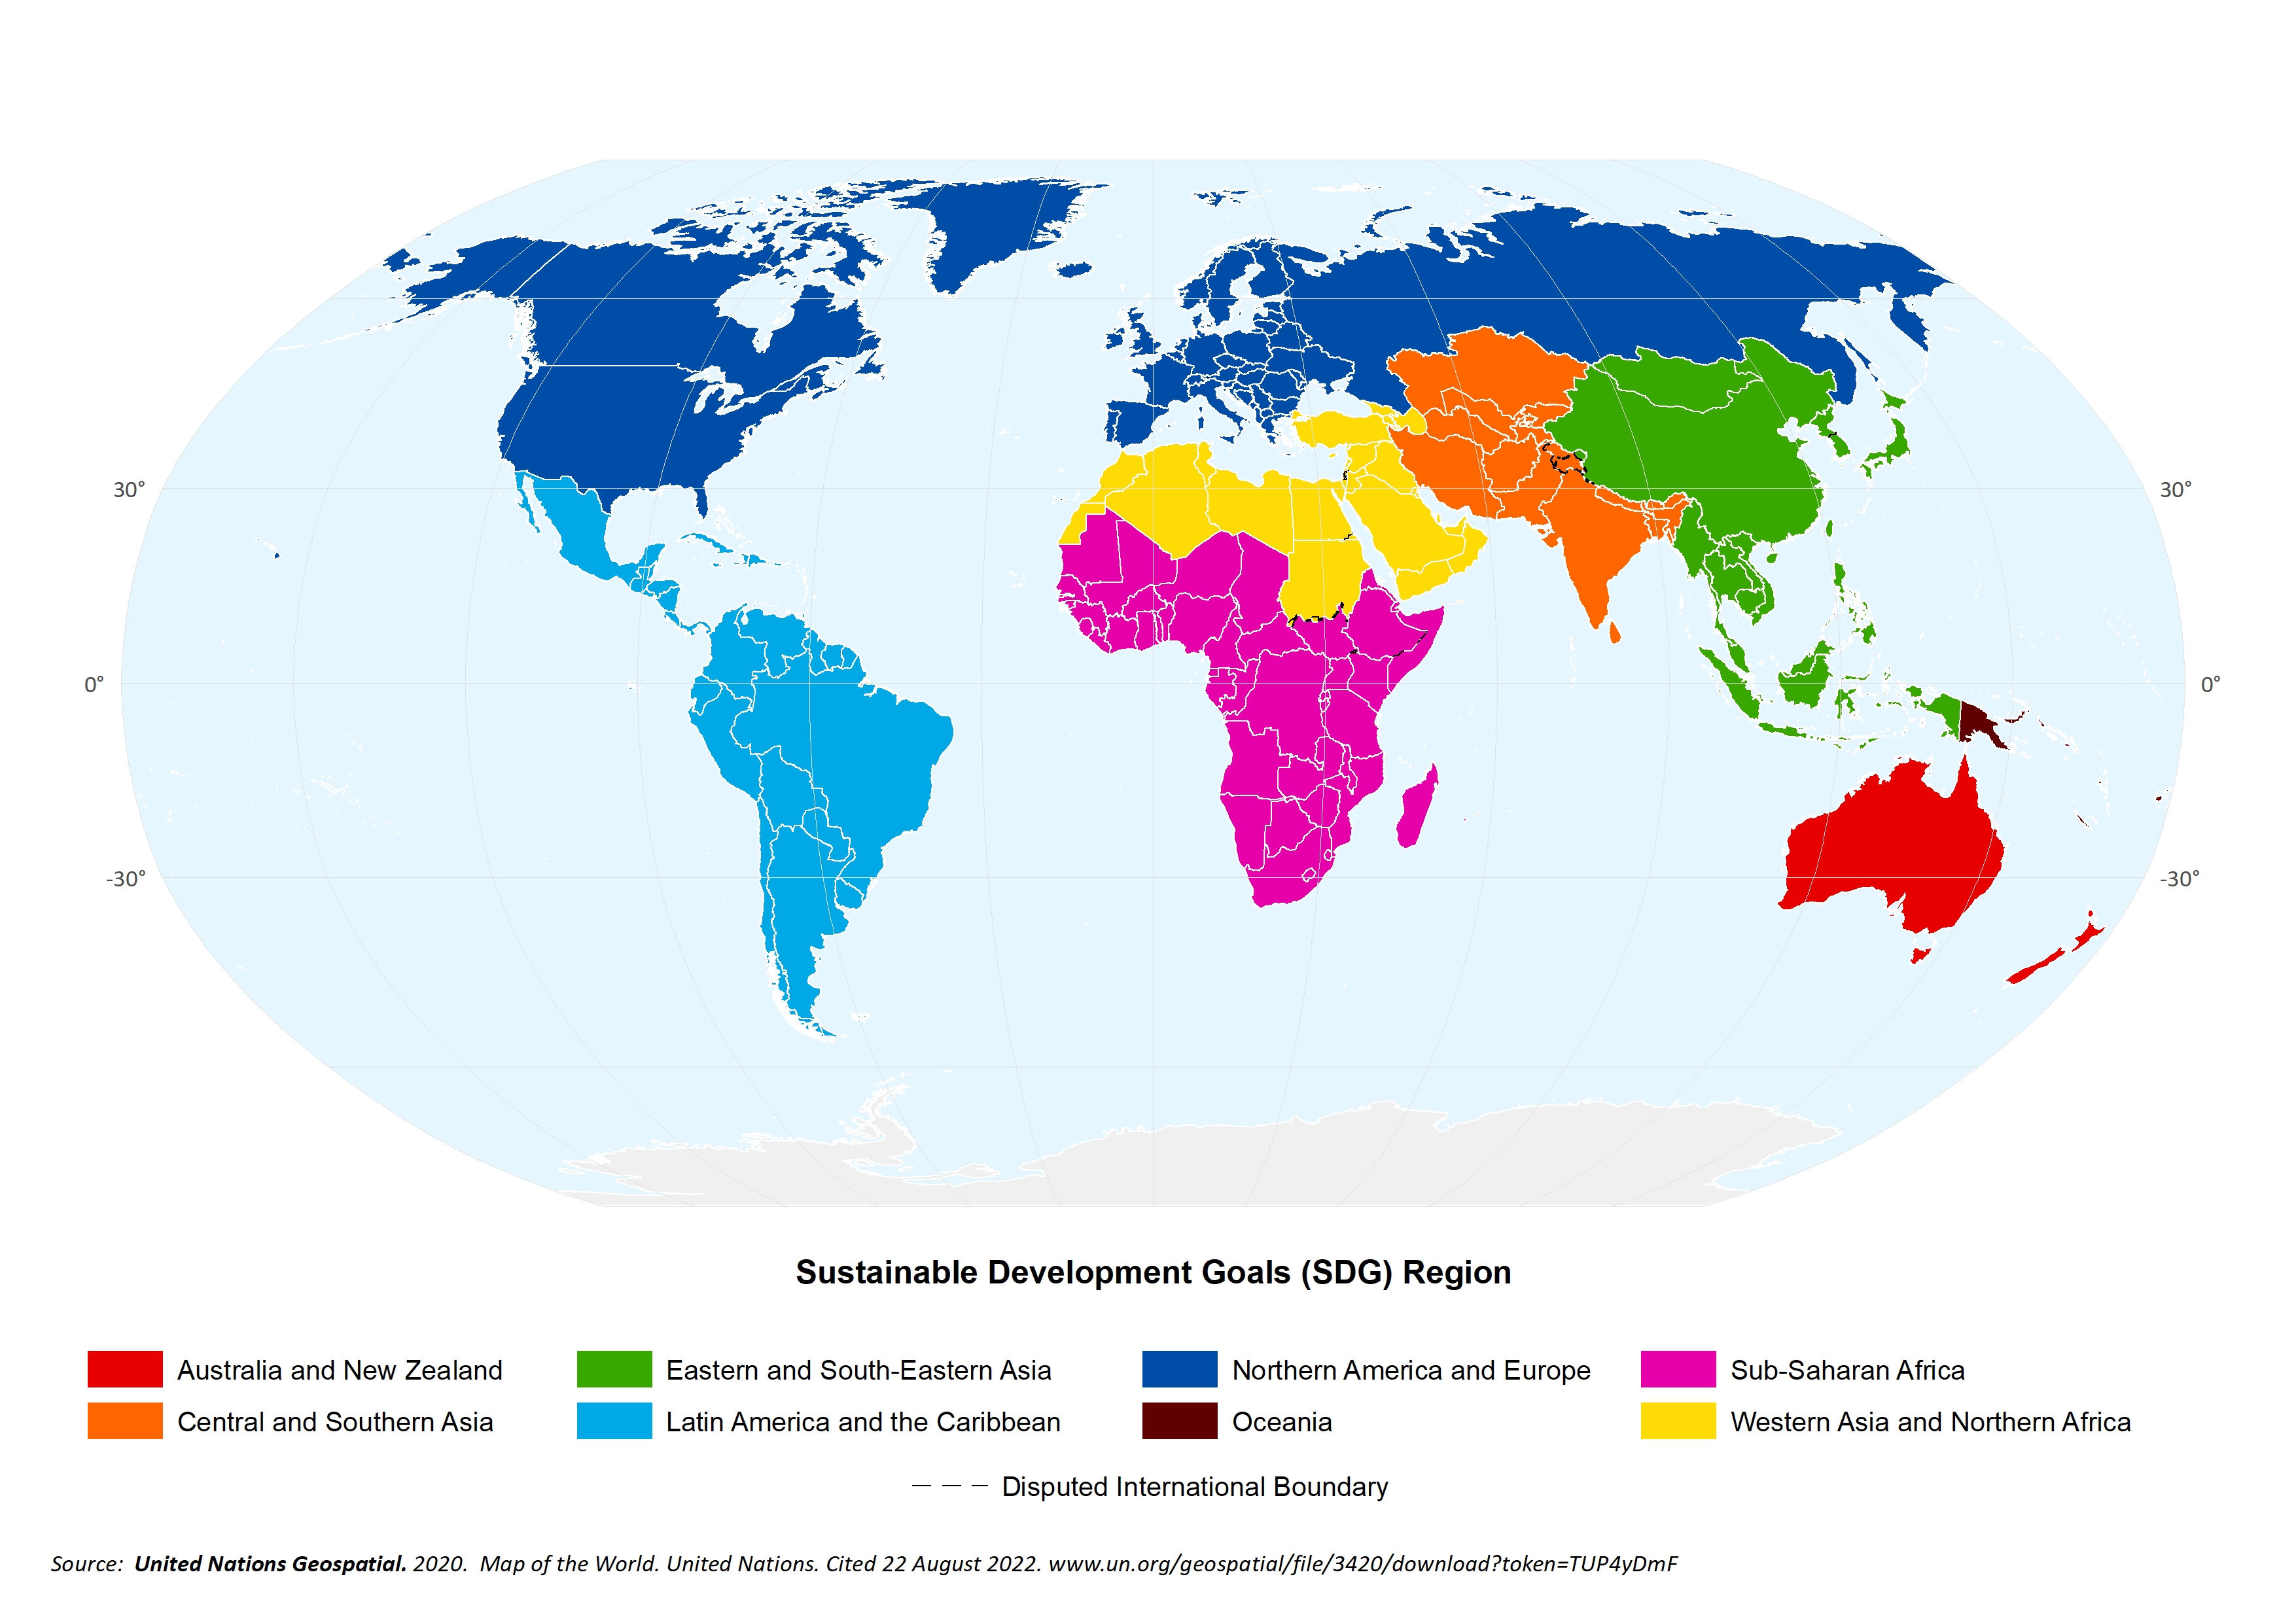
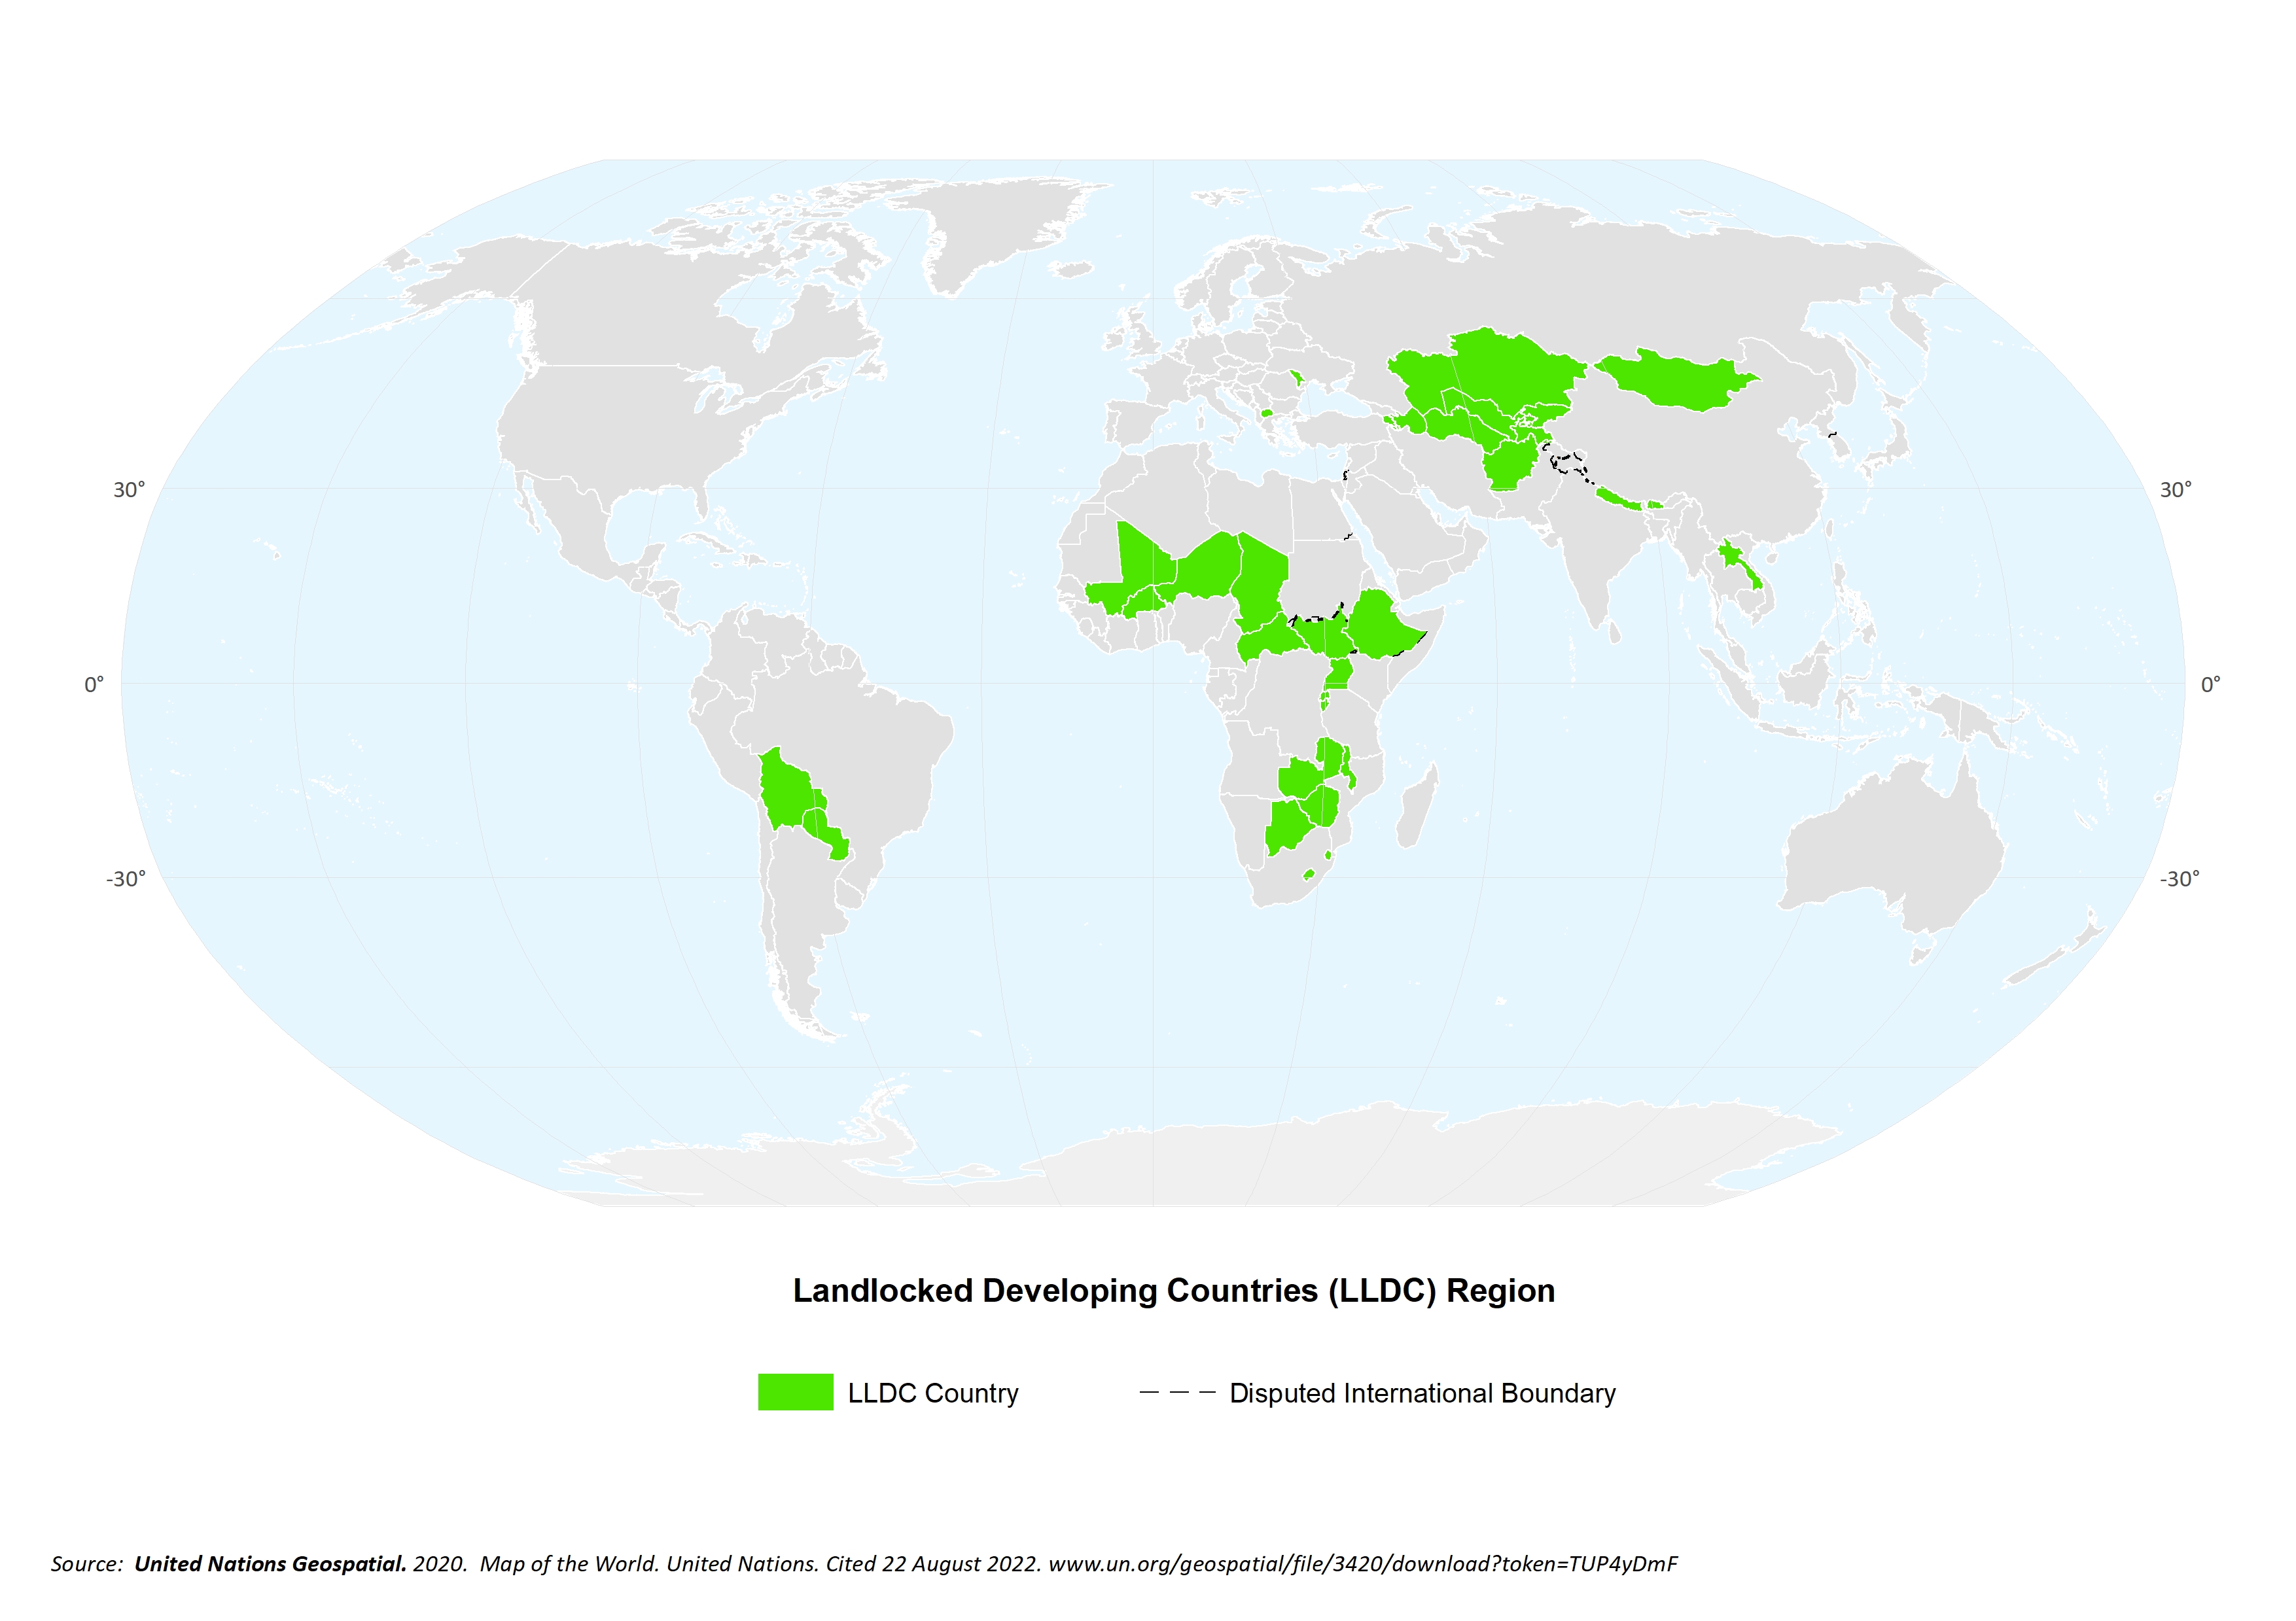
New regional aggregations are available. New regions were added: Sustainable Development Goals Regions (SDGs), Least Developed Countries (LDCs), Landlocked Least Developed Countries (LLDCs), Small Island Developing States (SIDs). Please see the "Regions" link on the left menu.2023-11-09
Total anthropogenic emissions were adjusted, to be aligned with those reported in FAOSTAT for “All sectors with LULUCF”, for the year 2015. Globally, this reduced the estimate of emissions (e.g. from 55 Gt CO2 to 51 Gt CO2, using GWP100 from IPCC AR6), resulting in slightly higher shares of emissions related to livestock on anthropogenic ones. The emission shares and total emissions are now reported with two significant figures.2023-12-21
For consistency with other data sets, the methodology to aggregate country data for animal population and production was changed, resulting in very small differences in animal numbers and production compared to the previous release. In addition, a technical issue was corrected that affected some the number of chickens in layer production systems for countries.Regions used for aggregation
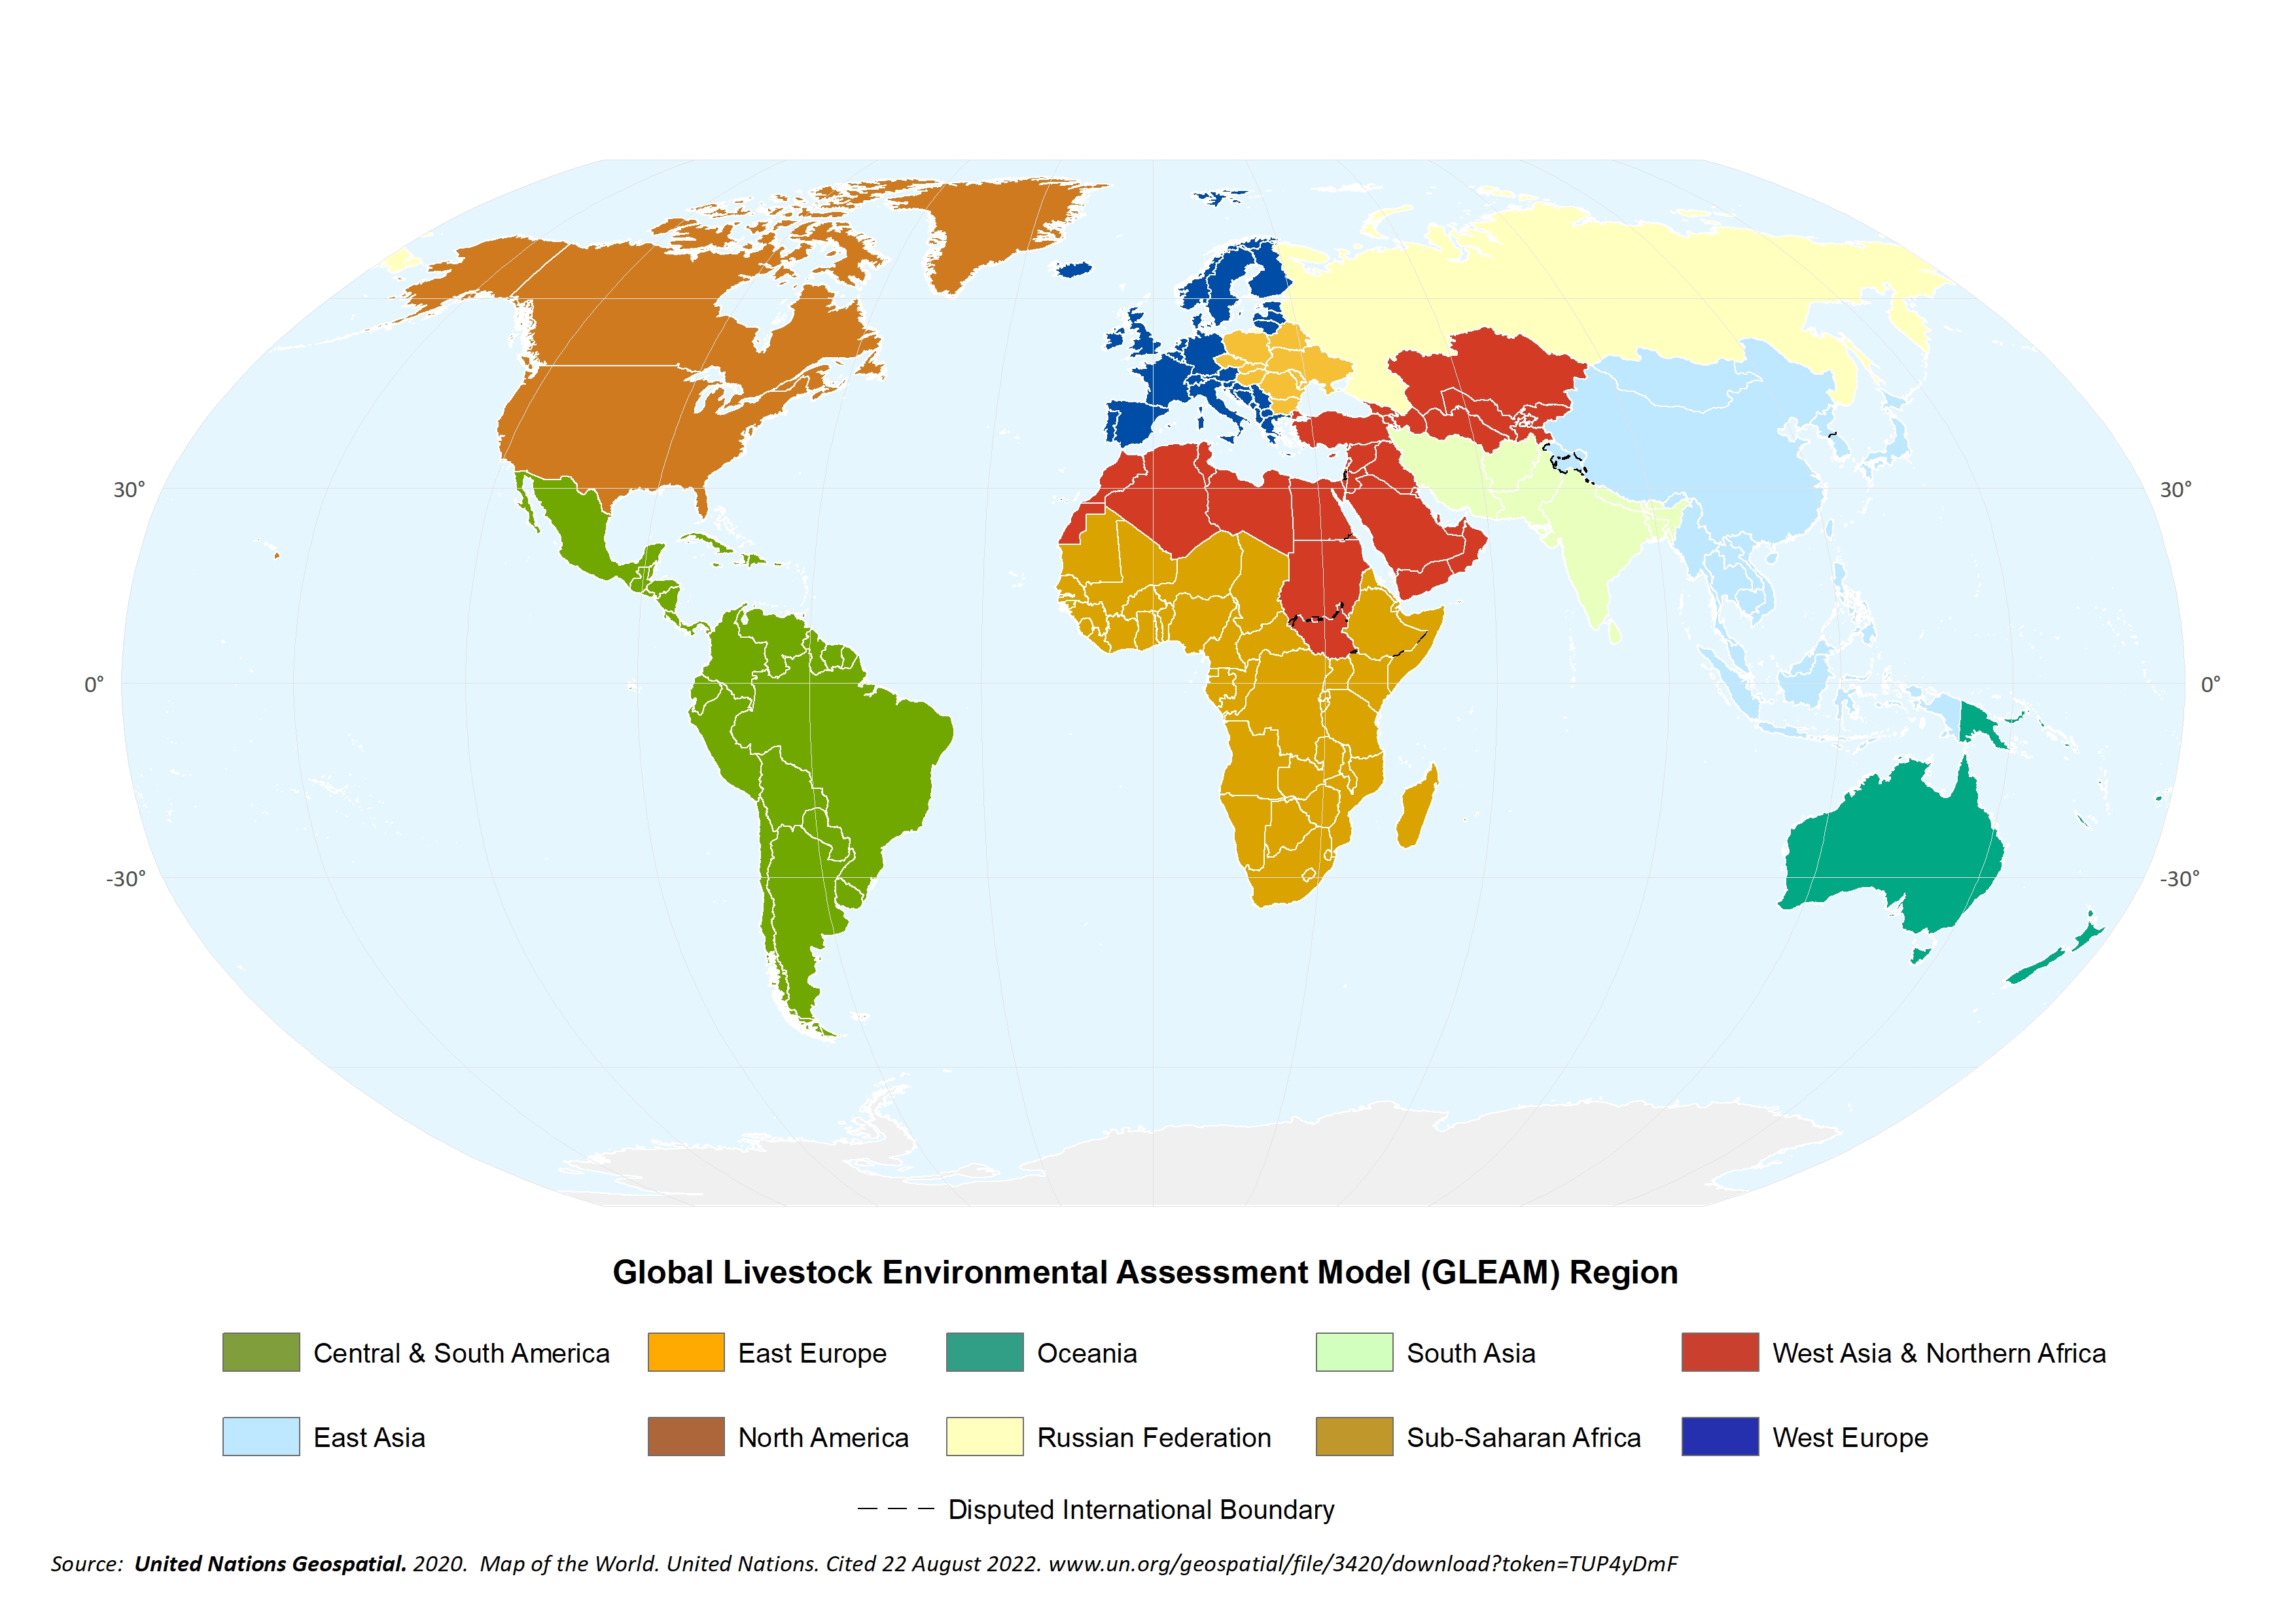
This section shows regions for which GLEAM data are aggregated, based on geographic, economic or administrative criteria. Details on the classifications are provided below.
The boundaries and names shown and the designations used on these map(s) do not imply the expression of any opinion whatsoever on the part of FAO concerning the legal status of any country, territory, city or area or of its authorities, or concerning the delimitation of its frontiers and boundaries. Dashed lines on maps represent approximate border lines for which there may not yet be full agreement.
Continents
FAO Regions

GLEAM Regions
SDG Countries
World Bank Regions
EU27 Countries
LDC Countries

LLDC Countries
OECD Countries
SIDS Countries