

Energy Shift
The Solar Power Duck Curve Explained
The Solar Power Duck Curve Explained
With the increasing demand for electricity as the world shifts away from fossil fuels, cleaner sources of energy like solar and wind are becoming more and more common.
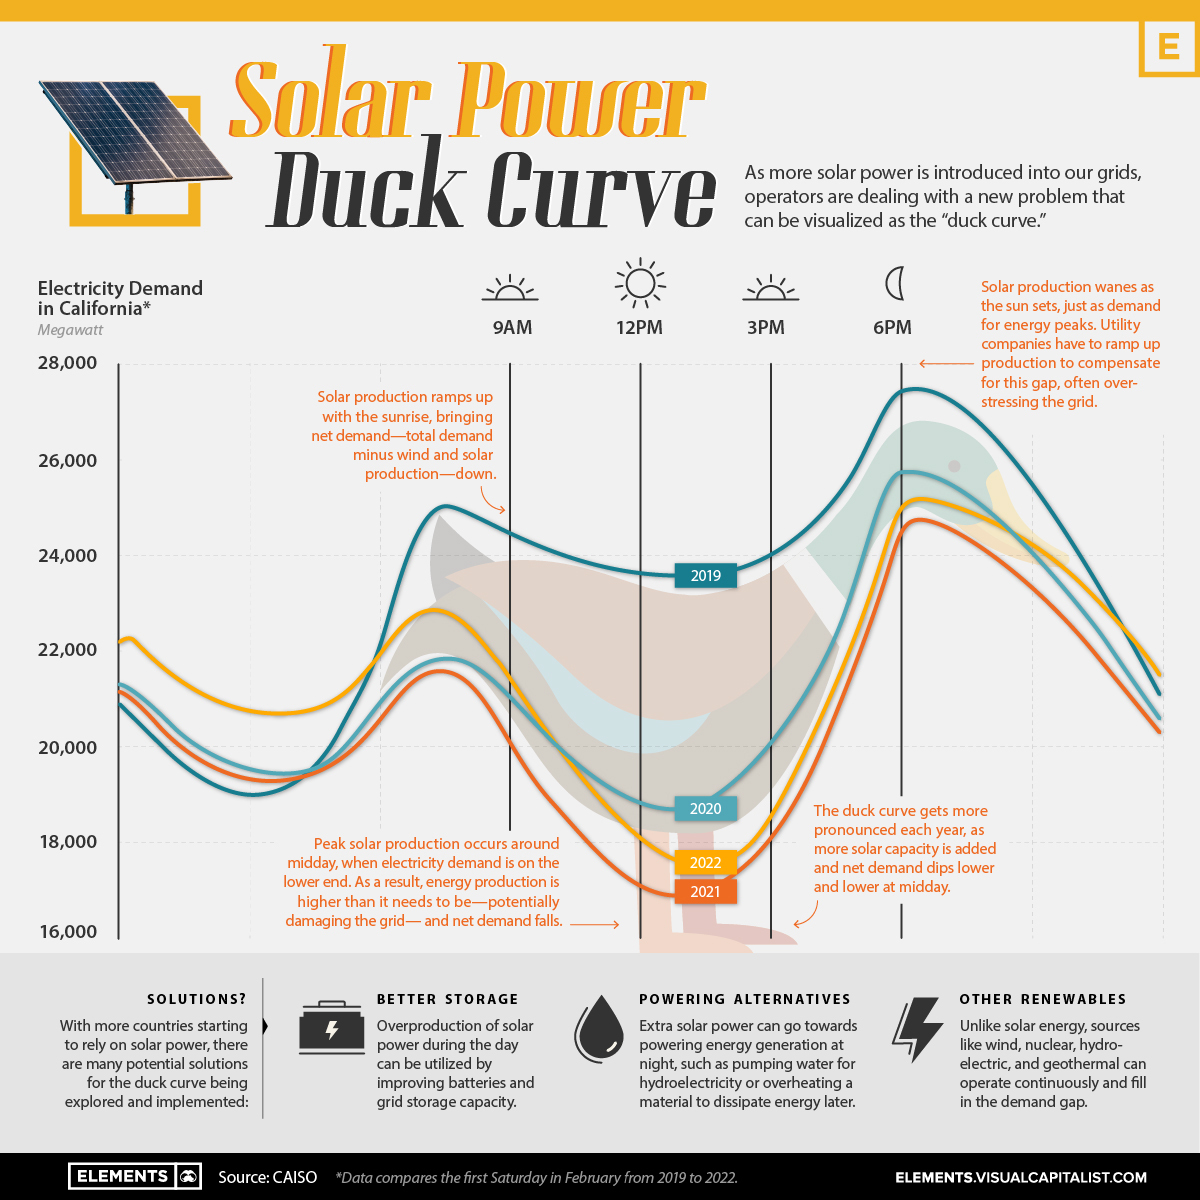
However, as more solar power is introduced into our grids, operators are dealing with a new problem that can be visualized as the “duck curve.”
Origins of the Duck Curve
In a world heavily reliant on electricity, utility companies have gotten better at using data to anticipate demand and trying to operate as efficiently as possible.
Usually, power companies supply the least amount of power overnight while most consumers are sleeping, ramping up during the morning as people wake up and businesses get going. Then, at sunset, energy demand peaks.
Utility companies use models to predict demand and operate as efficiently as possible by supplying more power during times of higher demand. But the introduction of solar power has brought about problems in these demand curve models.
Since solar power relies on the Sun, peak solar production occurs around midday, when electricity demand is often on the lower end. As a result, energy production is higher than it needs to be, and net demand—total demand minus wind and solar production—falls. Then, when evening approaches, net demand increases, while solar power generation falls.
This discrepancy results in a net demand curve that takes the shape of a duck, and the duck curve gets more pronounced each year, as more solar capacity is added and net demand dips lower and lower at midday.
Why the Curve is Ruffling Feathers
The drop in net demand at midday basically creates two problems:
- Solar energy production wanes as the sun sets, just as demand for energy typically peaks. Utility companies are having to ramp up production to compensate for this gap, often overstressing a grid that is not yet set up for these peaks.
- Traditional sources of energy like nuclear and coal are only economic when they are running all the time. If you have to turn them off at mid-day because the power is supplied by solar, they become economically unfeasible.
Due to overproduction, solar power is already being wasted in some places where the technology is widely used, like California.
The problem is most intense during summer or spring when part of the solar panels has to be turned off to avoid overloading or even damaging the power grid.
Flattening the Duck
With more countries starting to rely on solar power, there are many potential solutions for the duck curve being explored (and implemented):
- Energy Storage: Overproduction of solar power during the day can be utilized by improving batteries and grid storage capacity.
- Powering Alternatives: Extra solar power can go towards powering energy generation at night, such as pumping water for hydroelectricity or overheating a material to dissipate energy later.
- Other Clean Sources: Unlike solar energy, sources like nuclear, hydroelectric, and geothermal can operate continuously and fill in the demand gap.
While grid managers study how to serve the new supply and demand, the duck curve is one of the greatest challenges facing renewable energy.


Energy Shift
Visualized: A Decade of Clean Energy Investment
In this graphic, Visual Capitalist has partnered with EnergyX to explore the growth of global clean energy investment.
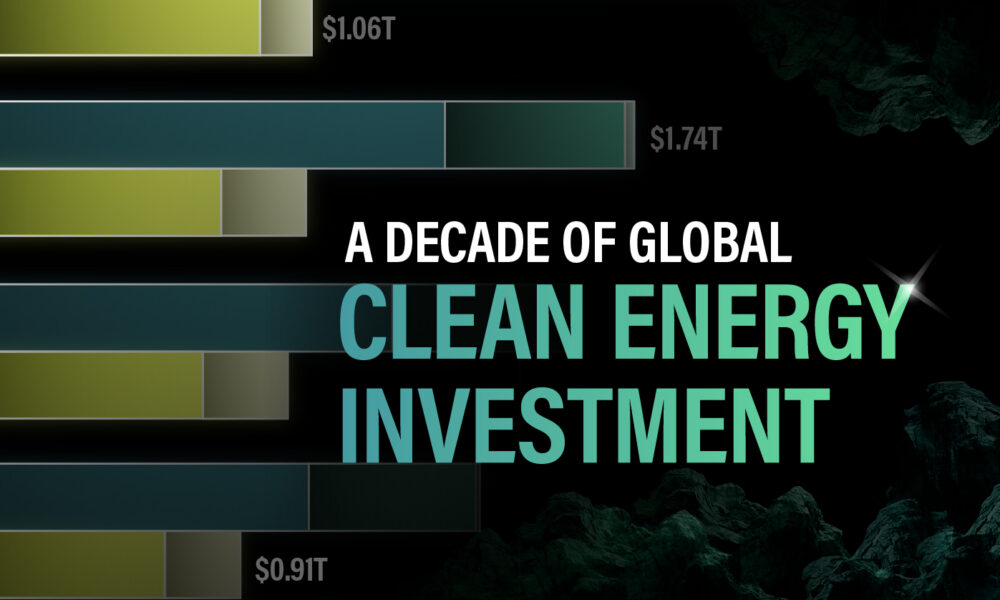
Visualized: A Decade of Clean Energy Investment
Global energy investment is growing every year. But recently, investments in clean energy have been significantly outpacing investments in fossil fuels.
For this graphic, we partnered with EnergyX to explore how global energy investment has changed and learn how investments in clean energy are starting to pay off for their investors.
The Rise of Sustainable Energy Investment
Propelled by various climate initiatives such as the Paris Agreement and the widespread adoption of EVs, global investment in sustainable energy surged to over $1.7 trillion in 2023, the highest ever, and the IEA projects that this growth could continue:
| Energy Product | 2020 | 2021 | 2022 | 2023 | 2030F |
|---|---|---|---|---|---|
| Clean Electrification | $0.97T | $1.05 | $1.21T | $1.34T | $1.65T |
| Low-Emission Fuels | $0.01T | $0.01 | $0.01T | $0.02T | $0.05T |
| Energy Efficiency | $0.28T | $0.35 | $0.39T | $0.38T | $0.49T |
| Clean Energy Total | $1.26T | $1.41T | $1.61T | $1.74T | $2.19T |
| Natural Gas | $0.26T | $0.27T | $0.31T | $0.32T | $0.35T |
| Oil | $0.42T | $0.48T | $0.52T | $0.55T | $0.60T |
| Coal | $0.16T | $0.16T | $0.18T | $0.18T | $0.11T |
| Fossil Fuel Total | $0.84T | $0.91T | $1.01T | $1.05T | $1.06T |
| Total Energy Investment | $2.10T | $2.32T | $2.62T | $2.79T | $3.25T |

Between 2020 and 2030, global investment in sustainable energy could increase by 74% to nearly $2.2 trillion, compared to just 26% additional investment in fossil fuels, with a forecast total of $1.06 trillion. This shows that sustainability is the future of energy investment.
Sustainable Investor Success Stories
While the growing investments in clean energy show that the world embraces sustainability, energy investors will still look for decent returns. Now, in 2024, clean energy investments are beginning to bear fruit. Here are just a few examples:
- Between 2019 and 2023, Tesla had a cumulative return of 1,073%
- NextEra Energy’s quarterly dividend increased by over 10% as of February 2024
- Investors in EnergyX have 10x’ed their investments since the company’s first offering in 2021
Lithium plays a critical role in powering electric vehicles (EVs) and facilitating the transition to sustainable energy. EnergyX has patented technology that enhances lithium extraction rates by up to 300%, contributing to meeting the growing demand for lithium and fueling the EVs of the future.

Energy Shift
Ranked: The World’s Largest Lithium Producers in 2023
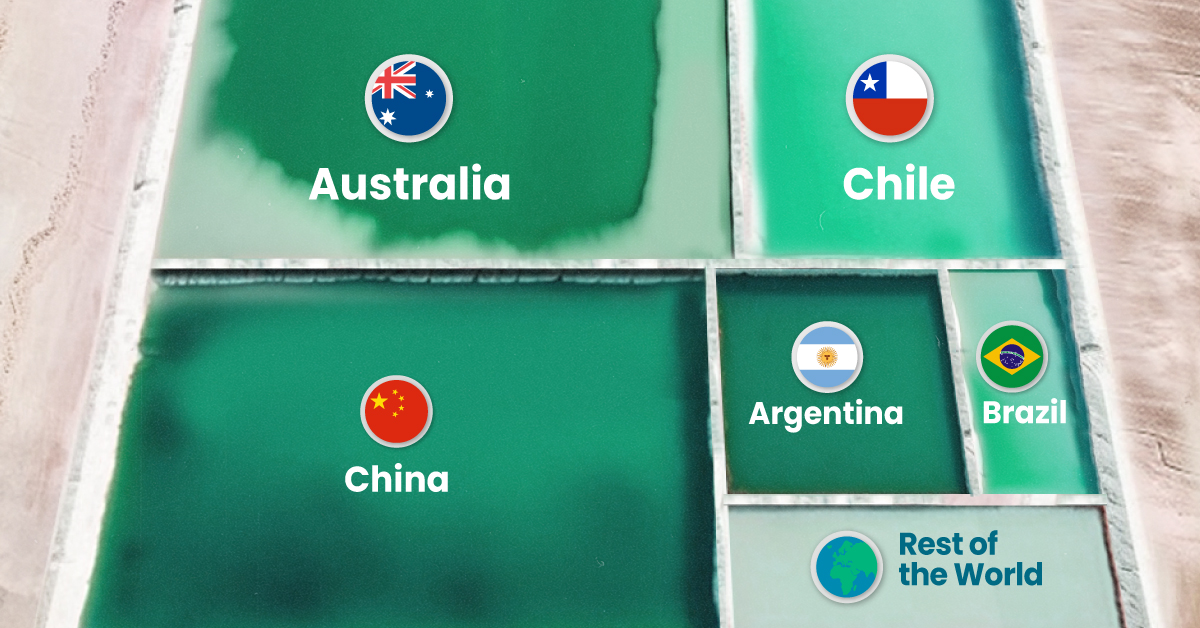
Three countries account for almost 90% of the lithium produced in the world.
The World’s Largest Lithium Producers in 2023
This was originally posted on our Voronoi app. Download the app for free on iOS or Android and discover incredible data-driven charts from a variety of trusted sources.
Three countries—Australia, Chile, and China—accounted for 88% of lithium production in 2023.
In this graphic, we list the world’s leading countries in terms of lithium production. These figures come from the latest USGS publication on lithium statistics (published Jan 2024).
Australia Leads, China Approaches Chile
Australia, the world’s leading producer, extracts lithium directly from hard-rock mines, specifically the mineral spodumene.
The country saw a big jump in output over the last decade. In 2013, Australia produced 13,000 metric tons of lithium, compared to 86,000 metric tons in 2023.
| Country | Lithium production 2023E (metric tons) |
|---|---|
| 🇦🇺 Australia | 86,000 |
| 🇨🇱 Chile | 44,000 |
| 🇨🇳 China | 33,000 |
| 🇦🇷 Argentina | 9,600 |
| 🇧🇷 Brazil | 4,900 |
| 🇨🇦 Canada | 3,400 |
| 🇿🇼 Zimbabwe | 3,400 |
| 🇵🇹 Portugal | 380 |
| 🌍 World Total | 184,680 |
Chile is second in rank but with more modest growth. Chilean production rose from 13,500 metric tons in 2013 to 44,000 metric tons in 2023. Contrary to Australia, the South American country extracts lithium from brine.
China, which also produces lithium from brine, has been approaching Chile over the years. The country increased its domestic production from 4,000 metric tons in 2013 to 33,000 last year.
Chinese companies have also increased their ownership shares in lithium producers around the globe; three Chinese companies are also among the top lithium mining companies. The biggest, Tianqi Lithium, has a significant stake in Greenbushes, the world’s biggest hard-rock lithium mine in Australia.
Argentina, the fourth country on our list, more than tripled its production over the last decade and has received investments from other countries to increase its output.
With all the top producers increasing output to cover the demand from the clean energy industry, especially for electric vehicle (EV) batteries, the lithium market has seen a surplus recently, which caused prices to collapse by more than 80% from a late-2022 record high.

-

 Electrification3 years ago
Ranked: The Top 10 EV Battery Manufacturers
-

 Electrification2 years ago
The Key Minerals in an EV Battery
-

 Real Assets3 years ago
The World’s Top 10 Gold Mining Companies
-

 Electrification3 years ago
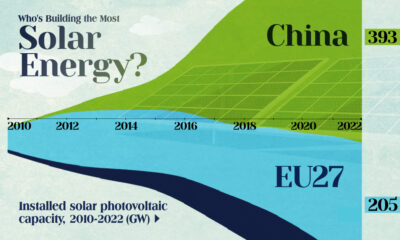
Mapped: Solar Power by Country in 2021
-

 Misc3 years ago
All the Metals We Mined in One Visualization
-

 Energy Shift2 years ago
What Are the Five Major Types of Renewable Energy?
-

 Electrification2 years ago
The World’s Largest Nickel Mining Companies
-

 Misc3 years ago
The Largest Copper Mines in the World by Capacity