
Right on top of the debate about the age of our Presidential candidates dropped the Congressional Budget Office’s (CBO) latest projections forecasting the country’s budget deficits through 2034, highlighting the impact of the extraordinary costs of healthcare on an aging population. An estimated 35% of government expenditures over the next ten years will be on Medicare and other healthcare costs. Social security will account for a further 28%.
Specifically, the CBO projects that budget deficits will increase to $2.6 trillion by 2034, up from $1.7 trillion this past year. On a nominal basis, federal spending will increase to $10.1 trillion by 2034 as compared to $6.4 trillion in 2024. In 2023, the Treasury Department issued $23 trillion of bonds at a time when interest rates spiked 500 basis points and ended the year with a record $26 trillion of federal debt. Given the more expensive cost of capital, interest will double from $870 billion this year to $1.6 trillion in ten years and will have generated $1.1 trillion of incremental interest costs versus earlier projections. Over those ten years, interest will account for 21% of federal spending, just behind Medicare at 25%. This year interest expense is expected to be 3.1% of GDP with total debt at just under 100% of GDP.
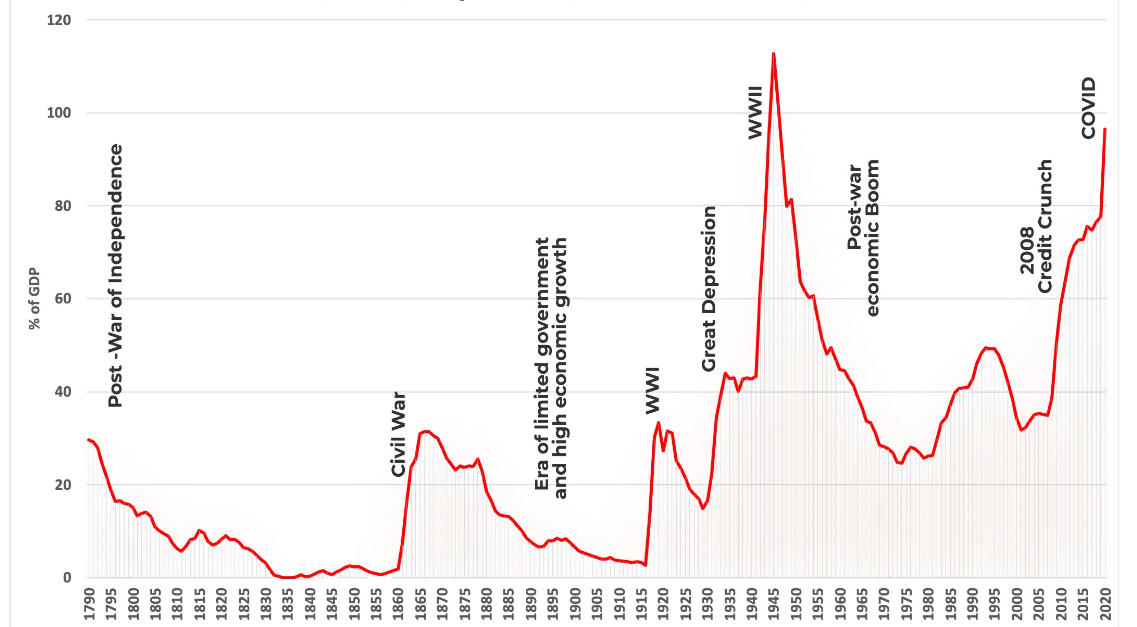
Source: St. Louis Federal Reserve.
While the debt burden was spiking prior to the pandemic, it is notable that it was a healthcare crisis that created such widespread economic concerns. Notwithstanding that, with near zero cost of capital and significant liquidity, asset valuations surged earlier this decade somewhat obfuscating debt concerns. The S&P 500 Index gained 35% from December 2019 to December 2021 and housing’s real return was nearly 20%.
The “wealth effect” coupled with very real health risk concerns played havoc with analysts’ population models. The labor force participation rate for those 65+ dropped meaningfully, leading the Federal Reserve Bank to conclude there were 3.27 million “excess retirees” at the end of 2022. While the reduction of this highly skilled labor force risks overall U.S. economic productivity, it also puts the issue of medical debt in the spotlight.
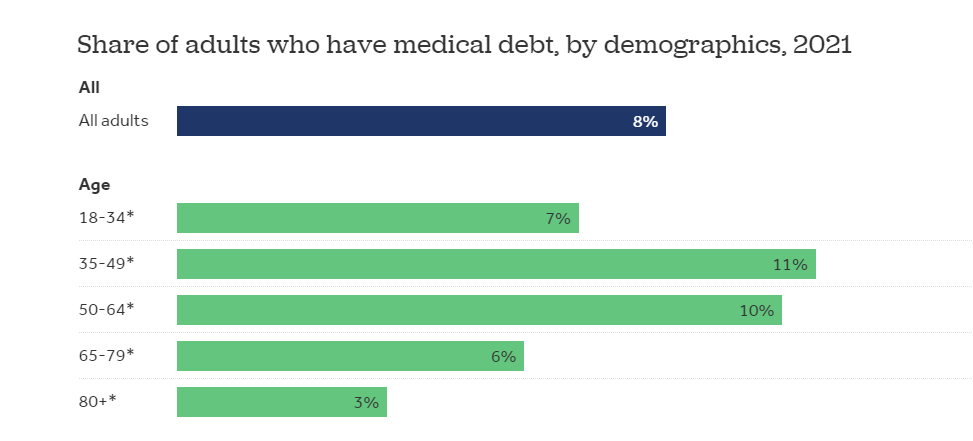
Approximately 17.7% of the U.S. population is over 65 years old and getting older. Furthermore, while 90% of Americans have some type of health insurance, the Census Bureau in 2021 estimated that 15% of households have medical debt. Nearly 20 million people (approximately one in twelve) are managing an estimated $220 billion of such debt, which happens to be ~5% of annual healthcare expenditures (or the GDP of Greece or Kazakhstan). Per the Consumer Financial Protection Bureau, there is $88 billion of medical debt listed on credit reports. Much of this is likely due to the increased popularity of “skinny” insurance plans and cost-shifting to the patient via greater out-of-pocket copays.
As a point of comparison, the Federal Reserve determined that there were 43.2 million Americans who owed $1.73 trillion in student loan debt at the end of 2023.
The Medicaid and CHIP Payment and Access Commission determined that U.S. hospitals incurred $28 billion in charity care costs in 2019, while the American Hospital Association reported that in 2020 all tax-exempt hospitals delivered $130 billion in “total benefits to their communities.” Definitive Healthcare concluded that bad debt held by U.S. hospitals is greater than $50 billion. The total debt held by patients plus written off by providers each year is a staggering sum, likely running toward $1 billion each day.
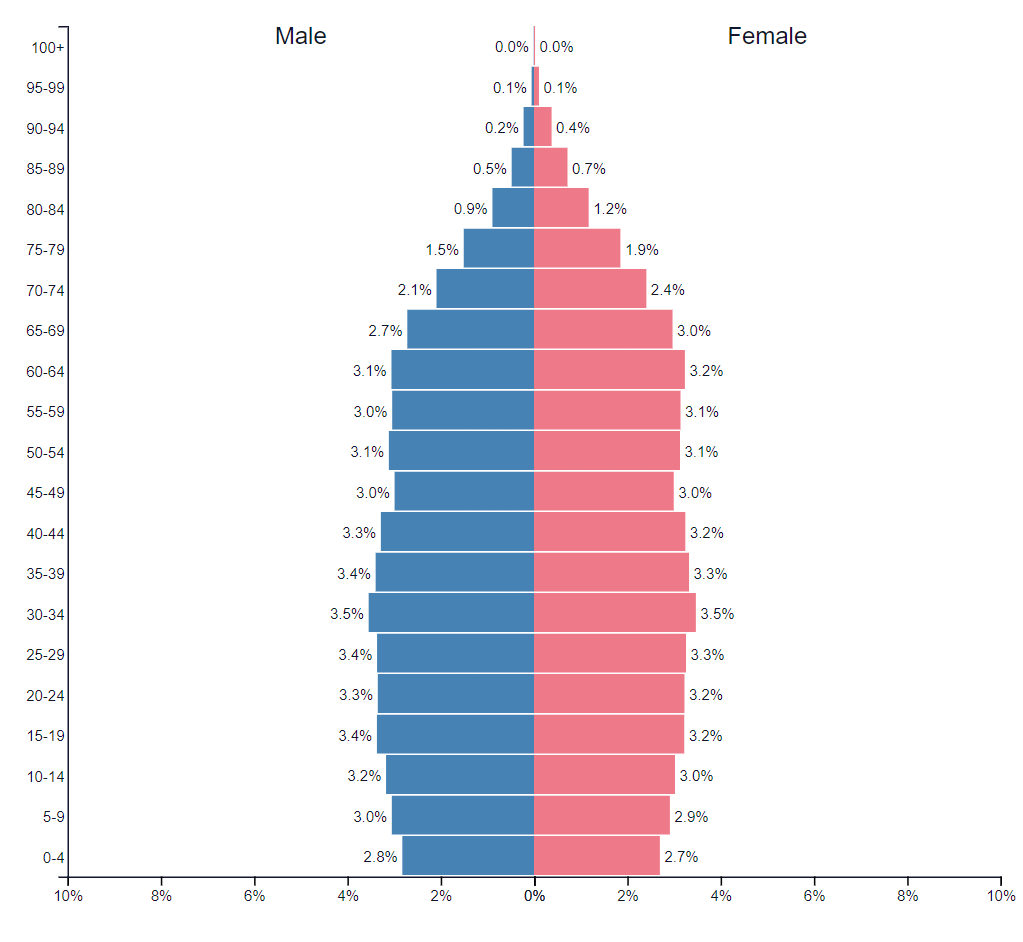
Source: PopulationPyramid.Net
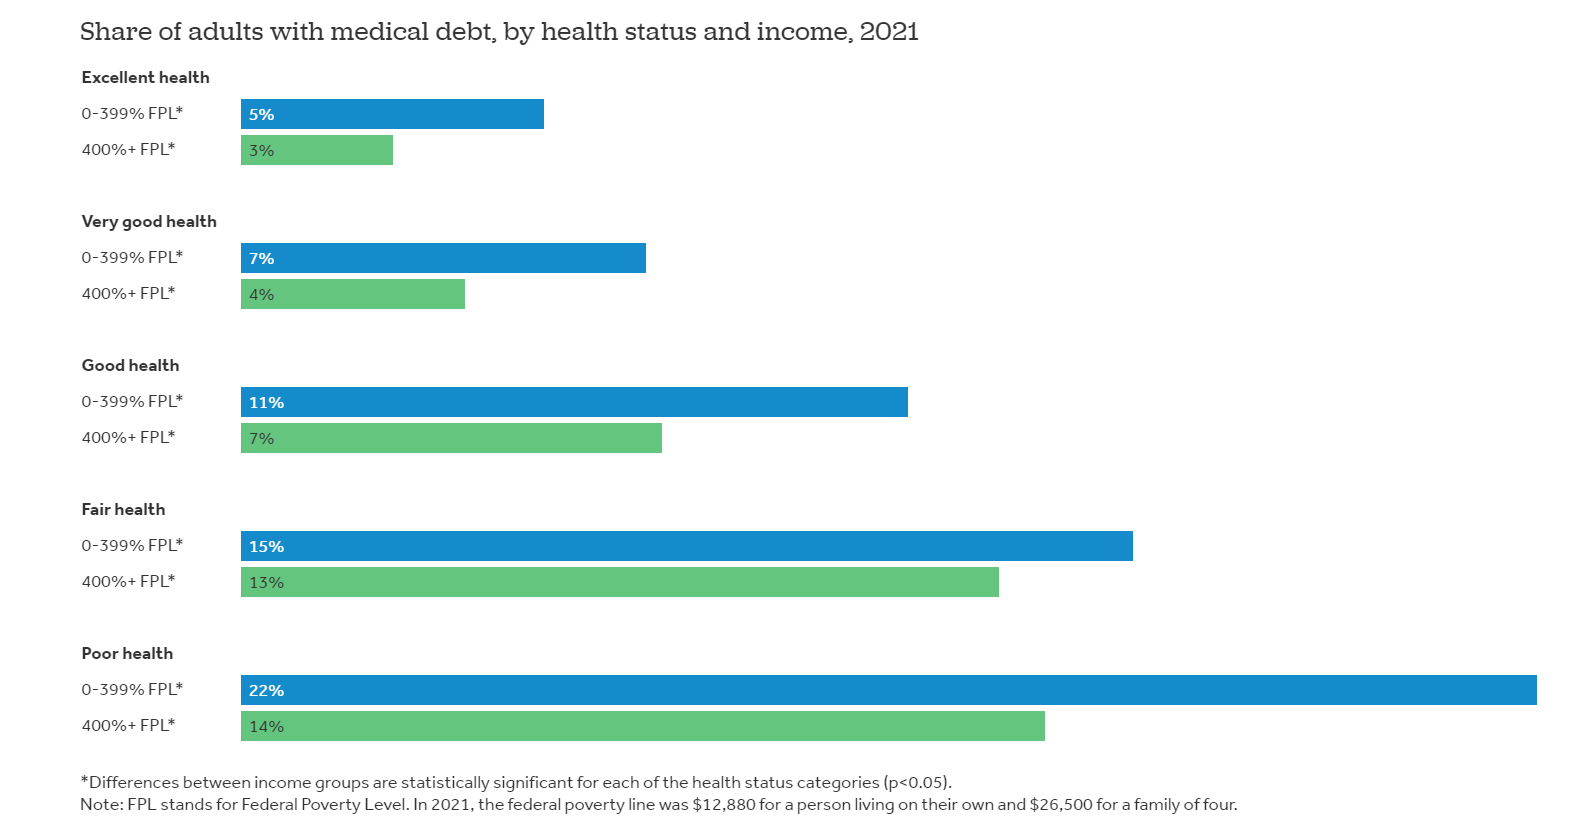
The burden of medical debt is disproportionately borne by those in poor health. According to the recent Health System Tracker survey by Peterson – KFF, adults with relatively high income but in poor health are more likely to have medical debt than those in good health but lower income levels. The Federal Poverty Line (FPL) in 2021 was set at $12.9k for a single adult and $26.5k for a family of four. For those in poor health and below 4x the FPL there was an incidence of 22% of medical debt, while only 3% of those greater than 4x the FPL and in excellent health had medical debt. In each stratum of health status, those below 4x the FPL had a greater medical debt load reflecting the scourge of income inequality.
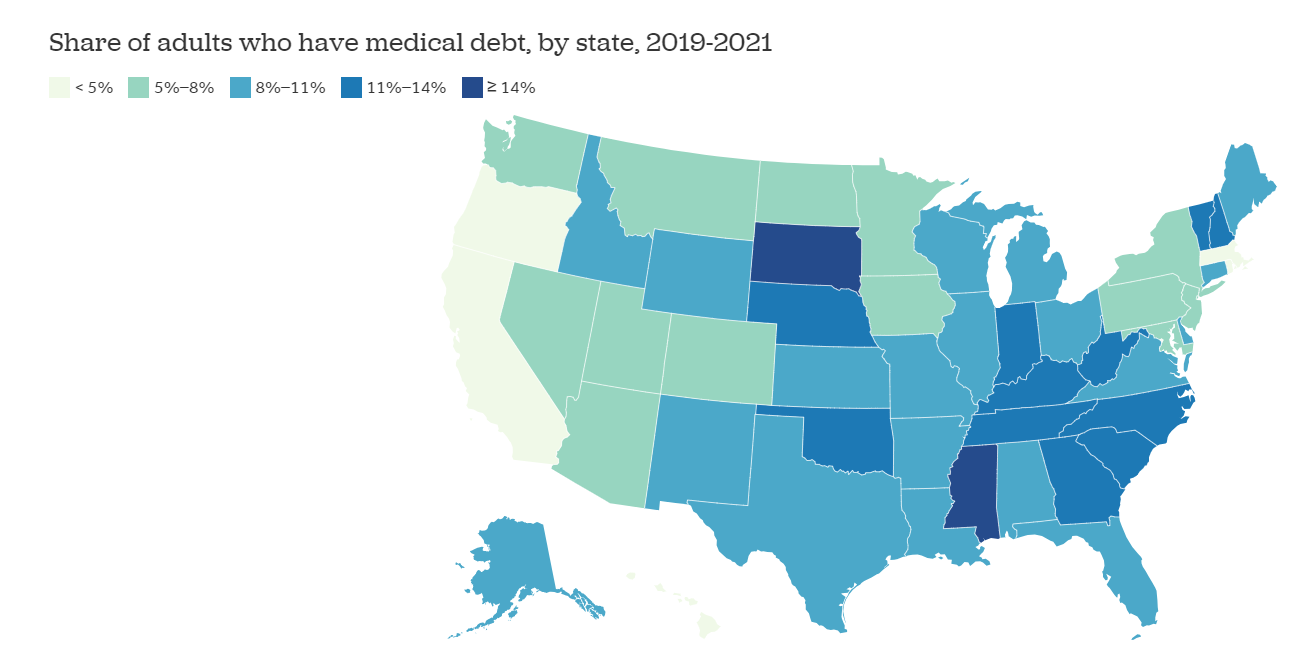
Interestingly, the level of medical debt quite clearly varies by state, with a clustering of those with a greater debt burden in the Southeast. While undoubtedly the reasons for this are numerous and complex, public policies that look to curtail public health benefits and limit Medicaid rolls arguably have shifted some portion of healthcare costs onto the individual. Residents in metro areas had an 8% incidence of medical debt while non-metro residents were at 11%. Nearly 18% of South Dakota residents had medical debt while only 2.3% of Hawaiians did.
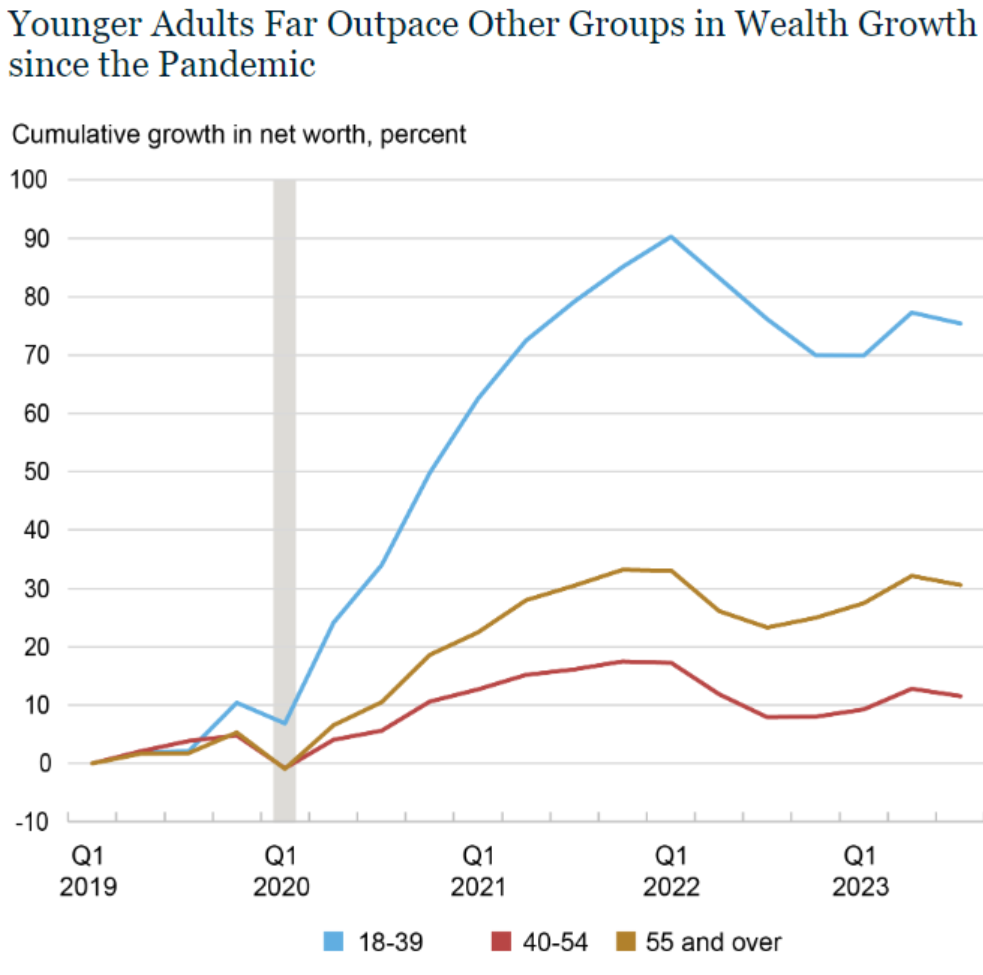
An analysis by age cohort concluded that 11% of those between 35 – 49 had medical debt and that the incidence of medical debt declined with age. It is well-understood that income and wealth has tended to be concentrated with older generations – those over 54 years old accounted for 71.6% of the nation’s wealth. Just prior to the pandemic, 37% of the U.S. population was under 40 years old yet only accounted for only 4.9% of the country’s wealth; as of 3Q23, they accounted for 6.6%. According to a recent analysis by the Federal Reserve, U.S. household net worth was approximately $151 trillion at the end of 3Q23, with median household net worth being $162k. The top decile was $1.56 million while tragically the bottom decile had no net worth.
Surprisingly, though, since the pandemic the younger generations have seen an acceleration in their rate of wealth creation. There is some speculation that this may be due to a greater reliance on their parents for housing and their health benefits through a parent’s employer. A recent analysis by Barron’s concluded that the 55 – 64 age cohort is working more and staying employed longer as compared to before the pandemic, delaying retirement, because of inflated costs due to healthcare and other family considerations. The hope is that the younger generations will be better able to manage the inevitable medical expenditures that come with aging.
Source: Board of Governors of the Federal Reserve System.
Sadly, though, according to a recent Montclair State University study, Gen Zers (12 – 27 years old) are experiencing the world as more dangerous and are notably more anxious. This has been attributed to health concerns surrounding Covid and the opioid epidemic, as well as the level of student debt, climate concerns, and hateful social media.

The map of the U.S. shows that the share of medical debt is highest in the very red states and lowest in the two most progressive states, CA and MA, and also low in most relatively liberal states. Yet, older people (of which I am one but live in CA) seem to vote for the governments in red states that do not support the HC systems in those states. Why do people vote against their clear self-interests?
Fantastic post and data. Thank you for sharing it!