Ensuring Reliability and Scalability at Binance: The Role of Capacity Management and Automatic Load Testing
Main Takeaways
Binance leverages capacity management for unplanned traffic surges caused by high volatility, ensuring adequate, timely infrastructure and computing resources for business demands.
Binance load tests in the production environment (rather than a staging environment) to get accurate service benchmarks. This method helps validate that our resource allocation is adequate to serve a defined load.
Binance’s infrastructure deals with large amounts of traffic, and maintaining a service that users can depend on requires proper capacity management and automatic load testing.

Why Does Binance Need a Specialized Capacity Management Process?
Capacity management is a bedrock of system stability. It entails right-sizing application and infrastructure resources with current and future business demands at the correct cost. To help achieve this goal, we build capacity management tools and pipelines to avoid overload and help businesses provide a smooth user experience.
Cryptocurrency markets often deal with more regular periods of volatility than traditional financial markets. This means Binance’s system must withstand this surge of traffic from time to time as users react to market movements. With proper capacity management, we keep capacity adequate for general business demand and these surge traffic scenarios. This key point is exactly what makes Binance’s capacity management processes unique and challenging.
Let’s look at the factors that often hinder the process and lead to a slow or unavailable service. First, we have overload, usually caused by a sudden increase in traffic. For example, this could result from a marketing event, a push notification, or even a DDoS (distributed denial of service) attack.
Surge traffic and insufficient capacity affect system functionality as:
The service takes on more and more work.
The response time increases to the point that no request can be responded to within the client’s timeout. This degradation usually happens because of resource saturation (CPU, memory, IO, network, etc.) or prolonged GC pauses in the service itself or its dependencies.
The result is that the service won’t be able to process requests promptly.
Breaking down the process
Now that we’ve discussed the general principle of capacity management let’s look at how Binance applies this to its business. Here’s a glance at the architecture for our capacity management system with some key workflows.
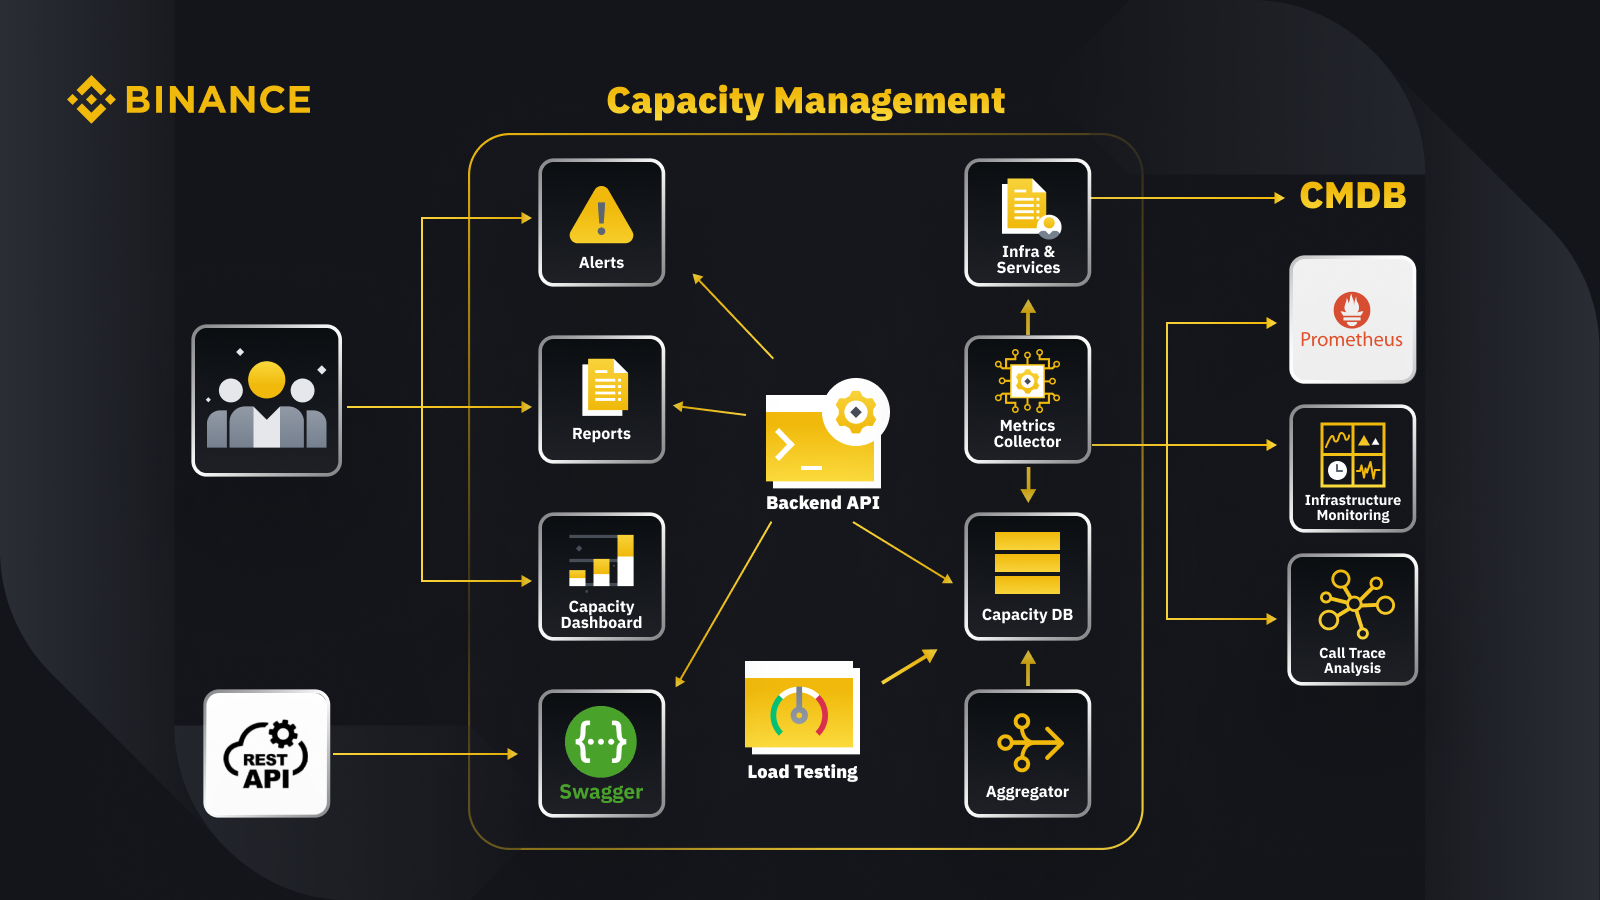
By fetching data from the configuration management database (CMDB), we generate the infra & services configurations. The items in these configurations are the capacity management objects.
The metrics collector fetches capacity metrics from Prometheus for the business and service layer data, Infrastructure Monitoring for resource layer metrics, and the call trace analysis system for trace information. The metrics collector stores the data in the capacity database (CDB).
The load testing system performs stress tests on the services and stores the benchmark data in the CDB.
The aggregator gets the capacity data from CDB and aggregates it for daily and all-time-high (ATH) dimensions. After aggregation, it writes the aggregated data back into the CDB.
By processing the data from the CDB, the backend API provides interfaces for the capacity dashboard, alerts, and reports, as well as the rest API and related capacity data for integration.
Stakeholders get insights on capacity through the capacity dashboard, alerts, and reports. They can also use other related systems, including monitoring get services’ capacity data with rest API provided by the capacity management system with Swagger.
Strategy
Our capacity management and planning strategy relies on peak-driven processing. Peak-driven processing is the workload experienced by a service’s resources (web servers, databases, etc.) during peak usage.
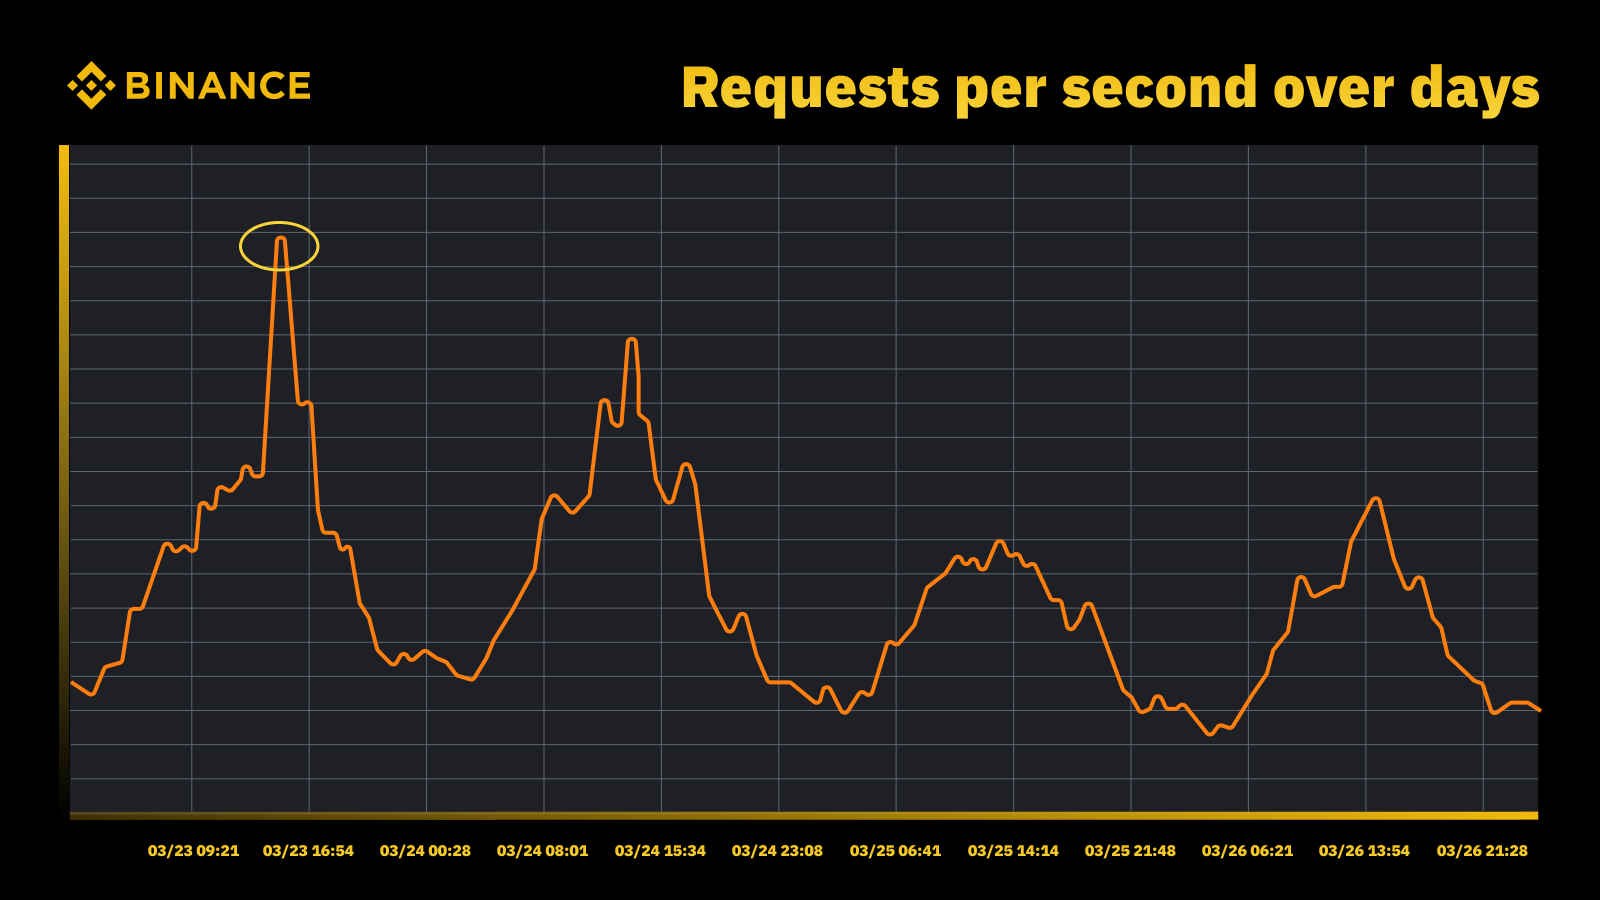
Traffic surge when Fed raised the rate in March, 2023
We analyze the periodic peaks and use them to drive the capacity trajectory. As with any peak-driven resource, we want to find out when the peaks occur and then explore what’s actually going on during those cycles.
Another important thing we consider along with preventing overload is autoscaling. Autoscaling handles overload by dynamically increasing capacity with more instances of the service. Excess traffic is then distributed, and the traffic a single instance of the service (or dependency) handles remains manageable.
Autoscaling has its place but falls short in handling overload situations alone. It usually can’t react fast enough to a sudden increase in traffic and only works best when there is a gradual increase.
Measurement
Measurement plays a crucial role in Binance’s capacity management work, and collecting data is our first measurement step. Based on the Information Technology Infrastructure Library (ITIL) standards, we collect data for measurement in the capacity management sub-processes, namely:
Resource - IT infrastructure resource consumption driven by application/service usage. Focuses on internal performance metrics of physical and virtual computing resources, including server CPU, memory, disk storage, network bandwidth, etc.
Service. The application level performance, SLA, latency, and throughput measures that arise from business activities. Focuses on external performance metrics based on how users perceive the service, including service latency, throughput, peaks, etc.
Business. Collects data that measure the business activities processed by the target application, including orders, user registration, payments, etc.
Capacity management based on only infrastructure resource utilization will lead to inaccurate planning. This is because it may not represent the actual business volumes and throughput driving our infrastructure capacity.
Scheduled events provide an excellent place to discuss this further. Take the Watch Web Summit 2022 on Binance Live to Share Up to 15,000 BUSD in Crypto Box Rewards campaign. Apart from the underlying resource and service layer metrics, we also needed to consider business volumes. We based capacity planning here on business metrics like the estimated number of live stream viewers, max in-flight requests for a Crypto Box, end-to-end latency, and other factors.
After collecting data, our capacity management processes aggregate and summarize the numerous data points collected against a specific capacity driver. The aggregated value of a metric is a single value that can be used in capacity alerting, reporting, and other capacity-related functions.
We can apply several data aggregation methods to periodic data points, like sum, average, median, minimum, maximum, percentile, and all-time-high (ATH).

Our chosen method determines our outputs from the capacity management process and resulting decisions. We select different methods based on different scenarios. For example, we use the maximum method for critical services and related data points. To record the highest traffic, we use the ATH method.
For different use cases, we use different granularity types for data aggregation. In most cases, we use either minute, hour, day, or ATH.
With minute granularity, we measure the workload of a service for timely overload alerting.
We use hourly aggregated data to build up daily data and aggregate the hourly data to record the daily peak.
Typically we use daily data for capacity reports and leverage ATH data for capacity modeling and planning.
One of capacity management’s core metrics is service benchmarking. This helps us accurately measure service performance and capacity. We obtain the service benchmark with load testing, and we’ll dive into this in more detail later.
Capacity Management Based On Priority
So far, we’ve seen how we collect capacity metrics and aggregate data in different granularity types. Another critical area to discuss is priority, which is helpful in the context of alerting and capacity reports. After ranking IT assets, limited infrastructure usage and computing resources are prioritized and given to critical services and activities first.
There can be a number of ways to define service and request criticality. A useful reference is Google. In the SRE book. They define the levels of criticality as CRITICAL_PLUS, CRITICAL, SHEDDABLE_PLUS etc. Similarly, we define multiple levels of priority such as P0, P1, P2 and so on.
We define the levels of priority as follows:
P0: For the most critical services and requests, those that will result in a serious, user-visible impact if they fail.
P1: For those services and requests that will result in user-visible impact, but the impact is less than those of P0. P0 and P1 services are expected to be provisioned with enough capacity.
P2: This is the default priority for batch jobs and offline jobs. These services and requests may not result in a user-visible impact if they are partially unavailable.
What Is Load Testing, and Why Do We Use It in a Production Environment?
Load testing is a non-functional software testing process where an application’s performance is tested under a specific workload. This helps determine how the application behaves while being accessed by multiple end-users simultaneously.
At Binance, we created a solution to enable us to run load testing in production. Typically, load testing is run in a staging environment, but we couldn’t use this option based on our overall capacity management goals. Load testing in a production environment allowed us to:
Collect an accurate benchmark of our services under real-life load conditions.
Increase confidence in the system and its reliability and performance.
Identify bottlenecks in the system before they happen in the production environment.
Enable continuous monitoring of production environments.
Enable proactive capacity management with normalized testing cycles that happen regularly.
Below you can see our load testing framework with some key takeaways:

Binance’s microservice framework has a base layer to support config-driven and flag-based traffic routing, which is essential for our TIP approach.
Automated canary analysis (ACA) is adopted to assess the instance we’re testing. It compares key metrics collected in the monitoring system, so we can pause/terminate the test if any unexpected issue happens to minimize user impacts.
Benchmarks and metrics are collected during load testing to generate data insights regarding behaviors and application performances.
APIs are exposed to share valuable performance data in various scenarios, for example, capacity management and quality assurance. This helps build up an open ecosystem.
We create automation workflows to orchestrate all steps and control points from an end-to-end testing perspective. We also provide the flexibility of integrating with other systems, such as the CI/CD pipeline and operation portal.
Our testing in production (TIP) approach
A traditional performance testing approach (running tests in a staging environment with simulated or mirrored traffic) does provide some benefits. However, deploying a production-like staging environment has more drawbacks in our context:
It almost doubles the infrastructure cost and maintenance efforts.
It is incredibly complex to get the end-to-end working in production, especially in a large-scale microservice environment across multiple business units.
It adds more data privacy and security risks as, inevitably, we may need to duplicate data in the staging.
Simulated traffic will never replicate what actually happens in production. The benchmark obtained in the staging environment would be inaccurate and has less value
Testing in production, also known as TIP, is a shift-right testing methodology where new code, features, and releases are tested in the production environment. The load testing in production we adopted is highly beneficial as it helps us:
Analyze the system’s stability and robustness.
Discover benchmarks and bottlenecks of applications under varying levels of traffic, server specs, and application parameters.
FlowFlag-based routing
Our FlowFlag-based routing embedded in the microservice base framework is the foundation for making TIP possible. This is true for specific cases, including applications using Eureka service discovery for traffic distribution.
As illustrated in the diagram, The Binance web server as entry points labels some percent of traffic as specified in the configs with FlowFlag headers, during load test, we can select one host of a specific service and mark it as the target perf instance in the configs, then those labeled perf requests will be eventually routed to the perf instance when they reach the service for processing.
It is fully config-driven, and hot loading, we can easily adjust the percent of workload using automation without having to deploy a new release
It can be widely applied to most of our services, since the mechanism is a part of the gateway and base package
A single point of change also means easy rollback to reduce risks in production

While transforming our solution to be more cloud-native, we’re also exploring how we can build up a similar approach to support other traffic routing offered by public cloud providers or Kubernetes.
Automated canary analysis to minimize user impact risks
Canary deployment is a deployment strategy to reduce the risk of deploying a new software version into production. It typically involves deploying a new version of the software, called a canary release, to a small subset of users alongside the stable running version. We then split traffic between the two versions so that a portion of incoming requests is diverted to the canary.
The canary version’s quality is then assessed by so-called canary analysis. This compares key metrics that describe the behavior of the old and new versions. If there is significant metrics degradation, the canary is aborted, and all of the traffic is routed to the stable version to minimize the impact of unexpected behavior.
We use the same concept to build our automatic load testing solution. The solution uses the Kayenta platform for automated canary analysis (ACA) via Spinnaker to enable automated canary deployments. Our typical load test flow when following this method looks so:
Through the workflow, we incrementally add traffic load (e.g., 5%, 10%, 25%, 50%) to the target host as specified or until it reaches its breaking point.
Under each load, canary analysis is run repeatedly with Kayenta for some amount of time (e.g., 5 minutes) to compare key metrics of the tested host with the pre-load period as the baseline and the present post-load period as the experiment.
The comparison (canary config model) focuses on checking whether the target host:
Reaches resource constraints, e.g., CPU usage exceeds 90%.
Has a significant increase in failure metrics, e.g., error logs, HTTP exceptions, or rate limit rejects.
Has core application metrics are still reasonable, e.g., an HTTP latency of fewer than 2 seconds (customizable for each service)
For each analysis, Kayenta gives us a report to indicate the result, and the test terminates immediately upon failure.
This failure detection usually takes less than 30 seconds, significantly reducing the chance of impacting our end users’ experience.

Enabling Data Insights
It’s crucial to collect sufficient information about all processes and test executions previously described. The ultimate goal is to improve our system’s reliability and robustness, which is impossible without data insights.
An overall test summary captures the max load percent the host was able to handle, the peak CPU usage, and the QPS of the host. Based on that, it also estimates the instance count we may need to deploy to meet our capacity reservation, considering the services’ all-time-high QPS.
Other valuable information for analysis includes the software version, server spec, deployed count, and a link to the monitor dashboard where we can look back at what happened during the test.

A benchmark curve indicates how performance has changed over the last three months so we can discover any possible issues related to a specific application release.

CPU & QPS trends show how the CPU usage correlated with the request volume the server had to handle. This metric can help estimate server headrooms for incoming traffic growth.

API latency behavior captures how response time varies under different load conditions for the top five APIs. We can then optimize the system if needed at an individual API level.

API load distribution metrics help us understand how the API composition impacts service performance and give more insights into improvement areas.
Normalization and productization
As our system continues to grow and evolve, we’ll keep tracking and improving service stability and reliability. We’ll continue this through:
A regular and established load testing schedule for critical services.
Automatic load testing as part of our CI/CD pipelines.
Increased productization of the entire solution to prepare for large-scale adoption across the wider organization.
Limitations
There are some limitations to the current load test approach:
The FlowFlag-based routing is only applicable to our microservice framework. We are looking to expand the solution to more routing scenarios by leveraging the common weighted routing feature of cloud load balancers or a Kubernetes Ingress.
Since we base the test on real user traffic in production, we can’t perform feature tests against specific APIs or use cases. Also, for services with very low volume, the value would be limited as we may not be able to identify its bottleneck.
We perform these tests against individual services rather than covering end-to-end calling chains.
Test in production can sometimes impact real users if failures occur. Therefore we must have fault analysis and auto-rollback with full automation capabilities.
Closing Thoughts
It’s critical for us to think about surge traffic scenarios to prevent system overload and ensure their uptime. That’s why we’ve built the capacity management and load testing processes described throughout this article. To summarize:
Our capacity management is peak-driven and embedded in every service lifecycle stage, preventing overload with activities like measurement, setting up priority, alerting and capacity reports, etc. This ultimately is what makes Binance’s processes and needs unique compared to a typical capacity management situation.
The service benchmark obtained from load testing is the focal point of capacity management and planning. It accurately determines the infrastructure resource needed to support current and future business demands. This ultimately had to be performed in production with a unique, Binance-built solution that allowed us to meet our specific needs.
With all this put together, we hope you can see that good planning and thorough frameworks help create the service that Binancians know and enjoy.
References
Luis Quesada Torres, Doug Colish, SRE Best Practices for Capacity Management
Alejandro Forero Cuervo, Sarah Chavis, Google SRE book, Chapter 21 - Handling Overload