
Physik Invest’s Daily Brief is read by thousands of subscribers. You, too, can join this community to learn about the fundamental and technical drivers of markets.
Administrative
The plan was to have a talk about big geopolitical themes but, in tying some loose ends and keeping with the spirit of the options-induced armageddon narrative, we push this to next week. Have a great weekend!
Positioning
Despite maintaining that markets are potentially due for weakness, Kai Volatility’s Cem Karsan brought up some interesting points, yesterday.
Essentially, despite liquidity coming off the table and increased competition between equities and fixed income, hence big bond inflows and equity outflows, if the “market consolidates and doesn’t break,” the delta buy-back with respect to dropping implied volatility (IVOL) or vanna and buy-back with respect to the passage of time or charm could build a platform for a FOMO-driven call buying rally that ends in a blow-off.
The signs of this “more combustible situation” would likely show when “volatility is sticky into a rally,” adds Karsan. To gauge combustibility, look to the options market.
Remember calls trade at a lower IVOL than puts. As the market trades higher, it slides to a lower IVOL, and that’s reflected by broad IVOL measures. If broad IVOL measures are sticky/bid, “that’s an easy way to say that fixed-strike volatility is coming up and, if that can happen for days, that can unpin volatility and create a situation where dealers themselves are no longer [own] a ton of volatility; they start thinning out on volatility themselves, and that creates a more combustible situation.”
To explain the “thinning out” part of the last paragraph, recall participants often opt to own equity and downside (put) protection financed, in part, with sales of upside (call) protection. If there’s more demand for calls, that will result in counterparties taking on more exposure against movement (i.e., negative gamma) hedged via purchases of the underlying. Once that exposure expires and/or decays, that dealer-based support will be withdrawn. If the assumption is that equity markets are expensive now, then, after another rally, there may be more room to fall, all else equal (a simplistic way to look at this), hence the increased precariousness and combustibility.
Technical
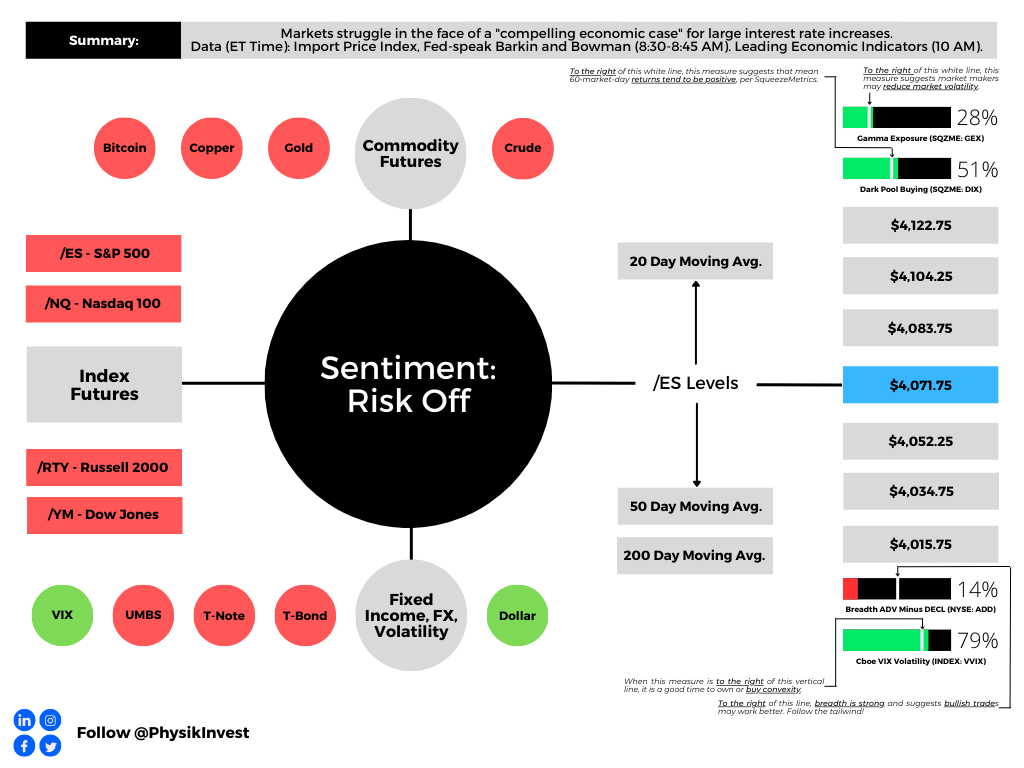
As of 6:30 AM ET, Friday’s regular session (9:30 AM – 4:00 PM ET), in the S&P 500, is likely to open in the lower part of a negatively skewed overnight inventory, far outside of the prior day’s range (i.e., a lot of shock and range expansion already happened), suggesting a higher than normal potential for immediate directional opportunity.
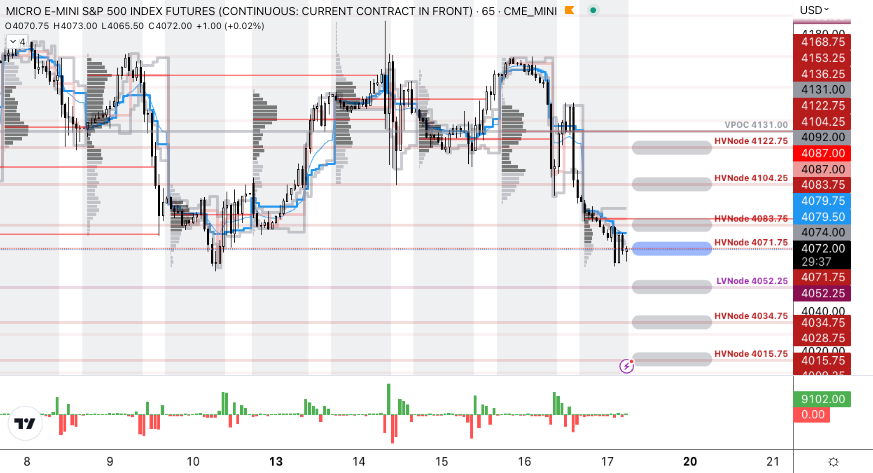
The S&P 500 pivot for today is $4,071.75.
Key levels to the upside include $4,083.75, $4,104.25, and $4,122.75.
Key levels to the downside include $4,052.25, $4,034.75, and $4,015.75.
Disclaimer: Click here to load the updated key levels via the web-based TradingView platform. New links are produced daily. Quoted levels likely hold barring an exogenous development.
Definitions
Volume Areas: Markets will build on areas of high-volume (HVNodes). Should the market trend for a period of time, this will be identified by a low-volume area (LVNodes). The LVNodes denote directional conviction and ought to offer support on any test.
If participants auction and find acceptance in an area of a prior LVNode, then future discovery ought to be volatile and quick as participants look to the nearest HVNodes for more favorable entry or exit.
Gamma: The sensitivity of an option’s Delta to changes in the underlying asset’s price.
Vanna: The rate at which the Delta of an option changes with respect to implied volatility.
Charm: The rate at which the Delta of an option changes with respect to time.
About
The author, Renato Leonard Capelj, works in finance and journalism.
Capelj spends the bulk of his time at Physik Invest, an entity through which he invests and publishes free daily analyses to thousands of subscribers. The analyses offer him and his subscribers a way to stay on the right side of the market. Separately, Capelj is an options analyst at SpotGamma and an accredited journalist.
Capelj’s past works include conversations with investor Kevin O’Leary, ARK Invest’s Catherine Wood, FTX’s Sam Bankman-Fried, Lithuania’s Minister of Economy and Innovation Aušrinė Armonaitė, former Cisco chairman and CEO John Chambers, and persons at the Clinton Global Initiative.
Connect
Direct queries to renato@physikinvest.com or find Physik Invest on Twitter, LinkedIn, Facebook, and Instagram.
Calendar
You may view this letter’s content calendar at this link.
Disclaimer
Do not construe this newsletter as advice. All content is for informational purposes.


One reply on “Daily Brief For February 17, 2023”
[…] last month’s remarks by Kai Volatility’s Cem Karsan, quoted in Physik Invest’s Daily Brief for February 17, 2023, if the market was to not breakdown sharply after February monthly options expiration (OpEx), as we […]