Economy
Visualizing All of China’s Trade Partners
Article/Editing:
Click to view this graphic in a higher-resolution.
Visualizing All of China’s Trade Partners
China stands as a formidable player in the global trade arena, wielding its influence as the world’s largest goods exporter.
With a complex network of trade partnerships spanning more than 200 countries, regions, and territories, the world’s second-largest economy has significant economic relationships with both allies and adversaries.
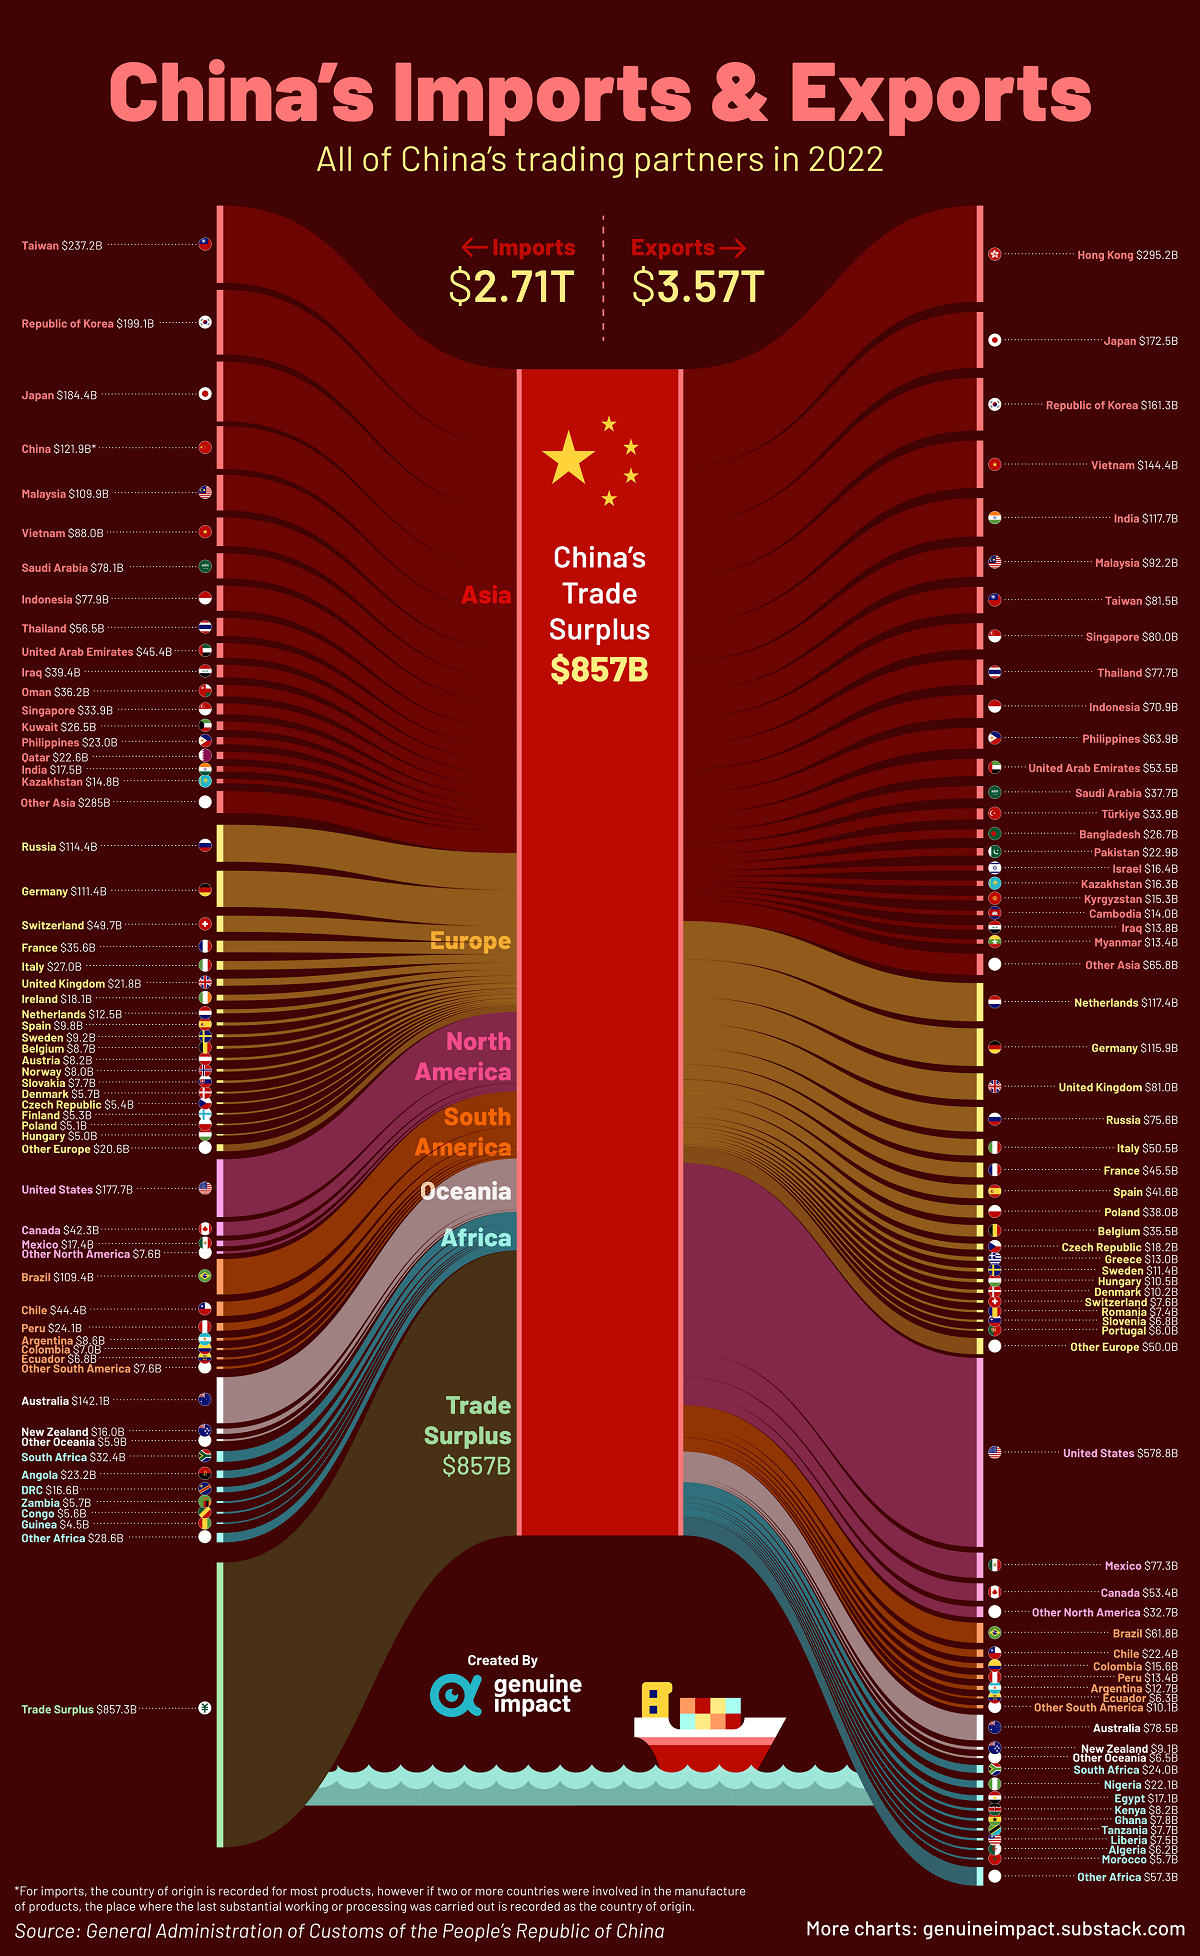
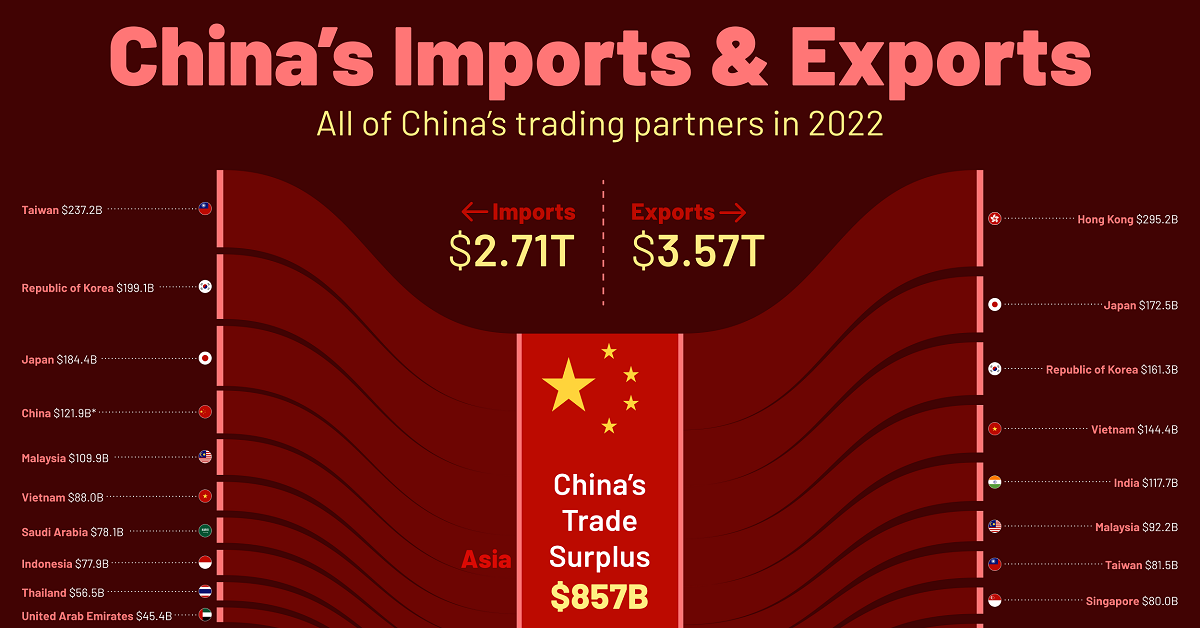
By using 2022 trade data from China’s General Administration of Customs, this visualization from Truman Du breaks down the nation’s top trading partners through imports and exports by destination.
China’s Imports and Exports by Country in 2022
Over the course of 2022, China saw exports totaling $3.57 trillion and imports totaling $2.71 trillion, giving it a massive trade surplus of $857 billion.
| Country | Imports (2022 USD) | Exports (2022 USD) | Balance (2022 USD) |
|---|---|---|---|
| 🇺🇸 United States | $177.7B | $578.8B | +$401.1B |
| 🇭🇰 Hong Kong | $7.8B | $295.2B | +$287.4B |
| 🇳🇱 Netherlands | $12.5B | $117.4B | +$104.9B |
| 🇮🇳 India | $17.5B | $117.7B | +$100.3B |
| 🇲🇽 Mexico | $17.4B | $77.3B | +$59.8B |
| 🇬🇧 United Kingdom | $21.8B | $81.0B | +$59.2B |
| 🇻🇳 Vietnam | $88.0B | $144.4B | +$56.4B |
| 🇸🇬 Singapore | $33.9B | $80.0B | +$46.1B |
| 🇵🇭 Philippines | $23.0B | $63.9B | +$40.9B |
| 🇵🇱 Poland | $5.1B | $38.0B | +$32.9B |
| 🇪🇸 Spain | $9.8B | $41.6B | +$31.9B |
| 🇹🇷 Türkiye | $4.5B | $33.9B | +$29.4B |
| 🇧🇪 Belgium | $8.7B | $35.5B | +$26.7B |
| 🇧🇩 Bangladesh | $1.0B | $26.7B | +$25.7B |
| 🇮🇹 Italy | $27.0B | $50.5B | +$23.6B |
| 🇹🇭 Thailand | $56.5B | $77.7B | +$21.1B |
| 🇳🇬 Nigeria | $1.6B | $22.1B | +$20.5B |
| 🇵🇰 Pakistan | $3.4B | $22.9B | +$19.5B |
| 🇪🇬 Egypt | $1.0B | $17.1B | +$16.0B |
| 🇰🇬 Kyrgyzstan | $0.1B | $15.3B | +$15.3B |
| 🇨🇿 Czechia | $5.4B | $18.2B | +$12.8B |
| 🇰🇭 Cambodia | $1.8B | $14.0B | +$12.2B |
| 🇬🇷 Greece | $0.8B | $12.9B | +$12.1B |
| 🇵🇦 Panama | $1.2B | $12.6B | +$11.4B |
| 🇨🇦 Canada | $42.3B | $53.4B | +$11.1B |
| 🇫🇷 France | $35.6B | $45.5B | +$9.9B |
| 🇨🇴 Colombia | $7.0B | $15.5B | +$8.5B |
| 🇦🇪 United Arab Emirates | $45.4B | $53.5B | +$8.1B |
| 🇰🇪 Kenya | $0.3B | $8.2B | +$7.9B |
| 🇱🇷 Liberia | $0.0B | $7.5B | +$7.5B |
| 🇮🇱 Israel | $9.0B | $16.4B | +$7.4B |
| 🇹🇿 Tanzania | $0.5B | $7.7B | +$7.1B |
| 🇸🇮 Slovenia | $0.6B | $6.8B | +$6.3B |
| 🇬🇭 Ghana | $2.3B | $7.8B | +$5.5B |
| 🇭🇺 Hungary | $5.0B | $10.5B | +$5.4B |
| 🇺🇿 Uzbekistan | $2.3B | $7.4B | +$5.1B |
| 🇩🇿 Algeria | $1.1B | $6.2B | +$5.1B |
| 🇯🇴 Jordan | $0.7B | $5.7B | +$4.9B |
| 🇲🇦 Morocco | $0.9B | $5.7B | +$4.8B |
| 🇩🇪 Germany | $111.4B | $115.9B | +$4.5B |
| 🇩🇰 Denmark | $5.7B | $10.2B | +$4.4B |
| 🇷🇴 Romania | $3.1B | $7.4B | +$4.3B |
| 🇦🇷 Argentina | $8.6B | $12.7B | +$4.1B |
| 🇲🇴 Macao | $0.1B | $4.2B | +$4.1B |
| 🇬🇹 Guatemala | $0.6B | $4.3B | +$3.8B |
| 🇩🇴 Dominican Republic | $0.5B | $4.3B | +$3.7B |
| 🇸🇳 Senegal | $0.3B | $4.0B | +$3.7B |
| 🇲🇭 Marshall Islands | $0.0B | $3.5B | +$3.5B |
| 🇱🇰 Sri Lanka | $0.5B | $3.7B | +$3.2B |
| 🇩🇯 Djibouti | $0.1B | $3.2B | +$3.1B |
| 🇮🇷 Iran | $6.4B | $9.4B | +$3.0B |
| 🇹🇬 Togo | $0.2B | $3.1B | +$2.9B |
| 🇵🇹 Portugal | $3.0B | $6.0B | +$2.9B |
| 🇨🇮 Cote d'Ivoire | $1.0B | $3.5B | +$2.5B |
| 🇨🇲 Cameroon | $0.7B | $3.1B | +$2.5B |
| 🇱🇧 Lebanon | $0.1B | $2.5B | +$2.4B |
| 🇸🇪 Sweden | $9.1B | $11.4B | +$2.2B |
| 🇻🇪 Venezuela | $0.8B | $3.0B | +$2.1B |
| 🇾🇪 Yemen | $0.6B | $2.8B | +$2.1B |
| 🇭🇷 Croatia | $0.2B | $2.3B | +$2.1B |
| 🇲🇿 Mozambique | $1.3B | $3.2B | +$1.9B |
| 🇲🇲 Myanmar | $11.5B | $13.4B | +$1.9B |
| 🇹🇯 Tajikistan | $0.4B | $2.2B | +$1.8B |
| 🇵🇾 Paraguay | $0.1B | $1.9B | +$1.8B |
| 🇪🇹 Ethiopia | $0.5B | $2.2B | +$1.8B |
| 🇱🇹 Lithuania | $0.1B | $1.8B | +$1.7B |
| 🇳🇵 Nepal | $0.0B | $1.6B | +$1.6B |
| 🇹🇳 Tunisia | $0.3B | $1.9B | +$1.6B |
| 🇧🇬 Bulgaria | $1.3B | $2.8B | +$1.6B |
| 🇭🇳 Honduras | $0.0B | $1.6B | +$1.5B |
| 🇧🇭 Bahrain | $0.3B | $1.8B | +$1.5B |
| 🇰🇿 Kazakhstan | $14.8B | $16.3B | +$1.5B |
| 🇧🇾 Belarus | $1.8B | $3.2B | +$1.4B |
| 🇧🇯 Benin | $0.3B | $1.7B | +$1.4B |
| 🇸🇻 El Salvador | $0.2B | $1.7B | +$1.4B |
| 🇲🇹 Malta | $0.6B | $2.0B | +$1.4B |
| 🇸🇩 Sudan | $0.9B | $2.0B | +$1.1B |
| 🇨🇾 Cyprus | $0.0B | $1.2B | +$1.1B |
| 🇬🇪 Georgia | $0.1B | $1.2B | +$1.1B |
| 🇸🇴 Somalia | $0.0B | $1.0B | +$1.0B |
| 🇦🇿 Azerbaijan | $0.1B | $1.1B | +$1.0B |
| 🇯🇲 Jamaica | $0.0B | $1.0B | +$1.0B |
| 🇺🇬 Uganda | $0.1B | $1.1B | +$1.0B |
| 🇲🇺 Mauritius | $0.0B | $1.0B | +$0.9B |
| 🇷🇸 Serbia | $1.4B | $2.2B | +$0.8B |
| 🇲🇬 Madagascar | $0.6B | $1.4B | +$0.8B |
| 🇰🇵 Korea, DPR | $0.1B | $0.8B | +$0.7B |
| 🇳🇮 Nicaragua | $0.0B | $0.7B | +$0.7B |
| 🇪🇪 Estonia | $0.3B | $0.9B | +$0.7B |
| 🇱🇻 Latvia | $0.4B | $1.0B | +$0.6B |
| 🇭🇹 Haiti | $0.0B | $0.6B | +$0.6B |
| 🇦🇱 Albania | $0.2B | $0.7B | +$0.5B |
| 🇦🇫 Afghanistan | $0.0B | $0.6B | +$0.5B |
| 🇲🇱 Mali | $0.1B | $0.6B | +$0.5B |
| 🇫🇯 Fiji | $0.0B | $0.5B | +$0.5B |
| 🇲🇻 Maldives | $0.0B | $0.4B | +$0.4B |
| 🇸🇾 Syria | $0.0B | $0.4B | +$0.4B |
| 🇬🇲 Gambia | $0.0B | $0.4B | +$0.4B |
| 🇧🇫 Burkina Faso | $0.1B | $0.5B | +$0.4B |
| 🇧🇸 Bahamas | $0.0B | $0.4B | +$0.4B |
| 🇳🇪 Niger | $0.3B | $0.7B | +$0.4B |
| 🇨🇷 Costa Rica | $2.0B | $2.4B | +$0.4B |
| 🇷🇼 Rwanda | $0.1B | $0.4B | +$0.3B |
| 🇧🇿 Belize | $0.0B | $0.3B | +$0.3B |
| 🇸🇷 Suriname | $0.0B | $0.3B | +$0.3B |
| 🇲🇼 Malawi | $0.0B | $0.3B | +$0.3B |
| 🇷🇪 Réunion | $0.0B | $0.2B | +$0.2B |
| 🇱🇺 Luxembourg | $0.3B | $0.5B | +$0.2B |
| 🇧🇴 Bolivia | $0.9B | $1.1B | +$0.2B |
| 🇲🇪 Montenegro | $0.0B | $0.2B | +$0.2B |
| 🇧🇹 Bhutan | $0.0B | $0.2B | +$0.2B |
| 🇵🇸 Palestine | $0.0B | $0.2B | +$0.2B |
| 🇵🇫 French Polynesia | $0.0B | $0.2B | +$0.1B |
| 🇹🇱 Timor-Leste | $0.1B | $0.3B | +$0.1B |
| 🇧🇧 Barbados | $0.0B | $0.2B | +$0.1B |
| 🇲🇩 Moldova | $0.1B | $0.2B | +$0.1B |
| 🇼🇸 Samoa | $0.0B | $0.1B | +$0.1B |
| 🇮🇸 Iceland | $0.2B | $0.3B | +$0.1B |
| 🇻🇬 British Virgin Islands | $0.0B | $0.1B | +$0.1B |
| 🇧🇮 Burundi | $0.0B | $0.1B | +$0.1B |
| 🌏 Other Oceanian Territories | $0.0B | $0.1B | +$0.1B |
| 🇦🇬 Antigua and Barbuda | $0.0B | $0.1B | +$0.1B |
| 🇸🇨 Seychelles | $0.0B | $0.1B | +$0.1B |
| 🇨🇻 Cabo Verde | $0.0B | $0.1B | +$0.1B |
| 🇻🇺 Vanuatu | $0.0B | $0.1B | +$0.1B |
| 🇧🇲 Bermuda | $0.0B | $0.1B | +$0.1B |
| 🇸🇿 Eswatini | $0.0B | $0.1B | +$0.1B |
| 🇬🇵 Guadeloupe | $0.0B | $0.1B | +$0.1B |
| 🇰🇲 Comoros | $0.0B | $0.1B | +$0.1B |
| 🇦🇼 Aruba | $0.0B | $0.1B | +$0.1B |
| 🇧🇦 Bosnia and Herzegovina | $0.1B | $0.2B | +$0.1B |
| 🇨🇼 Curaçao | $0.0B | $0.1B | +$0.1B |
| 🇾🇹 Mayotte | $0.0B | $0.1B | +$0.1B |
| 🇬🇼 Guinea-Bissau | $0.0B | $0.1B | +$0.1B |
| 🇹🇴 Tonga | $0.0B | $0.1B | +$0.1B |
| 🇲🇰 North Macedonia | $0.2B | $0.2B | +$0.1B |
| 🇰🇾 Cayman Islands | $0.0B | $0.1B | +$0.1B |
| 🌎 Other Latin American Territories | $0.0B | $0.1B | +$0.1B |
| 🇵🇼 Palau | $0.0B | $0.1B | +$0.1B |
| 🇲🇶 Martinique | $0.0B | $0.0B | +$0.0B |
| 🇰🇮 Kiribati | $0.0B | $0.0B | +$0.0B |
| 🇬🇫 French Guiana | $0.0B | $0.0B | +$0.0B |
| 🇱🇸 Lesotho | $0.0B | $0.1B | +$0.0B |
| 🇱🇨 Saint Lucia | $0.0B | $0.0B | +$0.0B |
| 🇩🇲 Dominica | $0.0B | $0.0B | +$0.0B |
| 🇹🇻 Tuvalu | $0.0B | $0.0B | +$0.0B |
| 🇫🇲 Federated States of Micronesia | $0.0B | $0.0B | +$0.0B |
| 🇨🇫 Central African Republic | $0.0B | $0.1B | +$0.0B |
| 🇧🇶 Bonaire, Sint Eustatius, and Saba | $0.0B | $0.0B | +$0.0B |
| 🇬🇩 Grenada | $0.0B | $0.0B | +$0.0B |
| 🇦🇩 Andorra | $0.0B | $0.0B | +$0.0B |
| 🇻🇨 Saint Vincent and the Grenadines | $0.0B | $0.0B | +$0.0B |
| 🇬🇮 Gibraltar | $0.0B | $0.0B | +$0.0B |
| 🇸🇹 Sao Tome and Principe | $0.0B | $0.0B | +$0.0B |
| 🌍 Other European Territories | $0.0B | $0.0B | +$0.0B |
| 🇰🇳 Saint Kitts and Nevis | $0.0B | $0.0B | +$0.0B |
| 🇳🇷 Nauru | $0.0B | $0.0B | +$0.0B |
| 🇨🇰 Cook Islands | $0.0B | $0.0B | +$0.0B |
| 🇹🇨 Turks and Caicos Islands | $0.0B | $0.0B | +$0.0B |
| 🇲🇫 Saint Martin | $0.0B | $0.0B | +$0.0B |
| 🌏 Other North American Territories | $0.0B | $0.0B | +$0.0B |
| 🇸🇲 San Marino | $0.0B | $0.0B | +$0.0B |
| 🌍 Other African Territories | $0.0B | $0.0B | +$0.0B |
| 🇮🇨 Canary Islands | $0.0B | $0.0B | +$0.0B |
| 🇼🇫 Wallis and Futuna | $0.0B | $0.0B | +$0.0B |
| 🇳🇫 Norfolk Island | $0.0B | $0.0B | +$0.0B |
| 🇪🇭 Western Sahara | $0.0B | $0.0B | +$0.0B |
| 🌏 Other Asian Territories | $0.0B | $0.0B | +$0.0B |
| 🇲🇸 Montserrat | $0.0B | $0.0B | +$0.0B |
| 🇪🇺 Ceuta | $0.0B | $0.0B | +$0.0B |
| 🇻🇦 Holy See | $0.0B | $0.0B | +$0.0B |
| 🇪🇺 Melilla | $0.0B | $0.0B | +$0.0B |
| 🇵🇲 Saint Pierre and Miquelon | $0.0B | $0.0B | +$0.0B |
| 🇧🇶 Bonaire | $0.0B | $0.0B | +$0.0B |
| 🇲🇨 Monaco | $0.0B | $0.0B | -$0.0B |
| 🇨🇺 Cuba | $0.5B | $0.4B | -$0.0B |
| 🇳🇦 Namibia | $0.6B | $0.6B | -$0.0B |
| 🇸🇸 South Sudan | $0.2B | $0.2B | -$-0.1B |
| 🇸🇧 Solomon Islands | $0.3B | $0.2B | -$-0.1B |
| 🇫🇴 Faroe Islands | $0.1B | $0.0B | -$-0.1B |
| 🇱🇮 Liechtenstein | $0.2B | $0.1B | -$-0.1B |
| 🇧🇼 Botswana | $0.4B | $0.2B | -$-0.2B |
| 🇿🇼 Zimbabwe | $1.3B | $1.1B | -$-0.2B |
| 🇸🇱 Sierra Leone | $0.8B | $0.6B | -$-0.2B |
| 🇹🇹 Trinidad and Tobago | $0.8B | $0.5B | -$-0.2B |
| 🇲🇷 Mauritania | $1.2B | $0.9B | -$-0.2B |
| 🇦🇲 Armenia | $0.8B | $0.5B | -$-0.3B |
| 🇪🇷 Eritrea | $0.5B | $0.1B | -$-0.3B |
| 🇵🇷 Puerto Rico | $1.3B | $1.0B | -$-0.3B |
| 🇬🇱 Greenland | $0.4B | $0.0B | -$-0.4B |
| 🇪🇨 Ecuador | $6.8B | $6.3B | -$-0.6B |
| 🇱🇾 Libya | $2.9B | $2.4B | -$-0.6B |
| 🇫🇮 Finland | $5.3B | $4.5B | -$-0.7B |
| 🇬🇾 Guyana | $1.3B | $0.6B | -$-0.7B |
| 🇹🇩 Chad | $1.1B | $0.3B | -$-0.8B |
| 🇺🇦 Ukraine | $4.3B | $3.3B | -$-1.1B |
| 🇱🇦 Laos | $3.4B | $2.3B | -$-1.1B |
| 🇬🇶 Equatorial Guinea | $1.5B | $0.2B | -$-1.3B |
| 🌏 Unknown Countries (Territories) | $1.4B | $0.0B | -$-1.4B |
| 🇧🇳 Brunei | $2.2B | $0.8B | -$-1.4B |
| 🇺🇾 Uruguay | $4.5B | $3.0B | -$-1.5B |
| 🇳🇨 New Caledonia | $1.9B | $0.2B | -$-1.7B |
| 🇬🇳 Guinea | $4.5B | $2.3B | -$-2.3B |
| 🇵🇬 Papua New Guinea | $3.8B | $1.4B | -$-2.4B |
| 🇳🇴 Norway | $8.0B | $5.2B | -$-2.8B |
| 🇦🇹 Austria | $8.2B | $5.1B | -$-3.1B |
| 🇸🇰 Slovakia | $7.7B | $4.4B | -$-3.3B |
| 🇬🇦 Gabon | $3.9B | $0.6B | -$-3.4B |
| 🇨🇬 Congo | $5.6B | $1.0B | -$-4.6B |
| 🇿🇲 Zambia | $5.7B | $1.0B | -$-4.8B |
| 🇲🇳 Mongolia | $9.3B | $2.9B | -$-6.5B |
| 🇳🇿 New Zealand | $16.0B | $9.1B | -$-6.8B |
| 🇮🇩 Indonesia | $77.9B | $70.9B | -$-7.0B |
| 🇿🇦 South Africa | $32.4B | $24.0B | -$-8.4B |
| 🇹🇲 Turkmenistan | $10.3B | $0.9B | -$-9.5B |
| 🇵🇪 Peru | $24.1B | $13.4B | -$-10.7B |
| 🇨🇩 Democratic Republic of Congo | $16.6B | $5.1B | -$-11.5B |
| 🇯🇵 Japan | $184.4B | $172.5B | -$-11.9B |
| 🇮🇪 Ireland | $18.1B | $5.7B | -$-12.4B |
| 🇲🇾 Malaysia | $109.9B | $92.2B | -$-17.7B |
| 🇶🇦 Qatar | $22.6B | $3.9B | -$-18.6B |
| 🇦🇴 Angola | $23.2B | $4.0B | -$-19.2B |
| 🇰🇼 Kuwait | $26.5B | $4.9B | -$-21.6B |
| 🇨🇱 Chile | $44.4B | $22.4B | -$-22.0B |
| 🇮🇶 Iraq | $39.4B | $13.8B | -$-25.6B |
| 🇴🇲 Oman | $36.2B | $4.2B | -$-32.1B |
| 🇰🇷 Republic of Korea | $199.1B | $161.3B | -$-37.8B |
| 🇷🇺 Russia | $114.4B | $75.6B | -$-38.7B |
| 🇸🇦 Saudi Arabia | $78.1B | $37.7B | -$-40.4B |
| 🇨🇭 Switzerland | $49.7B | $7.6B | -$-42.1B |
| 🇧🇷 Brazil | $109.4B | $61.8B | -$-47.6B |
| 🇦🇺 Australia | $142.1B | $78.5B | -$-63.6B |
| 🇨🇳 China | $121.9B | N/A | -$-121.9B |
| 🇹🇼 Taiwan | $237.2B | $81.5B | -$-155.8B |
China had individual trade surpluses with the overwhelming majority of its trade partners: 174 of the 234 countries and territories listed.
These trade surpluses are especially visible in China’s trade relationships with many of the world’s largest economies, including the U.S. and India, with $401.1 billion and $100.3 billion surpluses respectively.
Meanwhile, a good sum of the country’s trade deficits are with major Asian economies. Its largest deficit is with Taiwan, primarily coming from integrated circuit imports. China also has deficits with Japan (-$11.9 billion) and South Korea (-$37.8 billion), the region’s second and fourth-largest economies respectively, largely due to electronics and machinery imports.
The country’s other trade deficits stem from fulfilling strategic needs. For example, China has deficits with oil-producing countries like Russia and Saudi Arabia. It also has a trade deficit with Australia, a key supplier of raw goods such as iron, gold, lithium, and liquefied petroleum gas.
China’s Evolving Trade Partner Relationships
China’s trade relationships extend far beyond just economic considerations; they reflect historical, geopolitical, and strategic factors as well.
Taiwan’s major role in the semiconductor market, for example, makes it both a valuable trade partner and a contentious rival. China considers Taiwan a part of its territory, while Taiwan operates as a separate, self-governed entity.
Likewise, China’s increasing investments in infrastructure across parts of Asia and Africa are starting to reflect growing trade balances with developing countries set to become major trade partners in the future.
As the Chinese economy evolves (and potentially weakens), its relationships with both allies and potential enemies may only grow more complex.

This article was published as a part of Visual Capitalist's Creator Program, which features data-driven visuals from some of our favorite Creators around the world.


United States
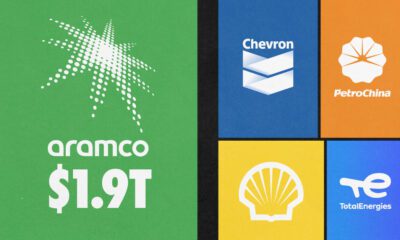
The World’s Largest Economies: Comparing the U.S. and China
How do the world’s two largest economies compare? We look at the economies of U.S. and China across GDP, stock markets, and FDI.

Comparing the Economies of U.S. and China in 3 Key Metrics
This was originally posted on our Voronoi app. Download the app for free on iOS or Android and discover incredible data-driven charts from a variety of trusted sources.
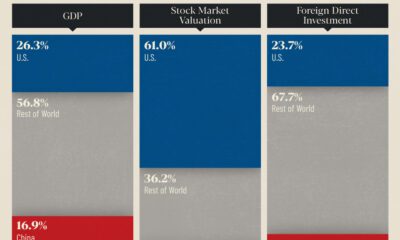
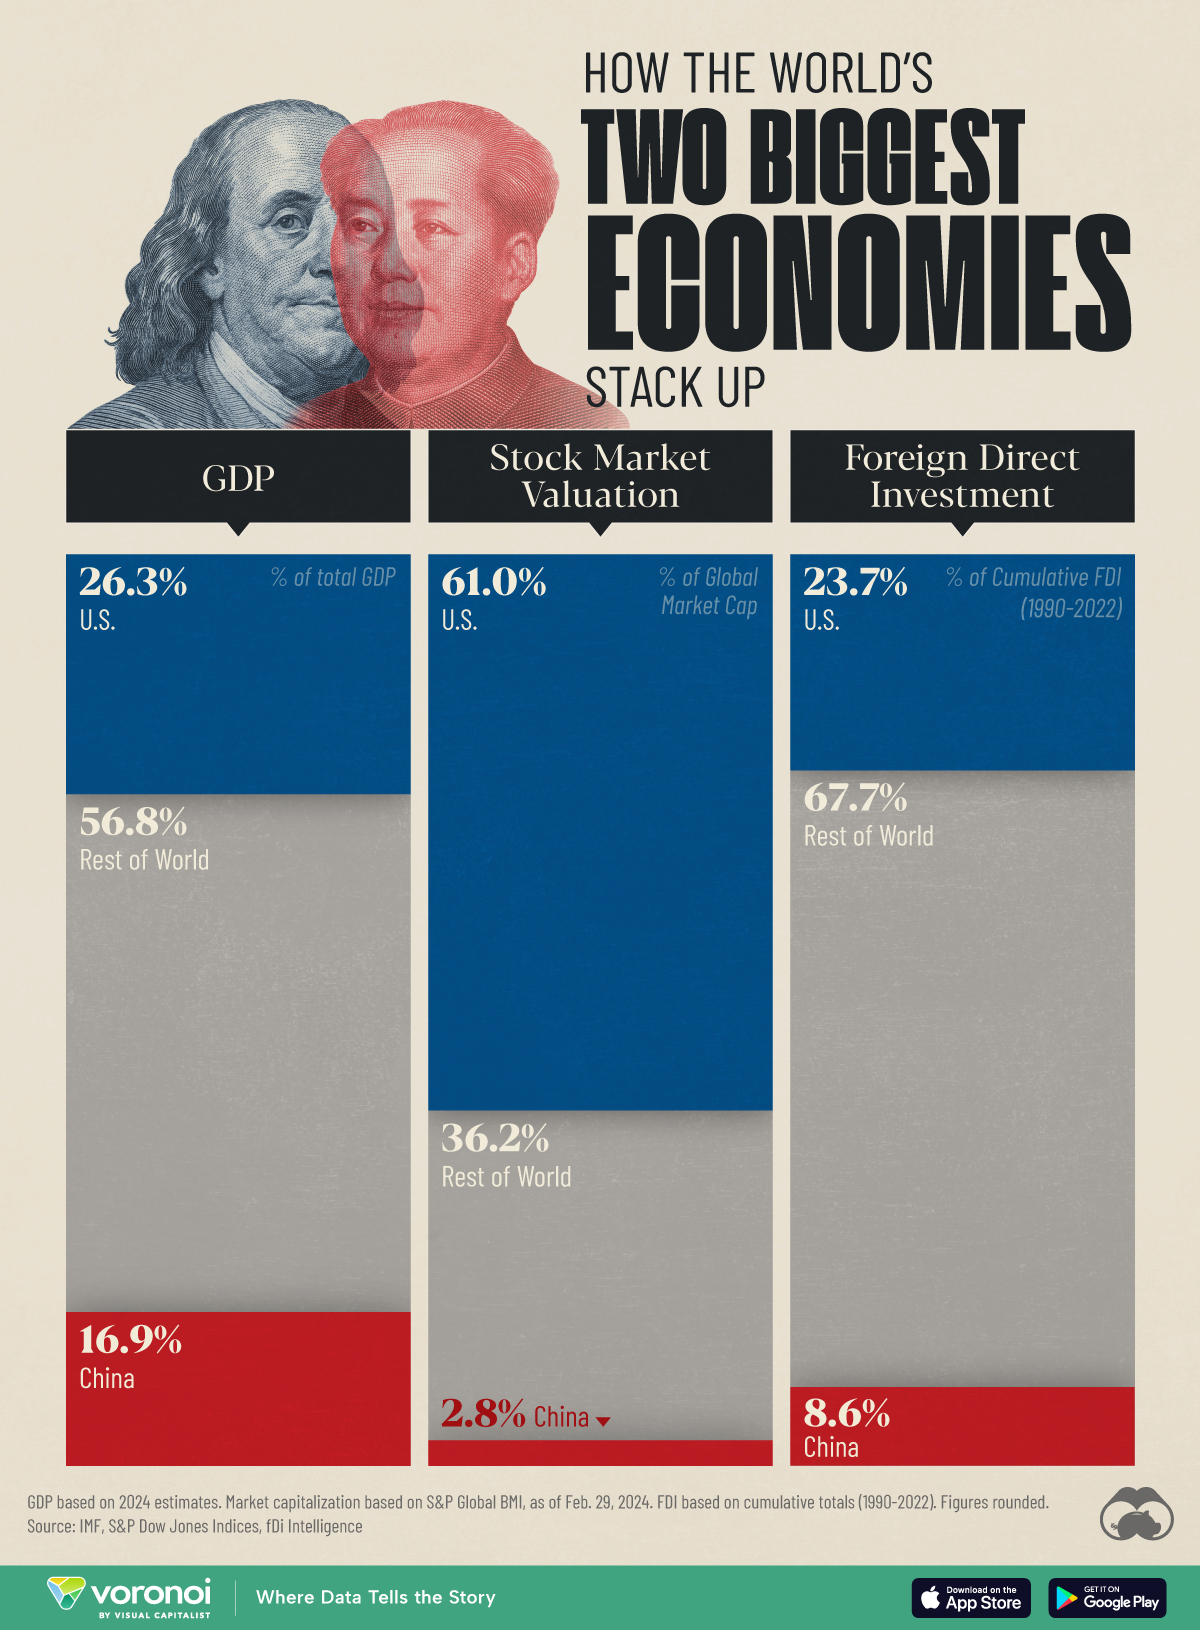
In this graphic, we provide insight into the world’s two biggest economies by comparing them across three key metrics: GDP, equity market valuation, and foreign direct investment (FDI).
Starting with GDP, we used 2024 estimates from the latest edition of the IMF’s World Economic Outlook (April 2024):
| Country | GDP (% of total) | GDP (USD billions) |
|---|---|---|
| 🇺🇸 U.S. | 26.3 | $28,780 |
| 🇨🇳 China | 16.9 | $18,530 |
| 🌍 Rest of World | 56.8 | $62,220 |
Based on these figures, the United States and China combine for a massive 43.2% share of the global economy.
It’s also interesting to note that America’s share of global GDP has actually been increasing in recent years, from a low of 21.1% in 2011. This is partly due to its relatively strong recovery from the COVID-19 pandemic.
Equity Market Valuation
The U.S. dominates when it comes to stock market valuation, accounting for 61% of the global total as of Feb. 29, 2024. These figures are based on each country’s share of the S&P Global BMI, which is a broad coverage index, including large, mid, and small-cap stocks from developed and emerging markets.
| Country | % of Global Market Cap |
|---|---|
| 🇺🇸 U.S. | 61.0 |
| 🇨🇳 China | 2.8 |
| 🌍 Rest of World | 36.2 |
The massive disparity in equity market valuations between the U.S. and China is a result of differences in many factors, including market maturity, corporate governance, and international participation.
In terms of country rankings within the S&P Global BMI, China is the fourth largest (behind Japan and the UK).
Foreign Direct Investment
FDI is an investment made by a firm or individual in one country into business interests located in another country. This type of investment can be very beneficial because it can create jobs and enhance economic growth. The FDI figures in this graphic were sourced from fDi Intelligence, and represent cumulative FDI stock from 1990 to 2022.
| Country | % of Global FDI | FDI (current USD) |
|---|---|---|
| 🇺🇸 U.S. | 23.7 | $10.5T |
| 🇨🇳 China | 8.6 | $3.8T |
| 🌍 Rest of World | 67.7 | $30.0T |
The U.S. and China are first and second in terms of cumulative FDI stock. Attracting FDI is one area where China has performed very strongly in recent years.
For example, in 2012, China had attracted $950 billion in FDI, good enough for sixth place. As of 2022, China’s total had grown to $3.8 trillion, a testament to its attractiveness to global businesses, even in the face of regulatory challenges and geopolitical tensions.
Learn More About the Global Economy From Visual Capitalist
If you enjoyed this graphic, check out this graphic ranking the world’s biggest stock markets by country.

-

 Stocks7 days ago
Visualizing Berkshire Hathaway’s Stock Portfolio (Q1 2024)
-

 China3 weeks ago
Comparing New and Current U.S. Tariffs on Chinese Imports
-

 Politics3 weeks ago
Which Countries Have the Most Economic Influence in Southeast Asia?
-

 Misc2 weeks ago
The Top 25 Nationalities of U.S. Immigrants
-

 Demographics2 weeks ago
Ranked: Countries Where Youth are the Most Unhappy, Relative to Older Generations
-

 Technology2 weeks ago
Visualizing the 5 Most Common Cybersecurity Mistakes
-
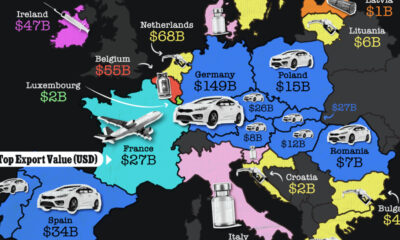
 Maps2 weeks ago
Mapped: The Top Export in Each EU Country
-

 Maps2 weeks ago
Mapped: Indian States with Cities Over 1 Million People