Politics
Visualizing $233B in Ukraine Aid
The Top 10 Donors to Ukraine
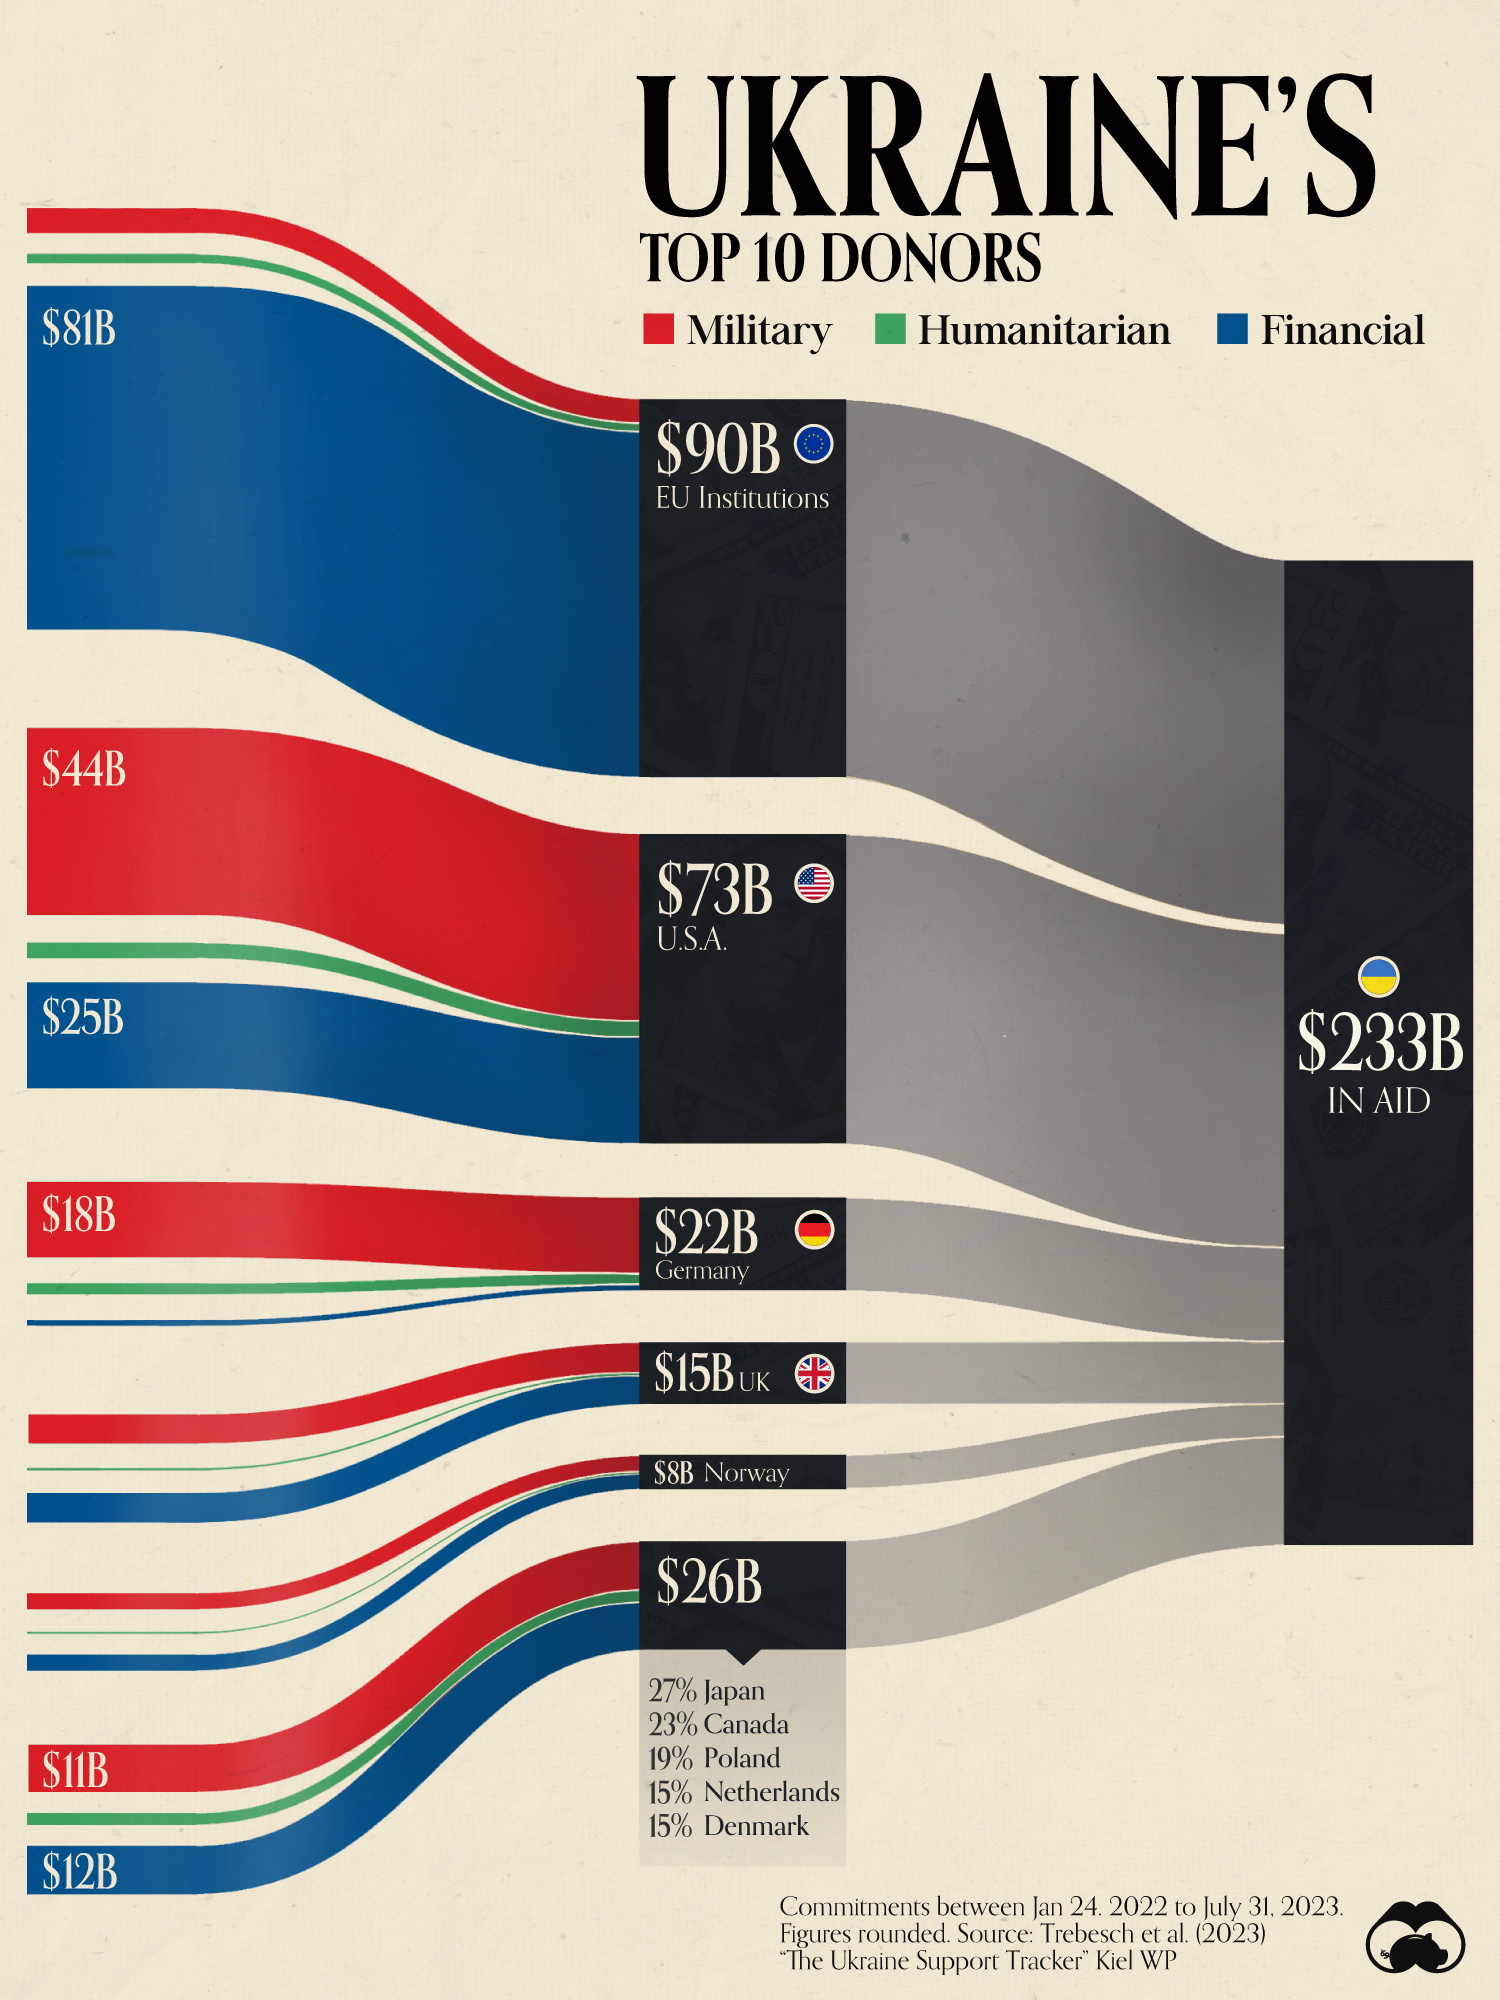
Ukraine has received over $230 billion in aid since the Russian invasion in 2022.
EU institutions and the U.S. together account for almost 70% of the total aid.
This graphic uses data from the Ukraine Support Tracker to visualize the top 10 donors to Ukraine between Jan 24, 2022, and July 31, 2023.
European Union is the Biggest Donor
Military aid to Ukraine includes weapons, equipment, and items explicitly donated to the Ukrainian army.
The graphic also illustrates humanitarian aid to assist civilians and financial aid like grants, loans, and guarantees made to the Ukrainian government. It does not include private donations, support for refugees outside of Ukraine, or assistance from international organizations.
As of July 2023, the European Union institutions have been the biggest donor, sending over $90 billion through various mechanisms such as loans or grants, and military assistance through its European Peace Facility fund.
Unlike the United States, which has the largest share of aid in military support, the EU has focused on financial aid.
| Donor | Military (Billion USD) | Humanitarian | Financial | Total |
|---|---|---|---|---|
| 🇪🇺 EU Institutions | 5.9 | 2.2 | 81.4 | 89.5 |
| 🇺🇸 U.S. | 44.4 | 3.7 | 25.1 | 73.2 |
| 🇩🇪 Germany | 18.0 | 2.6 | 1.4 | 22.1 |
| 🇬🇧 UK | 7.0 | 0.6 | 7.0 | 14.6 |
| 🇳🇴 Norway | 3.9 | 0.2 | 3.8 | 7.9 |
| 🇯🇵 Japan | 0.0 | 1.0 | 5.8 | 6.8 |
| 🇨🇦 Canada | 1.8 | 0.4 | 3.6 | 5.8 |
| 🇵🇱 Poland | 3.2 | 0.4 | 0.9 | 4.5 |
| 🇳🇱 Netherlands | 2.6 | 0.6 | 1.1 | 4.3 |
| 🇩🇰 Denmark | 3.7 | 0.3 | 0.1 | 4.1 |
| Total | 90.5 | 12.2 | 130.1 | 232.9 |
EU aid includes $3.3 billion for lethal equipment and an additional $2.1 billion to supply Ukraine with one million rounds of ammunition.
The bloc is considering providing up to $53 billion in financial assistance to Ukraine (in loans and grants) for the 2023-2027 period, including using frozen Russian assets to support Ukraine’s reconstruction.
While not captured in this dataset, Denmark and the Netherlands announced in August 2023 that they would donate up to 61 F-16 fighter jets to Ukraine.
U.S. Support
After the European Union, the United States is the biggest donor, with over $70 billion.
The country has already disbursed 96% of the funds allocated to Ukraine since the start of the war, and this has sparked a political controversy.
While the Biden administration strongly defends a $106 billion Emergency National Security Supplemental Request to help Ukraine and Israel, Republican senators oppose the current budget, which contains an additional $60 billion in aid for Ukraine.


Public Opinion
Charted: How Democrats and Republicans View Government Agencies
Predictably, results diverge when both Democrats and Republicans are asked to rate key government agencies in the United States.

How Democrats and Republicans View Government Agencies
This was originally posted on our Voronoi app. Download the app for free on iOS or Android and discover incredible data-driven charts from a variety of trusted sources.
Forget the presidential race, the partisan divide in America can also be seen by how Democrats and Republicans feel about key government agencies.
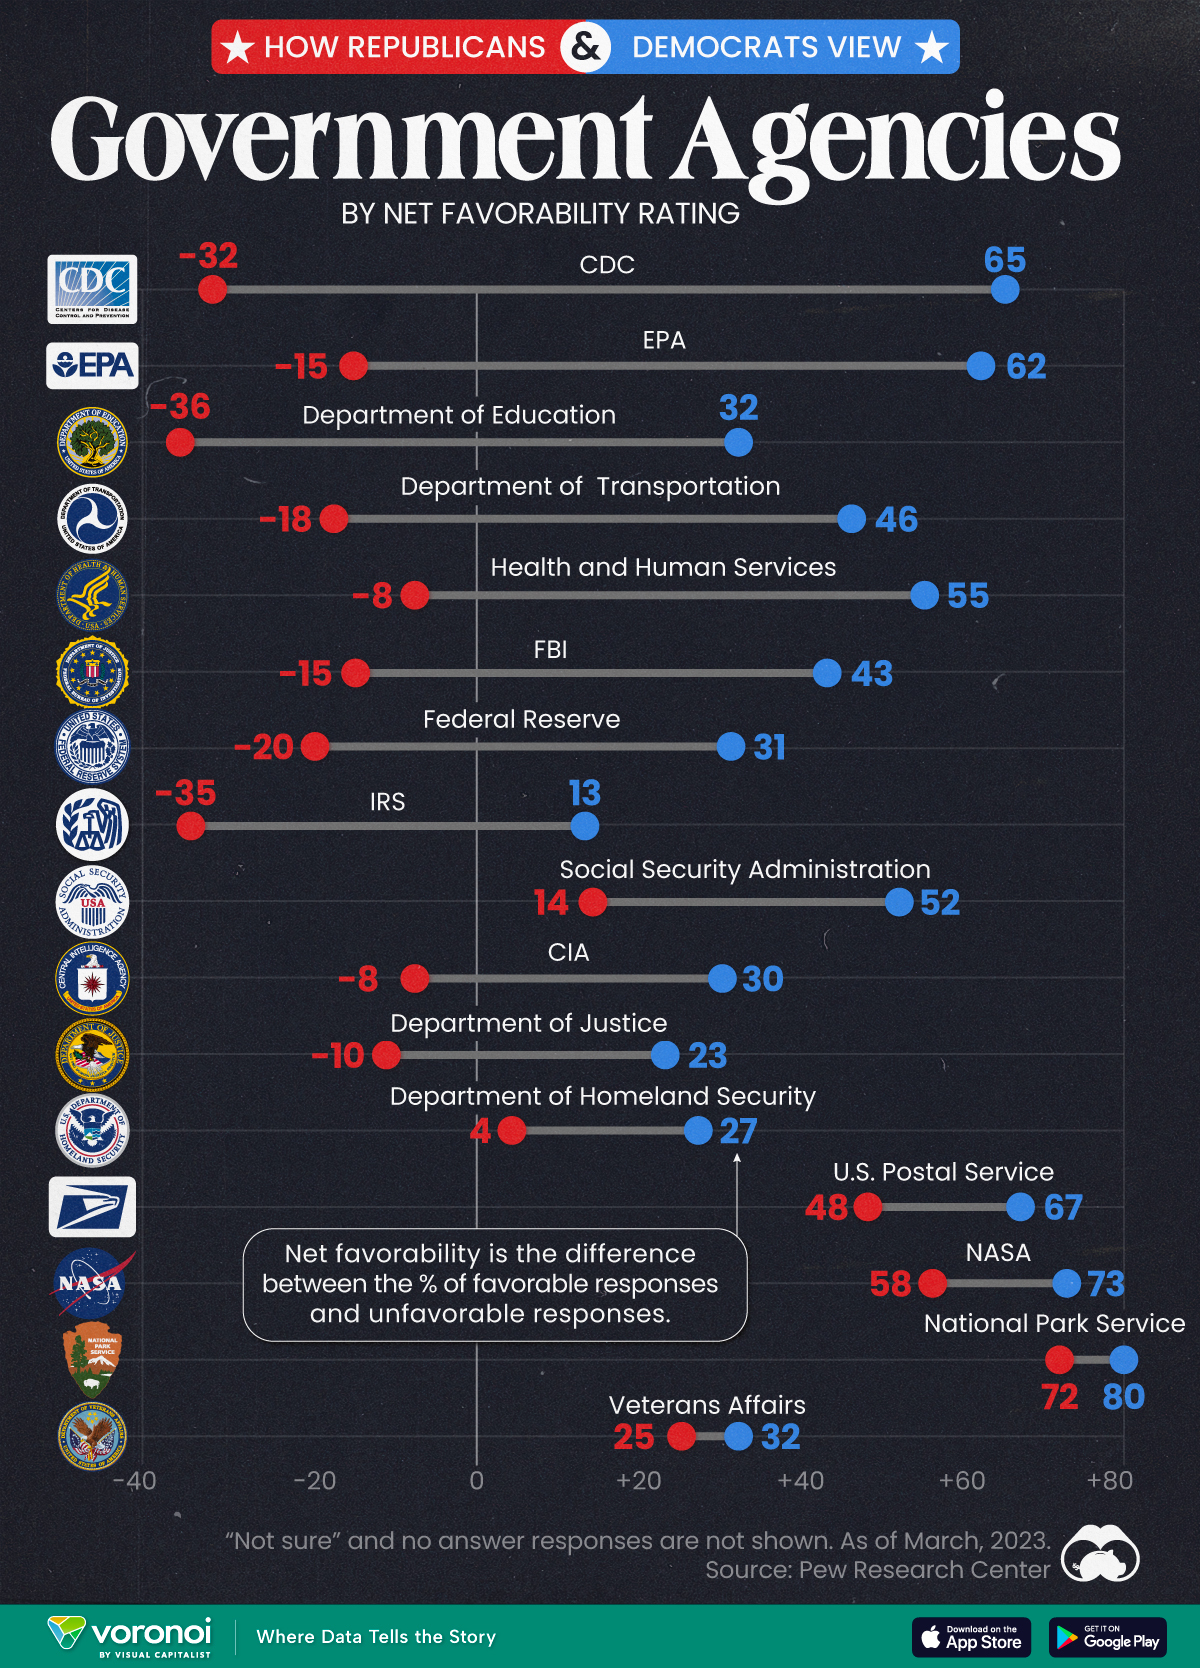
We visualize the net favorability ratings of 16 federal government agencies, based on respondent party affiliation.
To find this data, Pew Research Center surveyed more than 10,000 adults, between March 13-19, 2023. View their methodology page for more details about the survey, the questions asked, and the results obtained.
Republicans Don’t Like How the CDC Handled the Pandemic
The division in net favorability is deepest for three federal government agencies. While the CDC garnered a net favorability rating of 65 from Democrats, more Republicans rated the agency unfavorably, leading to a net favorability rating of -32.
Similarly, with the EPA and the Department of Education, the difference in net favorability between the two voting sides is as high as 70–80 points.
| Federal Agency | Republican Net Favorability Rating | Democrat Net Favorability Rating |
|---|---|---|
| 🔬 CDC | -32 | 65 |
| 🌿 EPA | -15 | 62 |
| 📚 Department of Education | -36 | 32 |
| 🚗 Department of Transportation | -18 | 46 |
| 💉 Health and Humans Services | -8 | 55 |
| 💰 Federal Reserve | -20 | 31 |
| 🕵️ FBI | -15 | 43 |
| 💼 IRS | -35 | 13 |
| 💼 Social Security Admin | 14 | 52 |
| 🕵️♂️ CIA | -8 | 30 |
| ⚖️ Justice Department | -10 | 23 |
| 🛡️ Homeland Security | 4 | 27 |
| 📮 USPS | 48 | 67 |
| 🚀 NASA | 58 | 73 |
| 🏞️ Park Service | 72 | 80 |
| 🎖️ Veterans Affairs | 25 | 32 |
Pew Research Center notes that Republicans didn’t always view the CDC quite so unfavorably, though a direct comparison is impossible.
Nevertheless, per the source, in March 2020, 84% of surveyed Republicans expressed positive views of the CDC’s performance. By October 2022, just 32% said the CDC had done an excellent or good job of handling the pandemic.
Meanwhile, there are a few agencies the two sides do agree on: the National Park Service, the Postal Service, and NASA.
And they both agree on Veterans Affairs as well: though neither share a particularly high opinion of the organization.
Finally, Democrats consistently rate all sixteen agencies on the survey more favorably than Republicans, showing consistency about how each side views the government in general.

-

 Maps7 days ago
Mapped: Southeast Asia’s GDP Per Capita, by Country
-

 Markets2 weeks ago
Visualizing Global Inflation Forecasts (2024-2026)
-

 United States2 weeks ago
Charted: What Southeast Asia Thinks About China & the U.S.
-

 United States2 weeks ago
The Evolution of U.S. Beer Logos
-

 Healthcare1 week ago
What Causes Preventable Child Deaths?
-

 Energy1 week ago
Who’s Building the Most Solar Energy?
-

 Markets1 week ago
Mapped: The Most Valuable Company in Each Southeast Asian Country
-

 Technology1 week ago
Mapped: The Number of AI Startups By Country