A month before the election, large percentages of registered voters lack opinions of candidates for Wisconsin Supreme Court, state superintendent of public instruction
Although both races are nonpartisan, substantial partisan differences exist in views of the candidates, majority of voters aware balance of the state Supreme Court will be affected
Also:
- Trump’s job performance: 48% approve, 51% disapprove
- Wisconsin voters overall are skeptical of tariffs and DOGE
- Large partisan divides shape opinion on most policy issues
MILWAUKEE – A new Marquette Law School Poll survey of Wisconsin finds that large percentages of registered voters remain unfamiliar with the candidates for the Wisconsin Supreme Court and the state superintendent of public instruction less than a month before the April 1 elections.
Among registered voters, 38% don’t offer an opinion on state Supreme Court candidate Brad Schimel, former state Attorney General, saying they haven’t heard enough about him or they don’t know if they have a favorable or unfavorable opinion of him. Considerably more, 58%, say they don’t have an opinion of Schimel’s opponent, Susan Crawford.
In the election for state superintendent of public instruction, 64% lack an opinion of incumbent Jill Underly and 71% haven’t heard enough about her opponent, Brittany Kinser.
This Marquette Law School Poll survey was conducted Feb. 19-26, 2025, interviewing 864 Wisconsin registered voters, with a margin of error of +/-4.6 percentage points. To cover more topics a number of items were asked of a random half-sample of 432 registered voters with a margin of error of +/-6.6 percentage points.
Awareness of the candidates is greater among those who say both that they are certain to vote in the election and that they are very enthusiastic about voting. Table 1 shows the relationship between certainty of voting and enthusiasm for each candidate, as well as the favorable and unfavorable opinions for each. Those very enthusiastic to vote are somewhat more familiar with each candidate than the separately measured group of those who say they are certain to vote. Schimel is the best-known candidate, followed by Crawford, Underly, and Kinser for both those certain to vote and those very enthusiastic. Kinser has the most positive net favorability, followed by Crawford, Underly, and Schimel.
Table 1: Favorability, by certain to vote and by enthusiasm
Among registered voters
| Involvement | Favorability | |||
| Net favorability | Favorable | Unfavorable | Not heard enough/DK | |
| Brad Schimel | ||||
| Absolutely certain to vote | -3 | 37 | 40 | 23 |
| Less than certain to vote | -4 | 16 | 20 | 64 |
| Very enthusiastic | -1 | 41 | 42 | 17 |
| Somewhat enthusiastic or less | -4 | 21 | 25 | 54 |
| Susan Crawford | ||||
| Absolutely certain to vote | 0 | 27 | 27 | 46 |
| Less than certain to vote | -10 | 6 | 16 | 79 |
| Very enthusiastic | 1 | 31 | 30 | 39 |
| Somewhat enthusiastic or less | -8 | 9 | 17 | 74 |
| Jill Underly | ||||
| Absolutely certain to vote | -5 | 22 | 27 | 51 |
| Less than certain to vote | -4 | 5 | 9 | 85 |
| Very enthusiastic | -2 | 25 | 27 | 48 |
| Somewhat enthusiastic or less | -6 | 9 | 15 | 76 |
| Brittany Kinser | ||||
| Absolutely certain to vote | 7 | 23 | 16 | 61 |
| Less than certain to vote | -6 | 3 | 9 | 88 |
| Very enthusiastic | 11 | 28 | 17 | 55 |
| Somewhat enthusiastic or less | -4 | 6 | 10 | 83 |
| Marquette Law School Poll, Wisconsin survey, latest: Feb. 19-26, 2025 | ||||
| Question: Do you have a favorable or unfavorable opinion of [INSERT NAME] or haven’t you heard enough about them yet? | ||||
| Question: Certainty about voting: What are the chances that you will vote in the April 2025 elections for Wisconsin Supreme Court, state Superintendent of Public Instruction and other offices– are you absolutely certain to vote, very likely to vote, are the chances 50-50, don’t you think you will vote? | ||||
| Question: Enthusiasm: How enthusiastic are you about voting in the elections in April 2025 for Wisconsin Supreme Court, state Superintendent of Public Instruction and other offices? Would you say you are very, somewhat, not too, or not at all enthusiastic? | ||||
Those most involved in the spring elections are those who say they are both certain to vote and are very enthusiastic. This provides a single measure of involvement in the election. This most-involved group makes up 41% of registered voters. For comparison, in the most recent state Supreme Court election, in 2023, 51% of registered voters actually turned out.
Those most involved with the election are much more likely to have an opinion of the candidates than are those who are less involved. The most involved are also more favorable to each of the four candidates than the less involved. There remain differences across the candidates in the percentages of voters without opinions, even among the most involved. Schimel is the best known, followed by Crawford, Underly, and Kinser. Though Kinser is the least known, she has the highest net favorable rating, followed by Crawford, Underly, and Schimel. These results are shown in Table 2.
Table 2: Favorability, by those most involved
Among registered voters
| Involvement | Favorability | |||
| Net favorability | Favorable | Unfavorable | Not heard enough/DK | |
| Brad Schimel | ||||
| Certain to vote & very enthusiastic | -1 | 42 | 43 | 15 |
| Less involved | -4 | 21 | 25 | 54 |
| Susan Crawford | ||||
| Certain to vote & very enthusiastic | 1 | 33 | 32 | 36 |
| Less involved | -8 | 9 | 17 | 74 |
| Jill Underly | ||||
| Certain to vote & very enthusiastic | -2 | 26 | 28 | 46 |
| Less involved | -6 | 9 | 15 | 77 |
| Brittany Kinser | ||||
| Certain to vote & very enthusiastic | 11 | 29 | 18 | 53 |
| Less involved | -4 | 6 | 10 | 84 |
| Marquette Law School Poll, Wisconsin survey, latest: Feb. 19-26, 2025 | ||||
| Question: Do you have a favorable or unfavorable opinion of [INSERT NAME] or haven’t you heard enough about them yet? | ||||
| Question (note): Those most involved say they are certain to vote and are very enthusiastic to vote. All others are coded as less involved. | ||||
Although these races are officially nonpartisan, opinions of the candidates are nonetheless aligned with partisanship of voters, as shown in Table 3 for Schimel and Table 4 for Crawford. Democrats are a bit more aware of Schimel than are Republicans, with independents least able to rate him. Republicans are strongly favorable to Schimel, with a net favorability of +50, and Democrats strongly unfavorable, at a net favorability of -57. He has a net favorability of -16 among independents.
Table 3: Favorability to Brad Schimel, by party identification
Among registered voters
| Party ID | Favorability | |||
| Net favorability | Favorable | Unfavorable | Not heard enough/DK | |
| Among all registered voters | -3 | 29 | 32 | 38 |
| Republican | 50 | 56 | 6 | 39 |
| Independent | -16 | 23 | 39 | 38 |
| Democrat | -57 | 3 | 60 | 37 |
| Marquette Law School Poll, Wisconsin survey, Feb. 19-26, 2025 | ||||
| Question: Do you have a favorable or unfavorable opinion of [INSERT NAME] or haven’t you heard enough about them yet? | ||||
Crawford is better known to Democrats than to Republicans or, especially, independents, though not as well-known as Schimel in any partisan category. She is strongly favorable among Democrats, a net of +34, and almost equally unfavorable among Republicans with a net of -36, while she is net -11 among independents.
Table 4: Favorability to Susan Crawford by party identification
Among registered voters
| Party ID | Favorability | |||
| Net favorability | Favorable | Unfavorable | Not heard enough/DK | |
| Among all registered voters | -4 | 19 | 23 | 58 |
| Republican | -36 | 2 | 38 | 61 |
| Independent | -11 | 12 | 23 | 64 |
| Democrat | 34 | 40 | 6 | 54 |
| Marquette Law School Poll, Wisconsin survey, Feb. 19-26, 2025 | ||||
| Question: Do you have a favorable or unfavorable opinion of [INSERT NAME] or haven’t you heard enough about them yet? | ||||
Views of the candidates for school superintendent are shown for Underly in Table 5 and for Kinser in Table 6. Both candidates are less well known in each partisan group than are the Supreme Court candidates. The lower name recognition also contributes to net favorability differences by party that are smaller than those for the Court candidates. Republicans give Underly a net favorability of -30, while Democrats give her a +26 favorability and independents a -14.
Table 5: Favorability to Jill Underly, by party identification
Among registered voters
| Party ID | Favorability | |||
| Net favorability | Favorable | Unfavorable | Not heard enough/DK | |
| Among all registered voters | -4 | 16 | 20 | 64 |
| Republican | -30 | 4 | 34 | 62 |
| Independent | -14 | 8 | 22 | 69 |
| Democrat | 26 | 31 | 5 | 64 |
| Marquette Law School Poll, Wisconsin survey, Feb. 19-26, 2025 | ||||
| Question: Do you have a favorable or unfavorable opinion of [INSERT NAME] or haven’t you heard enough about them yet? | ||||
Kinser has the lowest name recognition regardless of partisan group but is the one candidate who is better known among Republicans than among Democrats. Her net favorability among Republicans is +25, and among Democrats it is -19, with independents at -6.
Table 6: Favorability to Brittany Kinser, by party identification
Among registered voters
| Party ID | Favorability | |||
| Net favorability | Favorable | Unfavorable | Not heard enough/DK | |
| Among all registered voters | 3 | 16 | 13 | 71 |
| Republican | 25 | 29 | 4 | 66 |
| Independent | -6 | 10 | 16 | 74 |
| Democrat | -19 | 3 | 22 | 75 |
| Marquette Law School Poll, Wisconsin survey, Feb. 19-26, 2025 | ||||
| Question: Do you have a favorable or unfavorable opinion of [INSERT NAME] or haven’t you heard enough about them yet? | ||||
Respondents say they are paying more attention to the state Supreme Court race than to the state school superintendent race. For the court, 39% say they have heard or read a lot about that race, while 18% say the same about the superintendent race.
Just over half of registered voters, 51%, say they have a clear idea of what Schimel stands for, while 41% say they are clear about what Crawford stands for. For Schimel, 14% say they are not clear where he stands, while 35% say they haven’t heard enough or don’t know. In Crawford’s case, 17% say they are not clear what she stands for and 42% say they haven’t heard enough or don’t know.
Trump approval and national issues
After six weeks in office for Donald Trump, 48% of those polled in Wisconsin approve of the job Trump is doing as president and 51% disapprove. Opinion is sharply divided, with 38% who strongly approve and 45% who strongly disapprove. Only 10% somewhat approve and 6% somewhat disapprove.
The partisan gap in approval of Trump is particularly large, with 92% approval among Republicans and 97% disapproval among Democrats. In March 2017, at the beginning of Trump’s first term, 77% of Republicans approved and 81% of Democrats disapproved. In the current poll, independents are more disapproving, 60%, than approving, 39%. In 2017, by contrast, independents were more approving, 42%, than disapproving, 32%. The full table of approval by party identification is shown in Table 7.
Table 7: Trump approval, by party identification
Among registered voters
| Party ID | Approval | |
| Approve | Disapprove | |
| Feb. 19-26, 2025 | ||
| Among all registered voters | 48 | 51 |
| Republican | 92 | 7 |
| Independent | 39 | 60 |
| Democrat | 2 | 97 |
| March 13-16, 2017 | ||
| Among all registered voters | 41 | 47 |
| Republican | 77 | 13 |
| Independent | 42 | 32 |
| Democrat | 9 | 81 |
| Marquette Law School Poll, Wisconsin surveys, latest: Feb. 19-26, 2025 | ||
| Question: Overall, do you approve or disapprove of the way Donald Trump is handling his job as president? | ||
Fifty-nine percent of voters say Trump’s freezing spending and closing of agencies are beyond the president’s authority, while 40% say the president has this authority without needing congressional approval. A majority of Republicans, 74%, say the president has this authority, while 65% of independents and 95% of Democrats say this is beyond the president’s authority.
Opinion is more closely divided on whether Elon Musk’s Department of Government Efficiency (DOGE) is properly carrying out Trump’s agenda, with 47% saying it is and 53% saying it is disrupting programs required by law. Among Republicans, 88% say Musk is carrying out Trump’s agenda, but 56% of independents say he is disrupting programs required by law. Almost all Democrats, 97%, say Musk is disrupting programs.
The public is skeptical of Trump’s tariffs, with 32% saying tariffs help the U.S. economy and 51% saying tariffs hurt the economy. Sixteen percent say tariffs don’t make much difference. A majority of Republicans agree with Trump’s position, with 61% saying tariffs help the economy. Among independents, 50% say tariffs hurt the economy, and 92% of Democrats say that.
Trump’s deportation of immigrants in the United States illegally is supported by 61% and opposed by 38%. When asked in a separate question about deportations that include individuals who have been in the country for a number of years and have jobs and no criminal record, 50% favor such deportations while 50% are opposed. In October, 60% favored deporting those in the country illegally, while (under the separate question) the percentage favoring deportations of long-term residents with jobs and no criminal record was 39%.
Elon Musk is viewed favorably by 41% and unfavorably by 53%. Partisan differences in views of Musk are extremely large, with 81% of Republicans favorable to Musk, while 58% of independents and 97% of Democrats are unfavorable.
The Republican Party is seen favorably by 47% and unfavorably by 52%, while the Democratic Party is viewed favorably by 34% and unfavorably by 62%. Democrats are less favorable to their party (76% favorable) than are Republicans to their party (92% favorable).
Court-related issues
While many respondents are unfamiliar with the Wisconsin Supreme Court candidates, a large percentage, 83%, say the election can tip the balance on the Court, while 15% say the election will not affect the balance and 2% say they don’t know. Republicans and Democrats are about equally likely to see the balance of the court as up for grabs, with 81% of Republicans and 87% of Democrats saying so. Among independents, 75% say the balance can change as the result of the election.
Among registered voters, 57% say the outcome of the state Supreme Court election is very important to them, while 35% say it is somewhat important. Only 7% say it is not too important and less than 1% say it is not at all important. Those who say the election is less than very important are much less involved in the election than those who say it is very important.
By a 90% to 10% margin, respondents overwhelmingly support electing judges rather than appointing them. There are modest partisan differences, with 85% of Republicans, 91% of independents, and 95% of Democrats favoring judicial elections.
Voters also favor candidates for the state Supreme Court talking about issues in the campaign, with 79% saying this, while 21% say candidates should avoid talking about issues in order to not be seen as prejudging potential cases. Majorities of each partisan group favor discussion of issues, but Republicans are slightly less supportive of discussing issues. Specifically, 79% of Republicans favor candidates discussing issues, compared to 84% of Democrats, and 63% of independents.
While voters align their views of the candidates with their partisan preferences, they are less positive about parties providing large financial donations to the candidates. Just 38% say party contributions give voters a better idea of what the candidates stand for, while 61% say party contributions reduce the independence of judges from politics. On this question, Republicans are more positive about party contributions, with 42% saying these contributions clarify positions, while 28% of Democrats and 52% of independents say that.
One topic likely to reach the Court in the future is the constitutionality of elements of Act 10, the 2011 law substantially limiting public sector unions in Wisconsin, which was recently struck down by a district court. Overall, Act 10 is supported by 42%, while 54% say the law should be struck down as unconstitutional and 4% say they don’t know. There are substantial partisan divisions over Act 10, with 62% of Republicans favoring the law, while 51% of independents and 76% of Democrats want it struck down. In the October 2018 Marquette Law School Poll, respondents were asked if they preferred to keep Act 10 as it is or to return to collective bargaining as it was before Act 10. Keeping Act 10 was favored by 43%, while returning collective bargaining was favored by 42%.
A substantial majority of the public (64%) favor legal abortions in all or most cases, with 36% who say it should be illegal in all or most cases. Opinion on abortion has remained stable since August 2022, following the U.S. Supreme Court decision overturning Roe .v. Wade.
Photo ID to vote
Requiring a photo ID to vote is favored by 77% and opposed by 22%. In a dozen polls since 2012, the lowest support for the photo ID requirement was 58% in a poll conducted Oct. 9-12, 2014. When asked last in August 2021, 74% favored requiring a photo ID.
A proposed amendment to the Wisconsin Constitution on the April ballot would make the photo ID requirement a constitutional requirement. This is favored by 73% and opposed by 27%. Almost all Republicans, 97%, and 77% of independents favor adding this to the state constitution, while 55% of Democrats are opposed.
Schools and education issues
Across Wisconsin, 58% of people say they are either very satisfied or satisfied with the public schools in their community, while 41% are either very dissatisfied or dissatisfied. Satisfaction was higher from 2012 through 2017 than in 2018 and subsequently. In recent years, favorability has been holding around 60%, with one notable dip in June 2024. The full trend is shown in Table 8.
Table 8: Satisfaction with public schools
Among registered voters
| Satisfaction | ||
| Wave | Very satisfied/satisfied | Very dissatisfied/dissatisfied |
| 2/19-26/25 | 58 | 41 |
| 10/16-24/24 | 65 | 35 |
| 9/18-26/24 | 64 | 36 |
| 6/12-20/24 | 46 | 41 |
| 10/26-11/2/23 | 63 | 35 |
| 6/8-13/23 | 67 | 31 |
| 9/6-11/22 | 62 | 31 |
| 4/19-24/22 | 62 | 32 |
| 10/26-31/21 | 60 | 30 |
| 8/3-8/21 | 69 | 22 |
| 1/8-12/20 | 59 | 33 |
| 9/12-16/18 | 64 | 25 |
| 3/13-16/17 | 74 | 19 |
| 4/7-10/15 | 75 | 21 |
| 5/6-9/13 | 71 | 25 |
| 3/11-13/13 | 81 | 14 |
| 5/23-26/12 | 71 | 24 |
| 5/9-12/12 | 68 | 25 |
| 4/26-29/12 | 66 | 27 |
| Marquette Law School Poll, Wisconsin surveys, latest: Feb. 19-26, 2025 | ||
| Question: How satisfied are you with the job the public schools are doing in your community? | ||
The public has become increasingly concerned with holding down property taxes since 2018 and less favorably inclined toward increasing funding for K-12 public schools. In the current survey, 58% say holding down property taxes is more important, while 41% say it is more important to increase funding for schools. In 2013, slightly more people were concerned with property taxes than with school funding, while in 2015 through 2018 a substantial majority was more concerned with school funding. Since 2019, there has been a steady increase in concern about keeping down property taxes, which in polling in 2023 overtook the interest in increasing school funding. The full trend is shown in Table 9.
Table 9: More important to hold down property tax of increase school spending
Among registered voters
| Poll dates | Property taxes or schools | |
| Reducing property taxes | Increasing spending on public schools | |
| 2/19-26/25 | 58 | 41 |
| 10/16-24/24 | 55 | 44 |
| 9/18-26/24 | 56 | 44 |
| 10/26-11/2/23 | 52 | 47 |
| 6/8-13/23 | 50 | 47 |
| 10/24-11/1/22 | 46 | 48 |
| 10/3-9/22 | 42 | 52 |
| 9/6-11/22 | 41 | 51 |
| 8/10-15/22 | 43 | 52 |
| 4/19-24/22 | 46 | 50 |
| 8/3-8/21 | 42 | 52 |
| 2/19-23/20 | 38 | 56 |
| 1/8-12/20 | 41 | 55 |
| 1/16-20/19 | 39 | 55 |
| 10/24-28/18 | 40 | 55 |
| 10/3-7/18 | 37 | 57 |
| 9/12-16/18 | 38 | 57 |
| 8/15-19/18 | 32 | 61 |
| 6/13-17/18 | 35 | 59 |
| 2/25-3/1/18 | 33 | 63 |
| 4/7-10/15 | 40 | 54 |
| 5/6-9/13 | 49 | 46 |
| 3/11-13/13 | 49 | 46 |
| Marquette Law School Poll, Wisconsin surveys, latest: Feb. 19-26, 2025 | ||
| Question: Which is more important to you: reduce property taxes or increase spending on public schools? | ||
Sixty percent say Wisconsin schools have set standards lower than they should be, with 34% saying standards are about where they should be and 6% saying standards are too high. In 2014, 47% said standards were too low, 32% said they were about right, and 15% said standards were too high. An additional 5% said they didn’t know.
Despite most people having an opinion of standards, a large group, 45%, say they haven’t heard enough to know if reading test scores have gone up or down over the past five years. Similarly, 43% haven’t heard enough about math test scores to have an opinion, and 54% haven’t heard enough about whether the achievement gap between high-income and low- income students has changed. Few respondents think either reading or math scores have gone up, with more saying both have gone down than saying they have remained the same. These responses are shown in Table 10.
Table 10: Test scores and achievement gap
Among registered voters
| Measure | Change | |||
| Gone up | Stayed same | Gone down | Haven’t heard enough | |
| Reading test scores | 5 | 19 | 32 | 45 |
| Math test scores | 4 | 20 | 32 | 43 |
| Achievement gap | 18 | 20 | 8 | 54 |
| Marquette Law School Poll, Wisconsin survey, latest: Feb. 19-26, 2025 | ||||
| Question: In the public schools in your community, over the last five years, would you say reading test scores have gone up, stayed about the same, gone down, or haven’t you heard enough to say? | ||||
| Question: In the public schools in your community, over the last five years, would you say math test scores have gone up, stayed about the same, gone down, or haven’t you heard enough to say? | ||||
| Question: In the public schools in your community, over the last five years, would you say the gap in test scores between low-income and high-income students has gone up, stayed about the same, gone down, or haven’t you heard enough to say? | ||||
A majority, 57%, favor allowing all students statewide to use vouchers to attend private or religious schools if they wish, with 43% opposed. Majorities of Republicans, 74%, and independents, 54%, favor statewide vouchers for all students, while 59% of Democrats are opposed.
When asked about choosing whether to increase the state budget for students to attend private schools or increase the budget for public schools, 33% would increase funding for private schools and 67% would increase funding for public schools. A majority (57%) of Republicans would increase funding for private schools, while 69% of independents and 93% of Democrats would increase funding for public schools.
A majority (76%) favor a major increase in funding for special education in the schools, while 23% are opposed. Majorities of all partisan groups favor increasing special-education budgets, with 59% of Republicans, 72% of independents, and 97% of Democrats in favor.
Gov. Tony Evers’ proposal to include $300 million for mental health services in schools statewide is favored by 66% and opposed by 34%. This proposal is opposed by 64% of Republicans and favored by 69% of independents and 94% of Democrats.
Five years after the start of the COVID-19 pandemic, the public is closely divided on whether the closures of schools and businesses were an appropriate response. Fifty-one percent say they were appropriate steps, while 49% say they did more harm than good. This is the closest result in Marquette Law School Poll surveys on whether the closures in 2020 were appropriate or an overreaction. Throughout 2020, more than two-thirds said the closures were appropriate, declining to 56% in 2022. The full trend is shown in Table 11.
Table 11: Were closures during the pandemic appropriate or an overreaction
Among registered voters
| Poll dates | Appropriate or overreaction | |
| Appropriate response | Overreaction | |
| 2/19-26/25 | 51 | 49 |
| 9/6-11/22 | 56 | 41 |
| 2/22-27/22 | 61 | 35 |
| 8/3-8/21 | 62 | 35 |
| 10/21-25/20 | 68 | 26 |
| 6/14-18/20 | 72 | 25 |
| 5/3-7/20 | 69 | 26 |
| 3/24-29/20 | 86 | 10 |
| Marquette Law School Poll, Wisconsin surveys, latest: Feb. 19-26, 2025 | ||
| Question: Do you think the decision in 2020 to close schools and businesses and to restrict the size of public gatherings was an appropriate response to the coronavirus outbreak or was it an overreaction that did more harm than good? | ||
Partisans are extremely polarized on the issue of closures, with 80% of Republicans saying closures were an overreaction and 88% of Democrats saying they were appropriate responses. Independents are a bit more evenly divided with 40% saying closures were appropriate and 58% saying they were an overreaction.
State budget and related issues
A legislative proposal to extend post-partum Medicaid coverage to a full year for new mothers is supported by 67% and opposed by 33%. This is opposed by 54% of Republicans but supported by 74% of independents and 85% of Democrats.
Ending all diversity, equity and inclusion (DEI) programs in Wisconsin universities, public schools, and state government is favored by 50% and opposed by 49%. A large majority of Republicans, 86%, favor ending DEI programs, while 92% of Democrats oppose ending DEI. Independents are somewhat closely divided, with 44% in favor of ending DEI programs and 55% opposed.
So-called “red flag laws,” which would allow police to take guns from people found by a judge to be a danger to themselves or others, are supported by 85% and opposed by 15%. This issue is a rare case with large majorities of Republicans, 79%, independents, 68%, and Democrats, 98%, each in favor.
The public is narrowly divided on several issues. On requiring state employees to return to work in their physical offices, 54% favor and 45% oppose a policy of returning to offices.
A similar divide is seen on requiring county law enforcement to cooperate with federal immigration officials to identify immigrants in the United States illegally, and for counties to lose some state revenue if they do not cooperate. Overall, 54% favor this and 45% oppose.
A proposal by Governor Evers to make permanent a child-care subsidy that began during the COVID-19 pandemic but that is set to expire is favored by 54% and opposed by 45%.
With respect to a request by the Universities of Wisconsin system for an $800 million budget increase, 57% are opposed and 42% in favor.
Approval of governor, legislature, and Wisconsin Supreme Court
Evers’ job approval as governor is 49%, with 44% disapproval. That is a slight decline from October 2024. Six percent say they don’t know.
Approval of how the legislature is handling its job is 38%, with disapproval at 49% and 13% who don’t know. When last asked in September 2024, 33% approved and 55% disapproved.
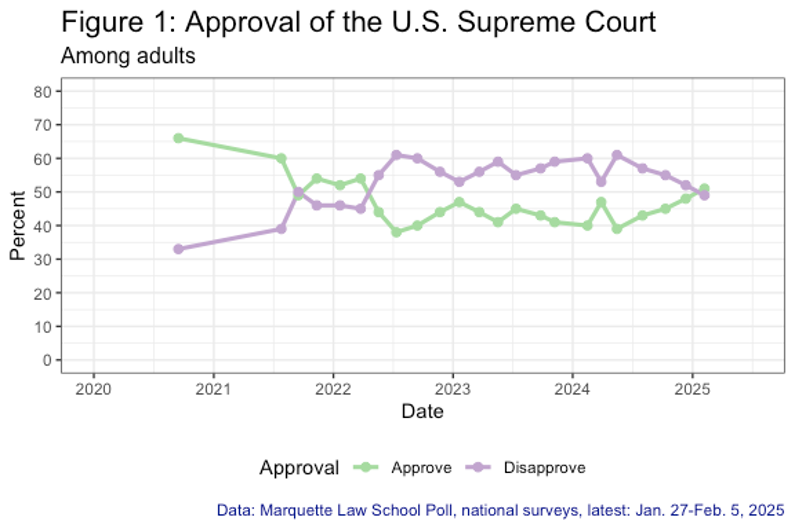
Approval of the Wisconsin Supreme Court stands at 46%, with 37% who disapprove, and 16% who don’t know. In September 2024, 44% approved and 40% disapproved.
About the Marquette Law School Poll
The Marquette Law School Poll is the most extensive statewide polling project in Wisconsin history. The survey was conducted Feb. 19-26, 2025 , interviewing 864 Wisconsin registered voters, with a margin of error of +/-4.6 percentage points. To cover more topics a number of items were asked of a random half-sample of 432 registered voters with a margin of error of +/-6.6 percentage points. The half-sample items are listed below.
Half-sample items:
- Immigration: Deport those in United States illegally; deport those in United States illegally even if they have lived here for a number of years, have jobs, and no criminal record.
- School issues: reading and math scores; achievement gap; education standards; statewide vouchers for all; increase support for students to attend private or public schools; major increase for special education; was decision to close schools and businesses appropriate or an overreaction; $300 million for school mental health.
- Supreme Court issues: appoint or elect judges; should judicial candidates talk about issues; clear idea of what Schimel stands for; clear idea of what Crawford stands for; Act 10; party contributions to Court candidates; importance of state Supreme Court election; can the election tip the balance on the Court.
- Budget and policy issues: require state employees to return to office; require county law enforcement to aid federal immigration officials; end DEI programs in universities, schools, and state government; red flag law; $500 million for child-care subsidy; $800 million increase for Universities of Wisconsin; extend Medicaid post-partum coverage for mothers to 12 months.
The survey was conducted with a hybrid sample of 641 respondents selected from the Wisconsin voter registration list and 223 selected from the SSRS Opinion Panel, a sample drawn from postal addresses across the state and invited to take part in surveys online. The interview was conducted online with 740 respondents and with 124 by telephone with a live interviewer. Full details of the methodology are contained in the methodology statement at the link below.
The partisan makeup of the sample is 36% Republican, 32% Democratic, and 32% independent. When independents who lean to a party are counted as partisans the sample is 46% Republican, 42% Democratic, and 13% independent. In all polls conducted in 2024, the combined samples were 33% Republican, 31% Democratic, and 36% independent. Counting independents who lean to a party as partisans, the 2024 samples were 45% Republican, 42% Democratic, and 12% independent.