
Physik Invest’s Daily Brief is read by thousands of subscribers. You, too, can join this community to learn about the fundamental and technical drivers of markets.
Fundamental
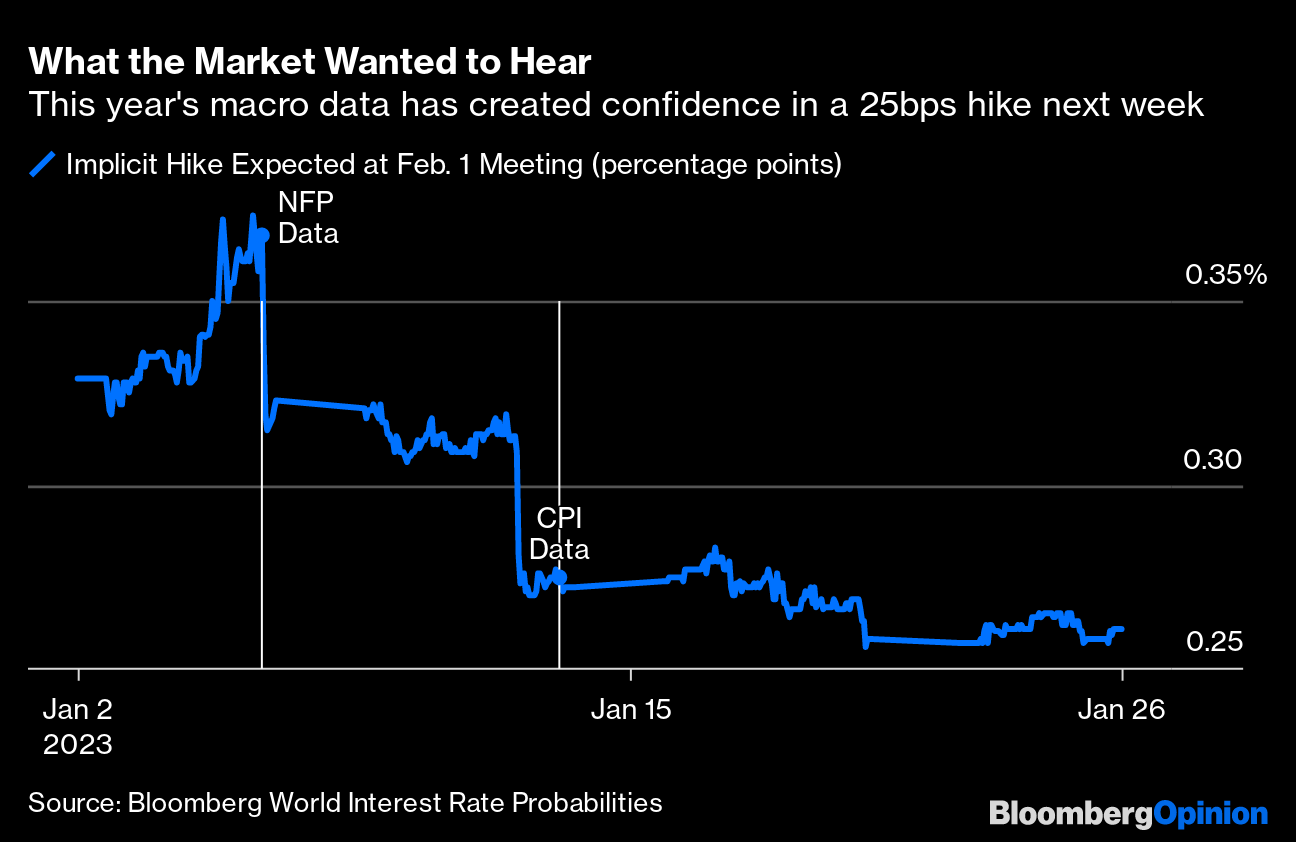
Since the start of 2023, markets have trended higher. This has coincided with traders’ expectations that inflation has peaked and the pace of tightening should slow or peak soon, China re-opening, and the aversion of an energy crisis abroad, given a warmer-than-expected winter.
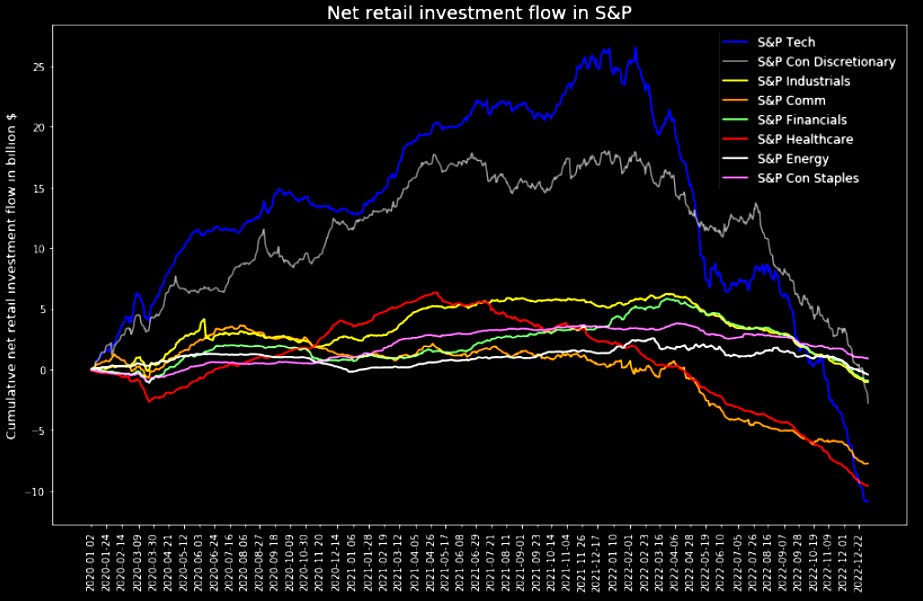
Investors continue to sit on a lot of cash, at this time.

Some, in their desire to put their cash to work, have demanded Treasuries.

Strong demand during Treasury auctions (i.e., bond bid and yield pressured), as some suggest, is forcing investors into previously depressed equities which Goldman Sachs Group Inc (NYSE: GS) showed investors selling heavily leading up to 2023.
In fact, Treasury auctions have coincided with big demand for short-dated exposure to call options and short-covering.

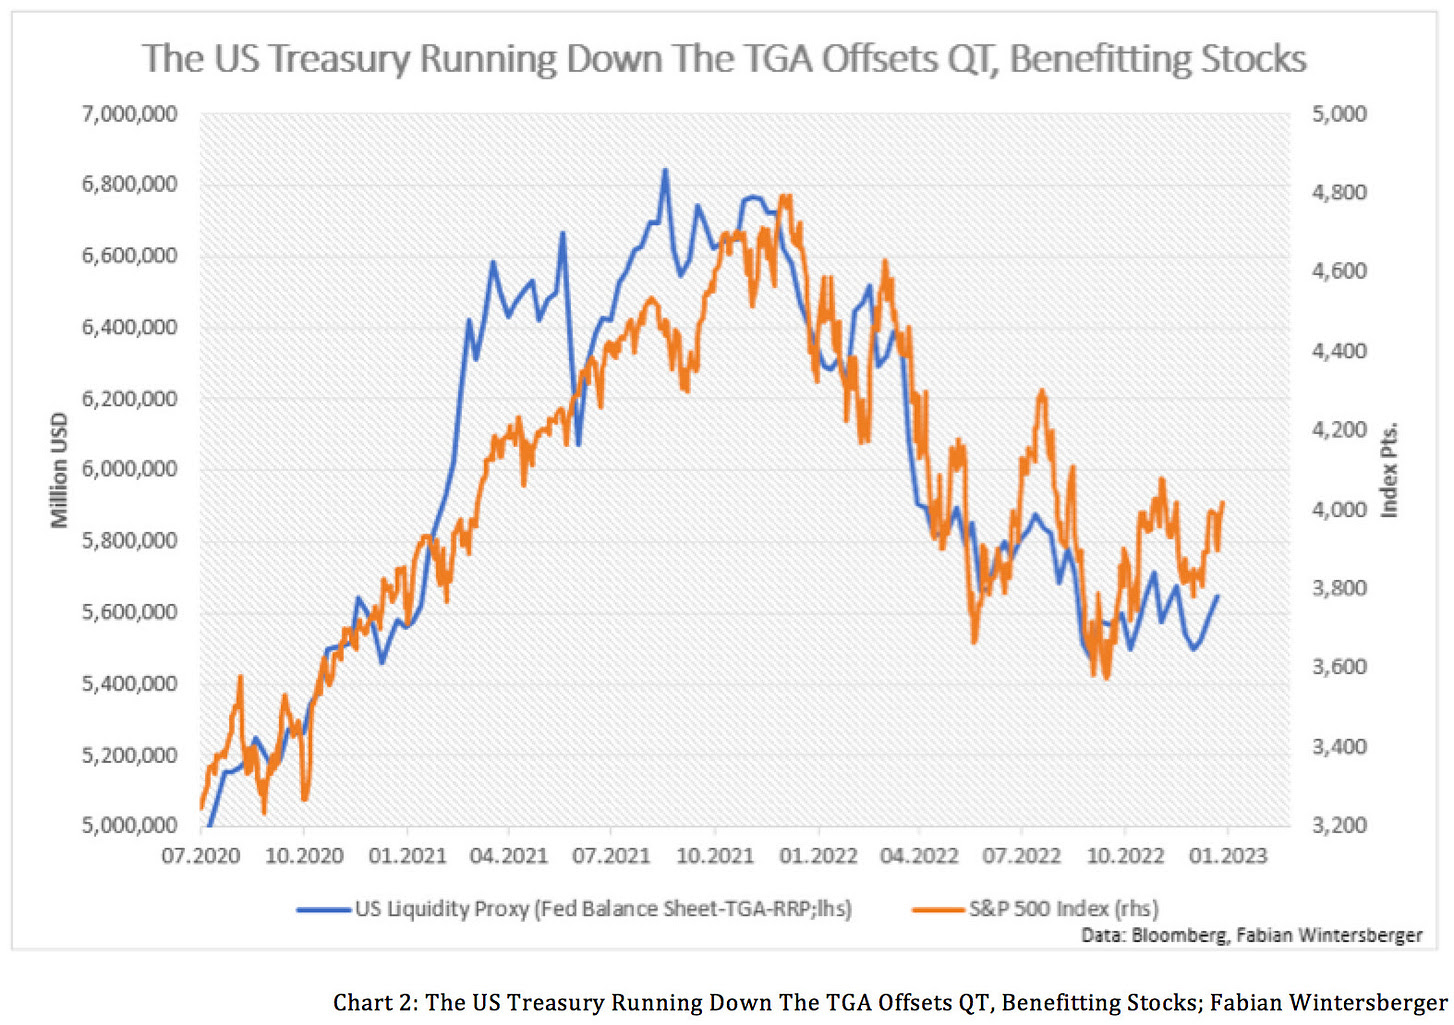
Additionally, the markets have enjoyed a liquidity boost, also a driver of equity market relief. The Treasury General Account (TGA), or the government’s checking account, if we will, was driven down and played into an easing of financial conditions which has benefitted stocks.
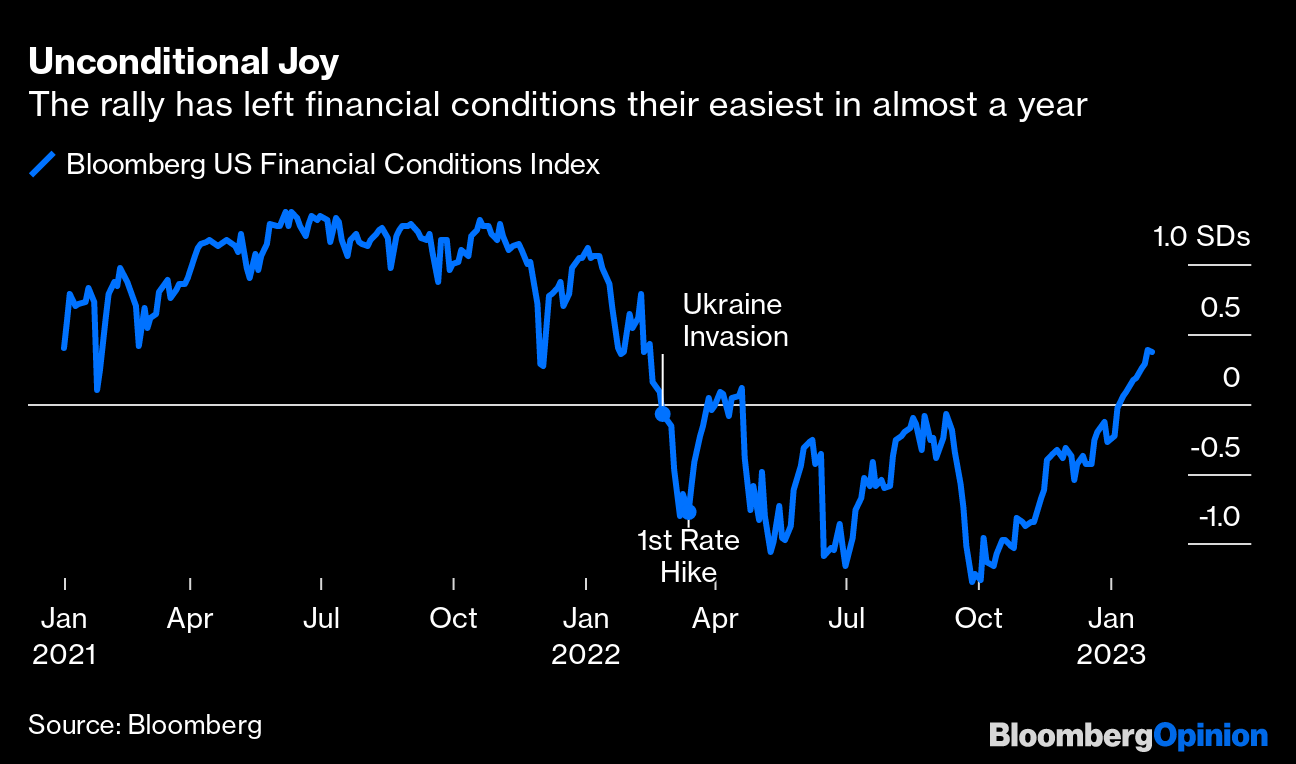
Per past letters, we note that a falling TGA is likely to be accompanied by a rise in bank reserves (liabilities to the Fed), increasing the room banks have to lend and finance trading activities which add to market liquidity. This added market liquidity, some suggest, is due to the debt ceiling. Consequently, once a debt ceiling deal is signed, run for the hills!
Morgan Stanley (NYSE: MS) concurs:
“[T]he single most important driver of equities over the last year has been excess liquidity, and it’s about to turn more restrictive. The amount of liquidity in the system is about to change again – the Treasury is increasing bill issuance sizes, which will drain liquidity from the system. The Treasury could build cash by more than $200 billion over the span of a month – which on top of QT will effectively drain nearly $300 billion from bank reserves – which implies the S&P 500 should be 6% lower over the net month.”
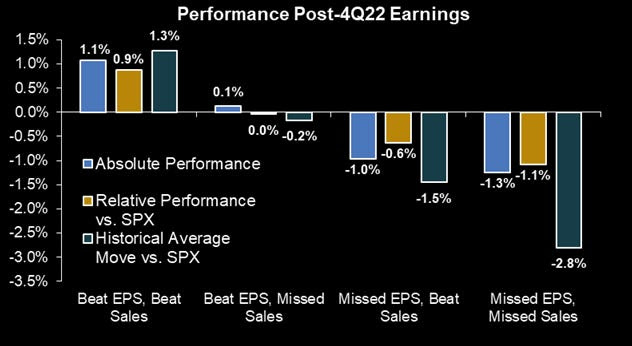
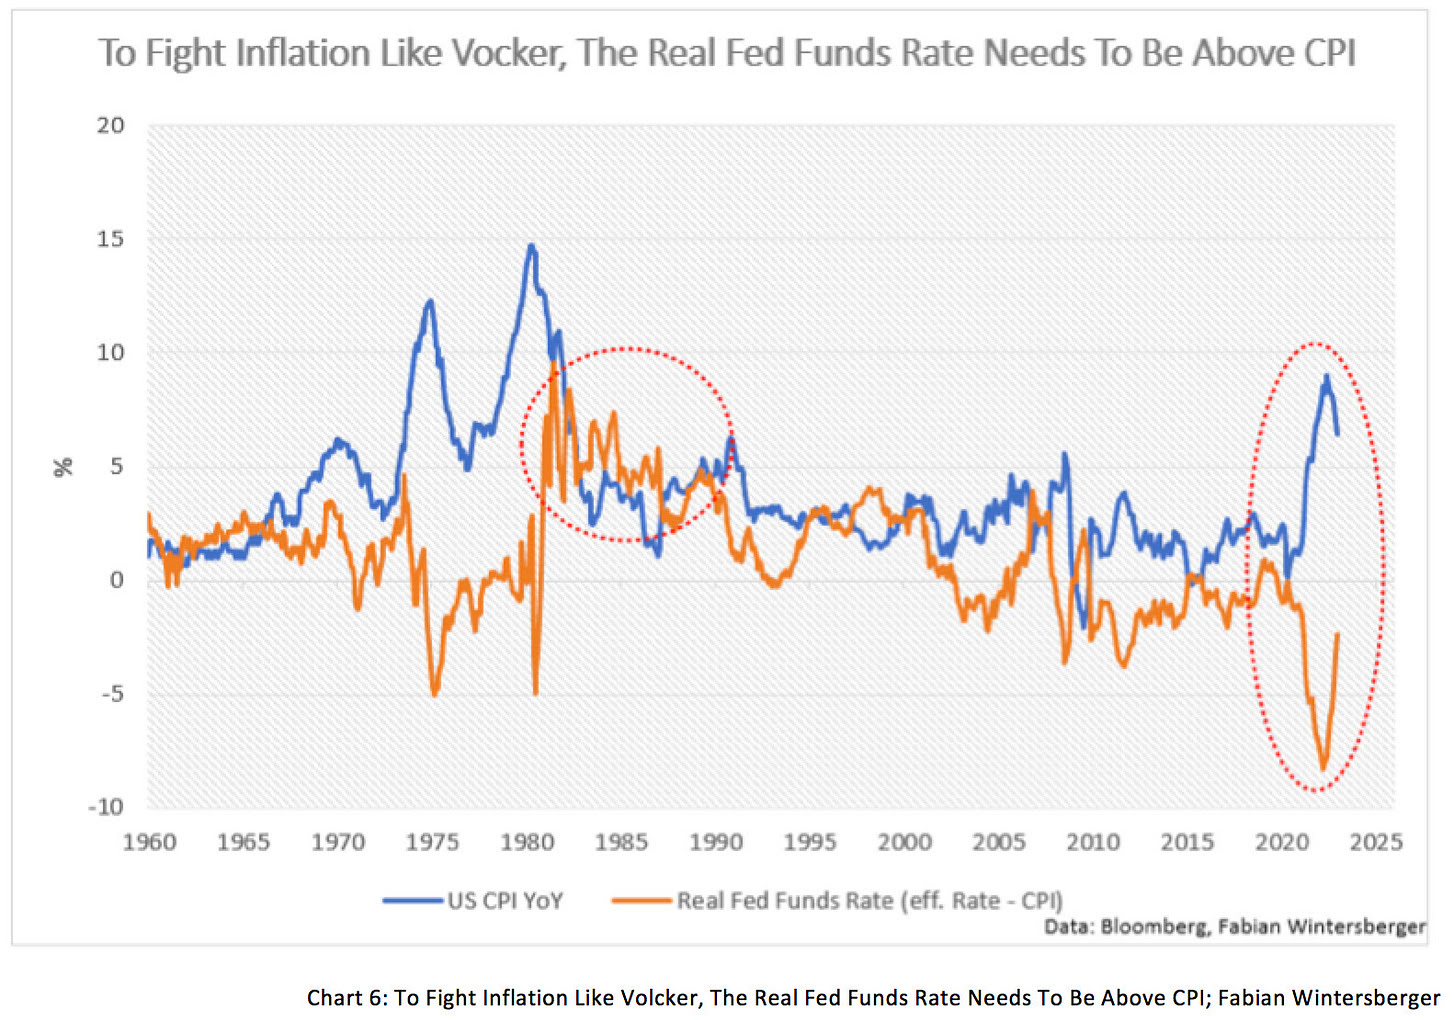
Anyways, strategists think markets are underestimating the Fed which is likely to keep rates higher for longer. There are not enough restrictions to reduce inflation. This would ultimately boost capital costs, leading to earnings misses and lower EPS.
If this market strength is, in part, the result of a so-called front-running of the Fed’s pivot from tightening, either the failure to realize a pivot or an eventual pivot may be followed by the markets selling (i.e., buy the rumor and sell the news scenario).
A chart to tack on here at the end of the section is FINRA margin debt versus the S&P 500 (INDEX: SPX). In short, this measure is not supportive of the move up in stocks. More on this sometime later. Take care!

Technical
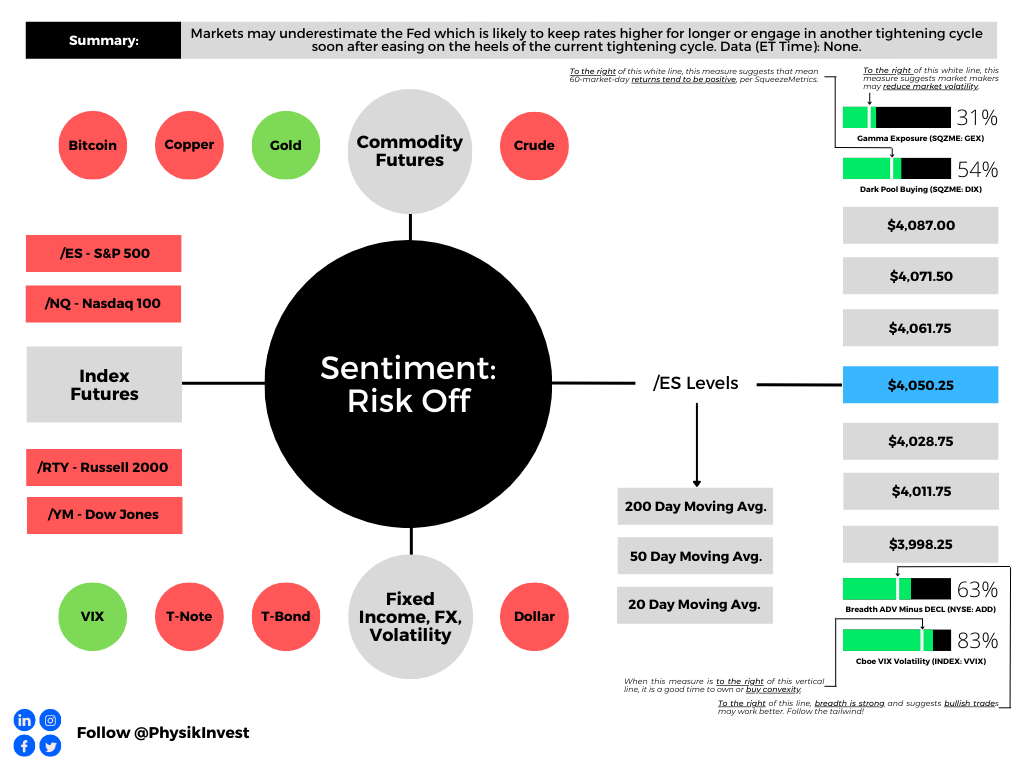
As of 8:45 AM ET, Monday’s regular session (9:30 AM – 4:00 PM ET), in the S&P 500, is likely to open in the lower part of a negatively skewed overnight inventory, outside of the prior range, suggesting a potential for immediate directional opportunity.
The S&P 500 pivot for today is $4,050.25.
Key levels to the upside include $4,061.75, $4,071.50, and $4,087.00.
Key levels to the downside include $4,028.75, $4,011.75, and $3,998.25.
Disclaimer: Click here to load the key levels via the TradingView platform. New links are produced daily. Quoted levels hold weight barring exogenous event.
Definitions
Volume Areas: Markets will build on areas of high-volume (HVNodes). Should the market trend for a period of time, this will be identified by a low-volume area (LVNodes). The LVNodes denote directional conviction and ought to offer support on any test.
If participants auction and find acceptance in an area of a prior LVNode, then future discovery ought to be volatile and quick as participants look to the nearest HVNodes for more favorable entry or exit.
POCs: Areas where two-sided trade was most prevalent in a prior day session. Participants will respond to future tests of value as they offer favorable entry and exit.
About
In short, Renato Leonard Capelj is an economics graduate working in finance and journalism.
Capelj spends most of his time as the founder of Physik Invest through which he invests and publishes daily analyses to subscribers, some of whom represent well-known institutions.
Separately, Capelj is an equity options analyst at SpotGamma and an accredited journalist interviewing global leaders in business, government, and finance.
Past works include conversations with investor Kevin O’Leary, ARK Invest’s Catherine Wood, FTX’s Sam Bankman-Fried, Lithuania’s Minister of Economy and Innovation Aušrinė Armonaitė, former Cisco chairman and CEO John Chambers, and persons at the Clinton Global Initiative.
Contact
Direct queries to renato@physikinvest.com or Renato Capelj#8625 on Discord.
Calendar
You may view this letter’s content calendar at this link.
Disclaimer
Do not construe this newsletter as advice. All content is for informational purposes.


