The pace of recovery from the COVID shock differs across major advanced economies. In contrast to Europe and Japan, U.S. GDP exceeded its pre-COVID level in the third quarter of 2021 and may reach its pre-crisis trend in the fourth quarter. The pace of recovery in Europe in the second and third quarters was still very substantial; as a result, the GDP gap vis-à-vis the U.S. narrowed. But the U.S. stands out in a couple of respects:
- Domestic spending has recovered even faster than GDP because so much of the demand has been for imported goods; the trade deficit has been growing as import growth has been buoyant and exports have been contracting.
- The U.S. fiscal stimulus was large both in absolute terms and relative to other countries.
- The U.S. economy is more services-oriented than some other big economies, and domestic demand has shifted towards goods.
In the charts below, we survey consumption, investment, government spending, and trade for major advanced economies, comparing the most recent data to the fourth quarter of 2019, the last full quarter before the onset of the pandemic.
Europe’s GDP growth spurt has reduced the gap with the U.S.
Economic activity around the world plunged in the first few months of 2020, as the pandemic spread around the world and severe lockdowns were put in place, first in China and then across most advanced economies. The depth of the contraction during the first half of 2020 differed across countries: the UK was hit particularly severely, as were some euro area countries, while the contraction was more moderate in Japan and the U.S. With the re-opening in the third quarter of 2020, GDP levels among the G7 economies grew closer, but during the last quarter of 2020 and the first quarter of 2021, European countries fell further behind the U.S. as lockdowns were imposed to contain the pandemic and vaccine availability lagged relative to the U.S. During the second and third quarters of 2021, however, European economies staged a strong recovery, as a rapid pace of vaccinations was associated with reduced restrictions on mobility and activity. U.S. growth has remained strong, while growth in Japan has stalled, as COVID cases increased.[1] By the end of the third quarter of 2021, the U.S. had surpassed the pre-COVID level of GDP (fourth quarter of 2019). Among larger euro area economies, France has virtually recovered that level of activity, and GDP remains substantially below its pre-COVID level only in Spain, severely affected by the pandemic and the ensuing tourism collapse.
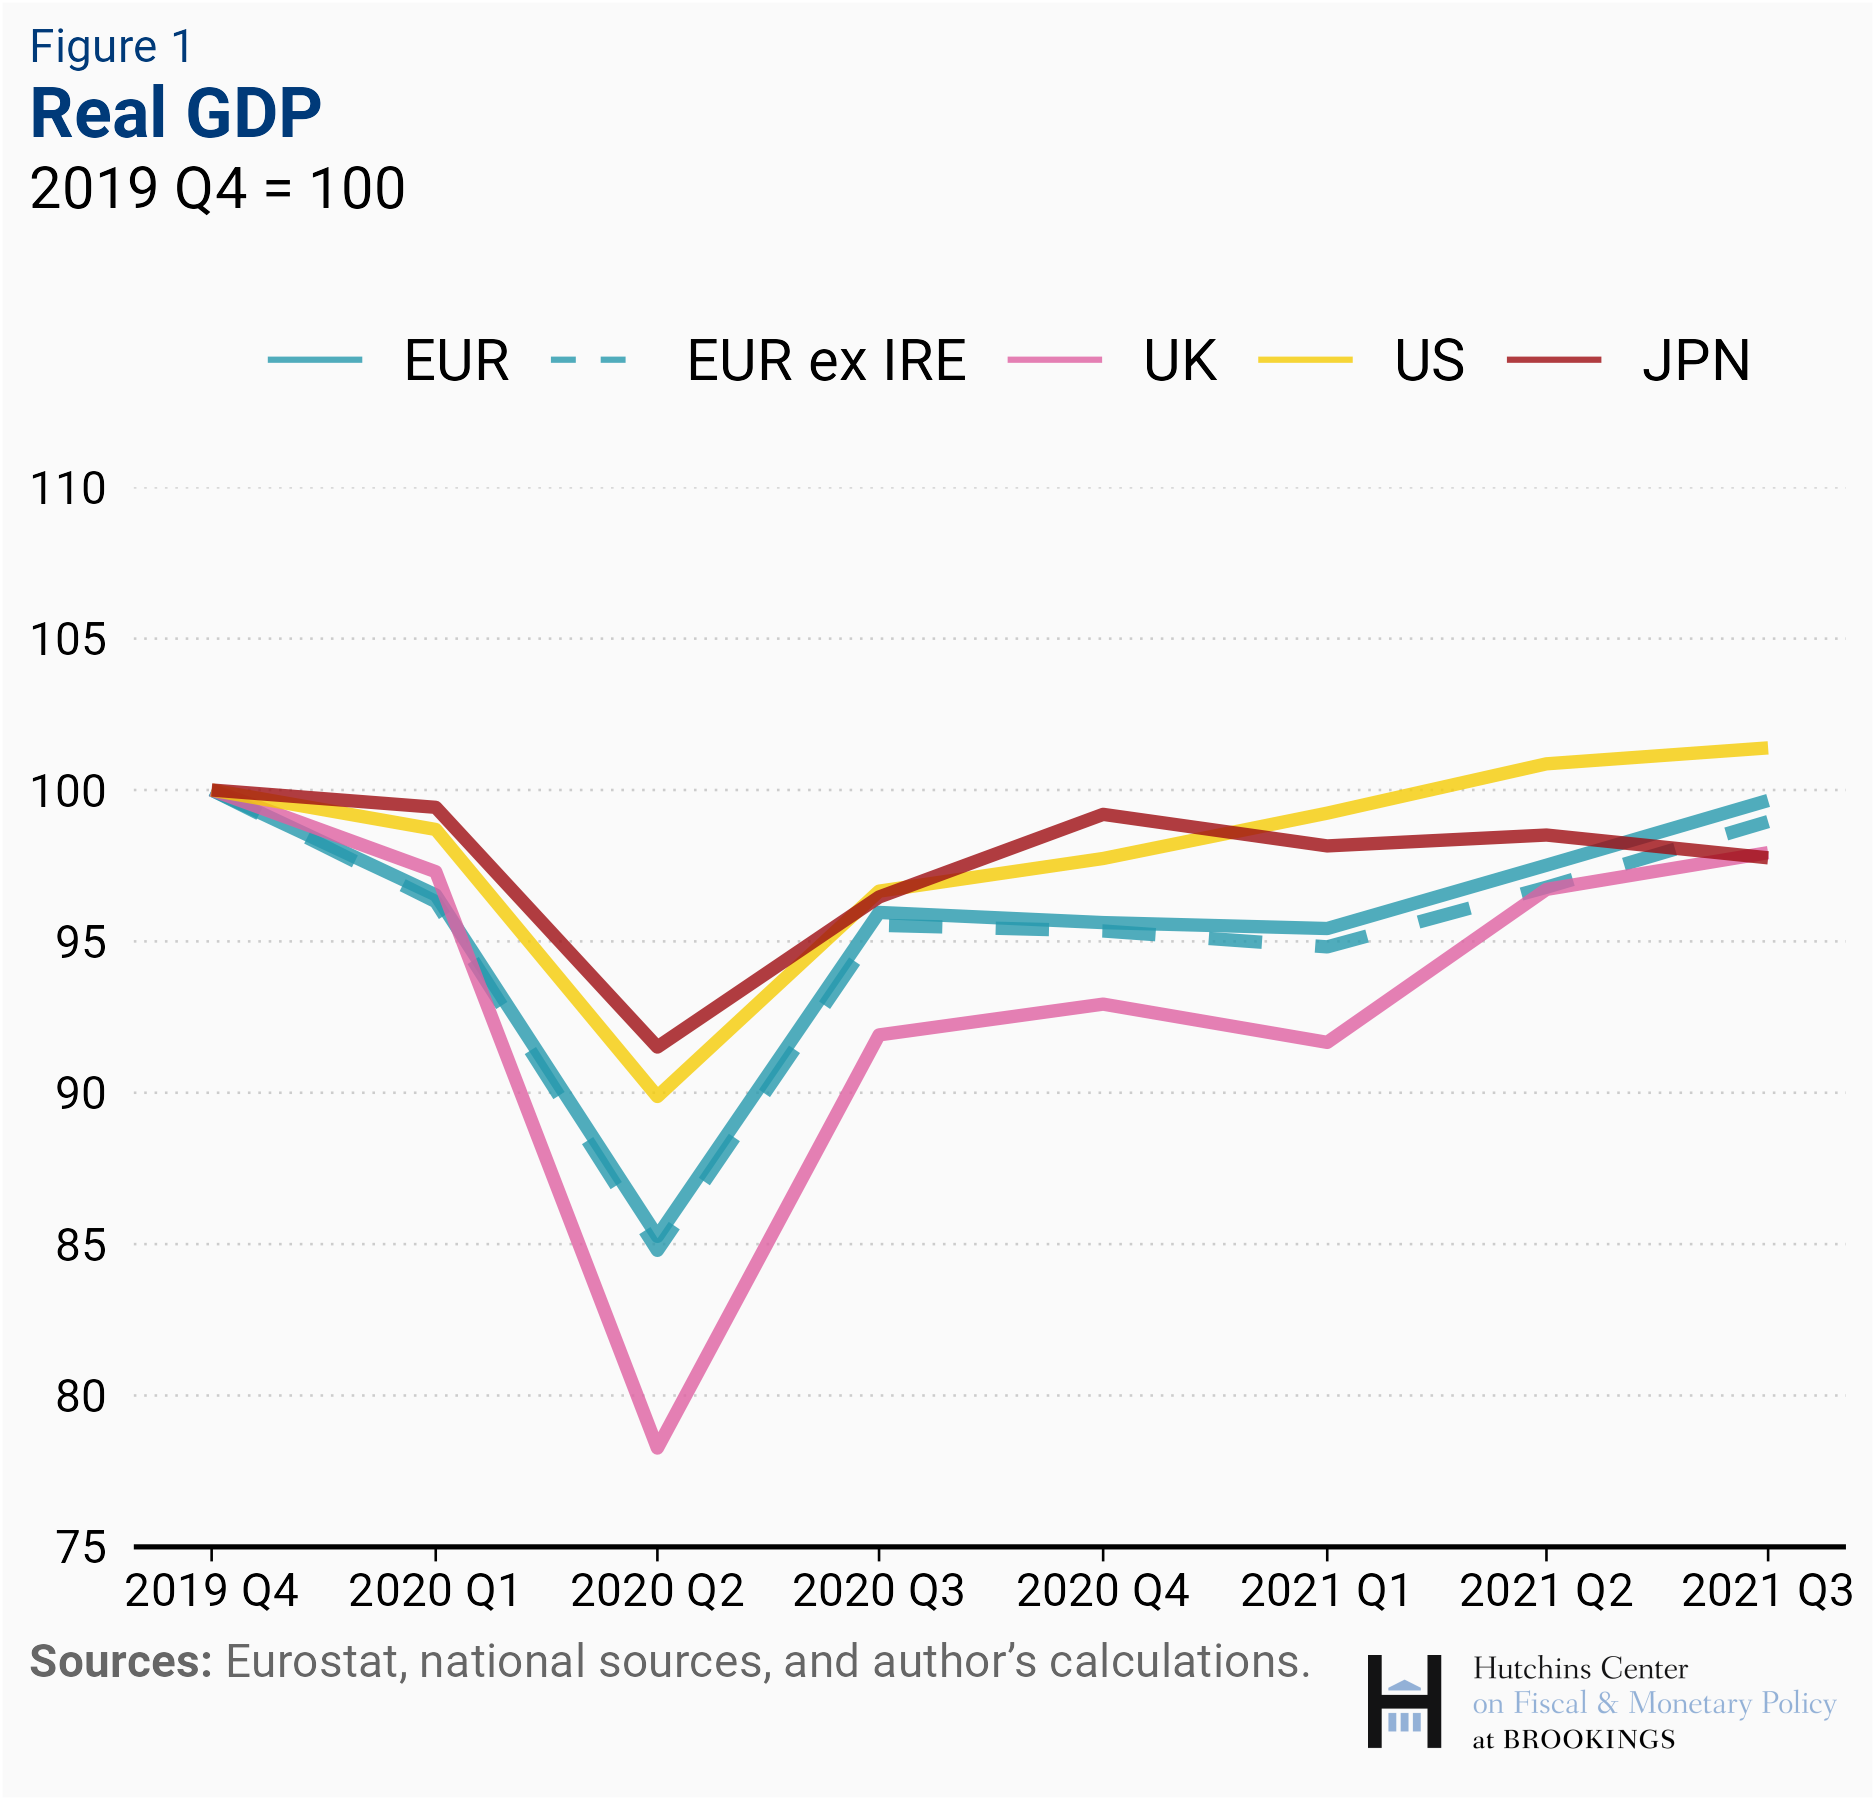
In contrast, most smaller European advanced economies—such as Austria, Belgium, Finland, and the Netherlands in the euro area, as well as Denmark, Norway, Sweden, and Switzerland—have already reached their pre-COVID GDP level. These countries generally had lower exposure to the most affected service sectors. Ditto for smaller advanced economies in Asia. Taiwan—a manufacturing powerhouse—has done particularly well, with GDP in the third quarter exceeding its end-2019 level by 7 percent.
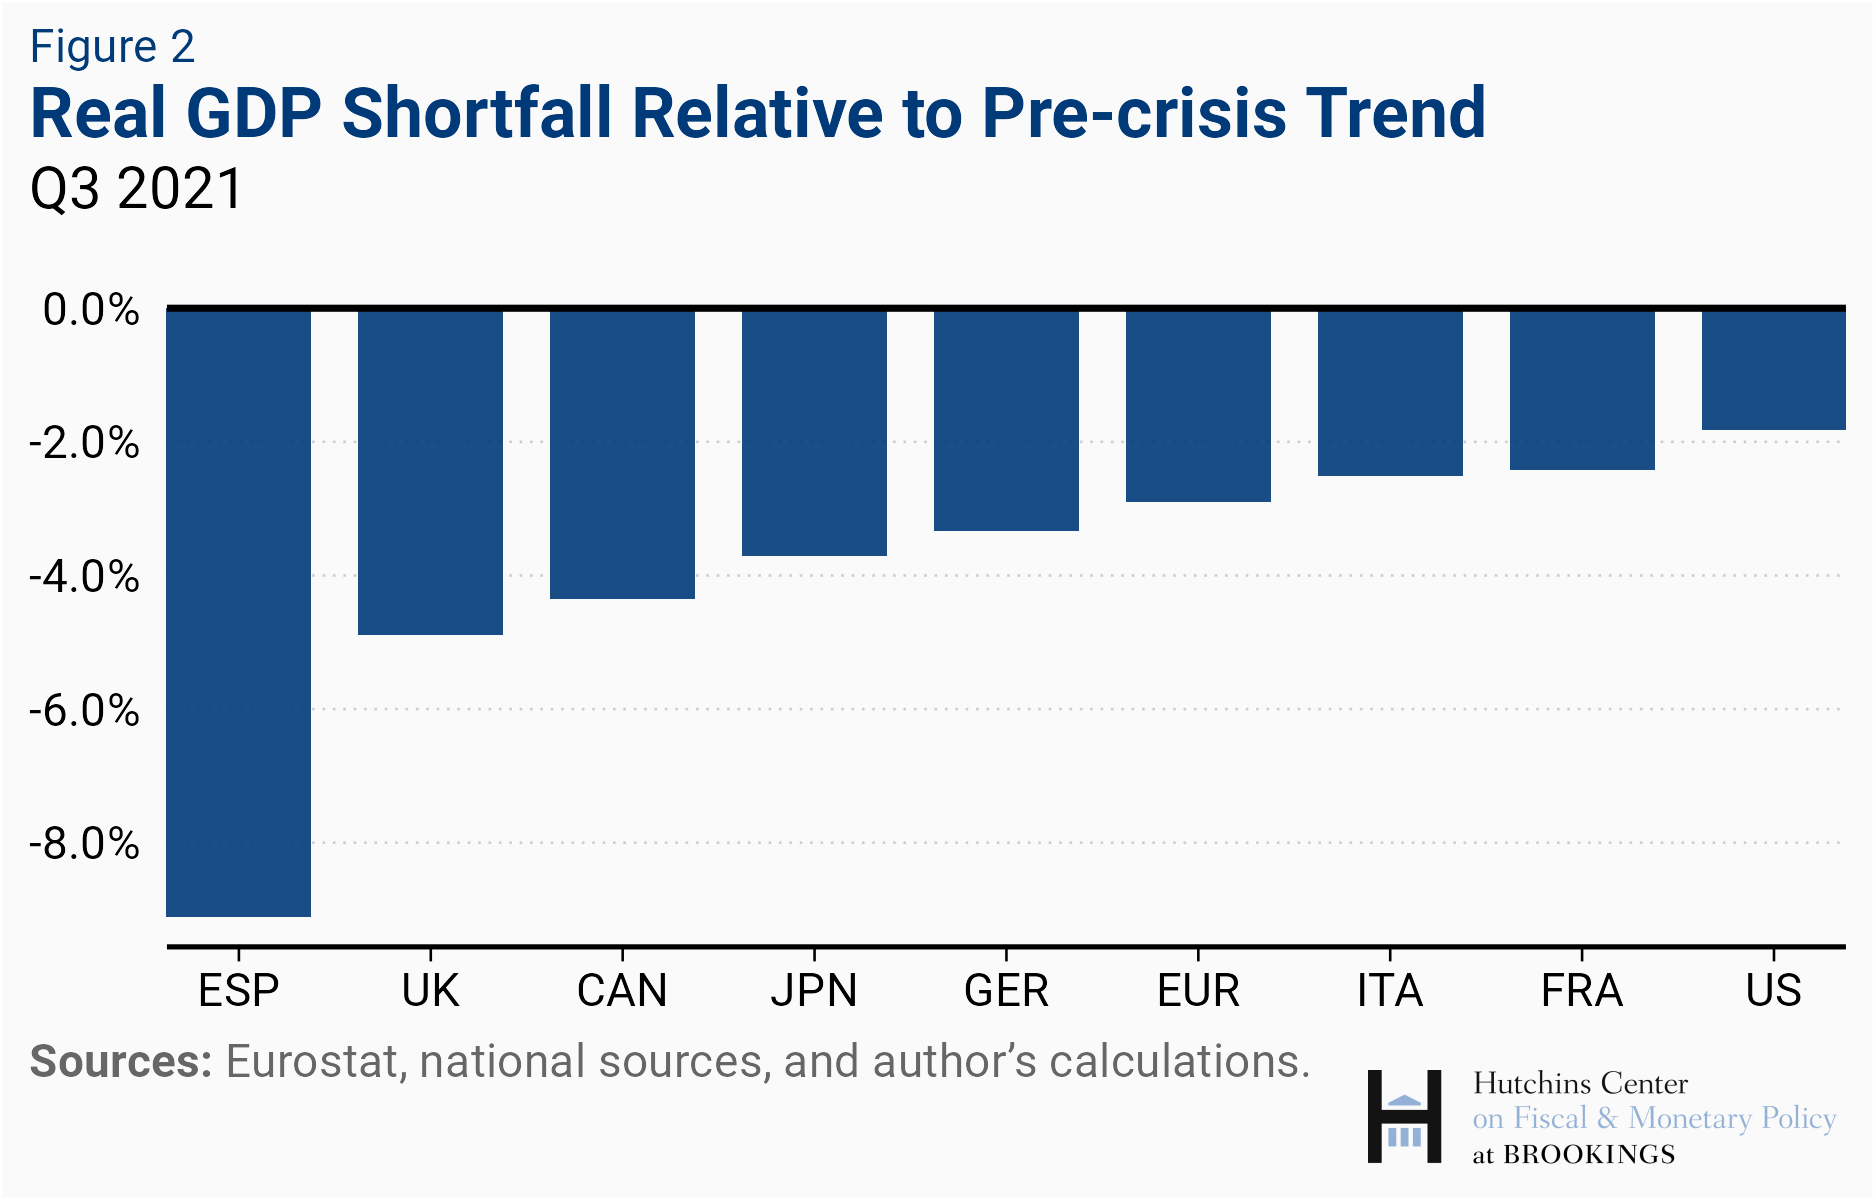
U.S. GDP is closer to pre-COVID trend than other advanced economies
A comparison of GDP levels understates the impact of the crisis because, if not for the pandemic, economies would probably have grown over 2020-21. We therefore compare GDP at the end of the third quarter of 2021 with its pre-crisis trend. With this metric, economic activity in all G7 economies (as well as Spain) has not yet reached its pre-COVID trend. On current projections, the U.S. is expected to reach its pre-COVID trend in the fourth quarter of 2021, with most other countries doing so in 2022. However, a fourth wave of infections and the emergence of the new omicron variant have increased uncertainty about the speed of recovery, especially during the winter months in the Northern Hemisphere.
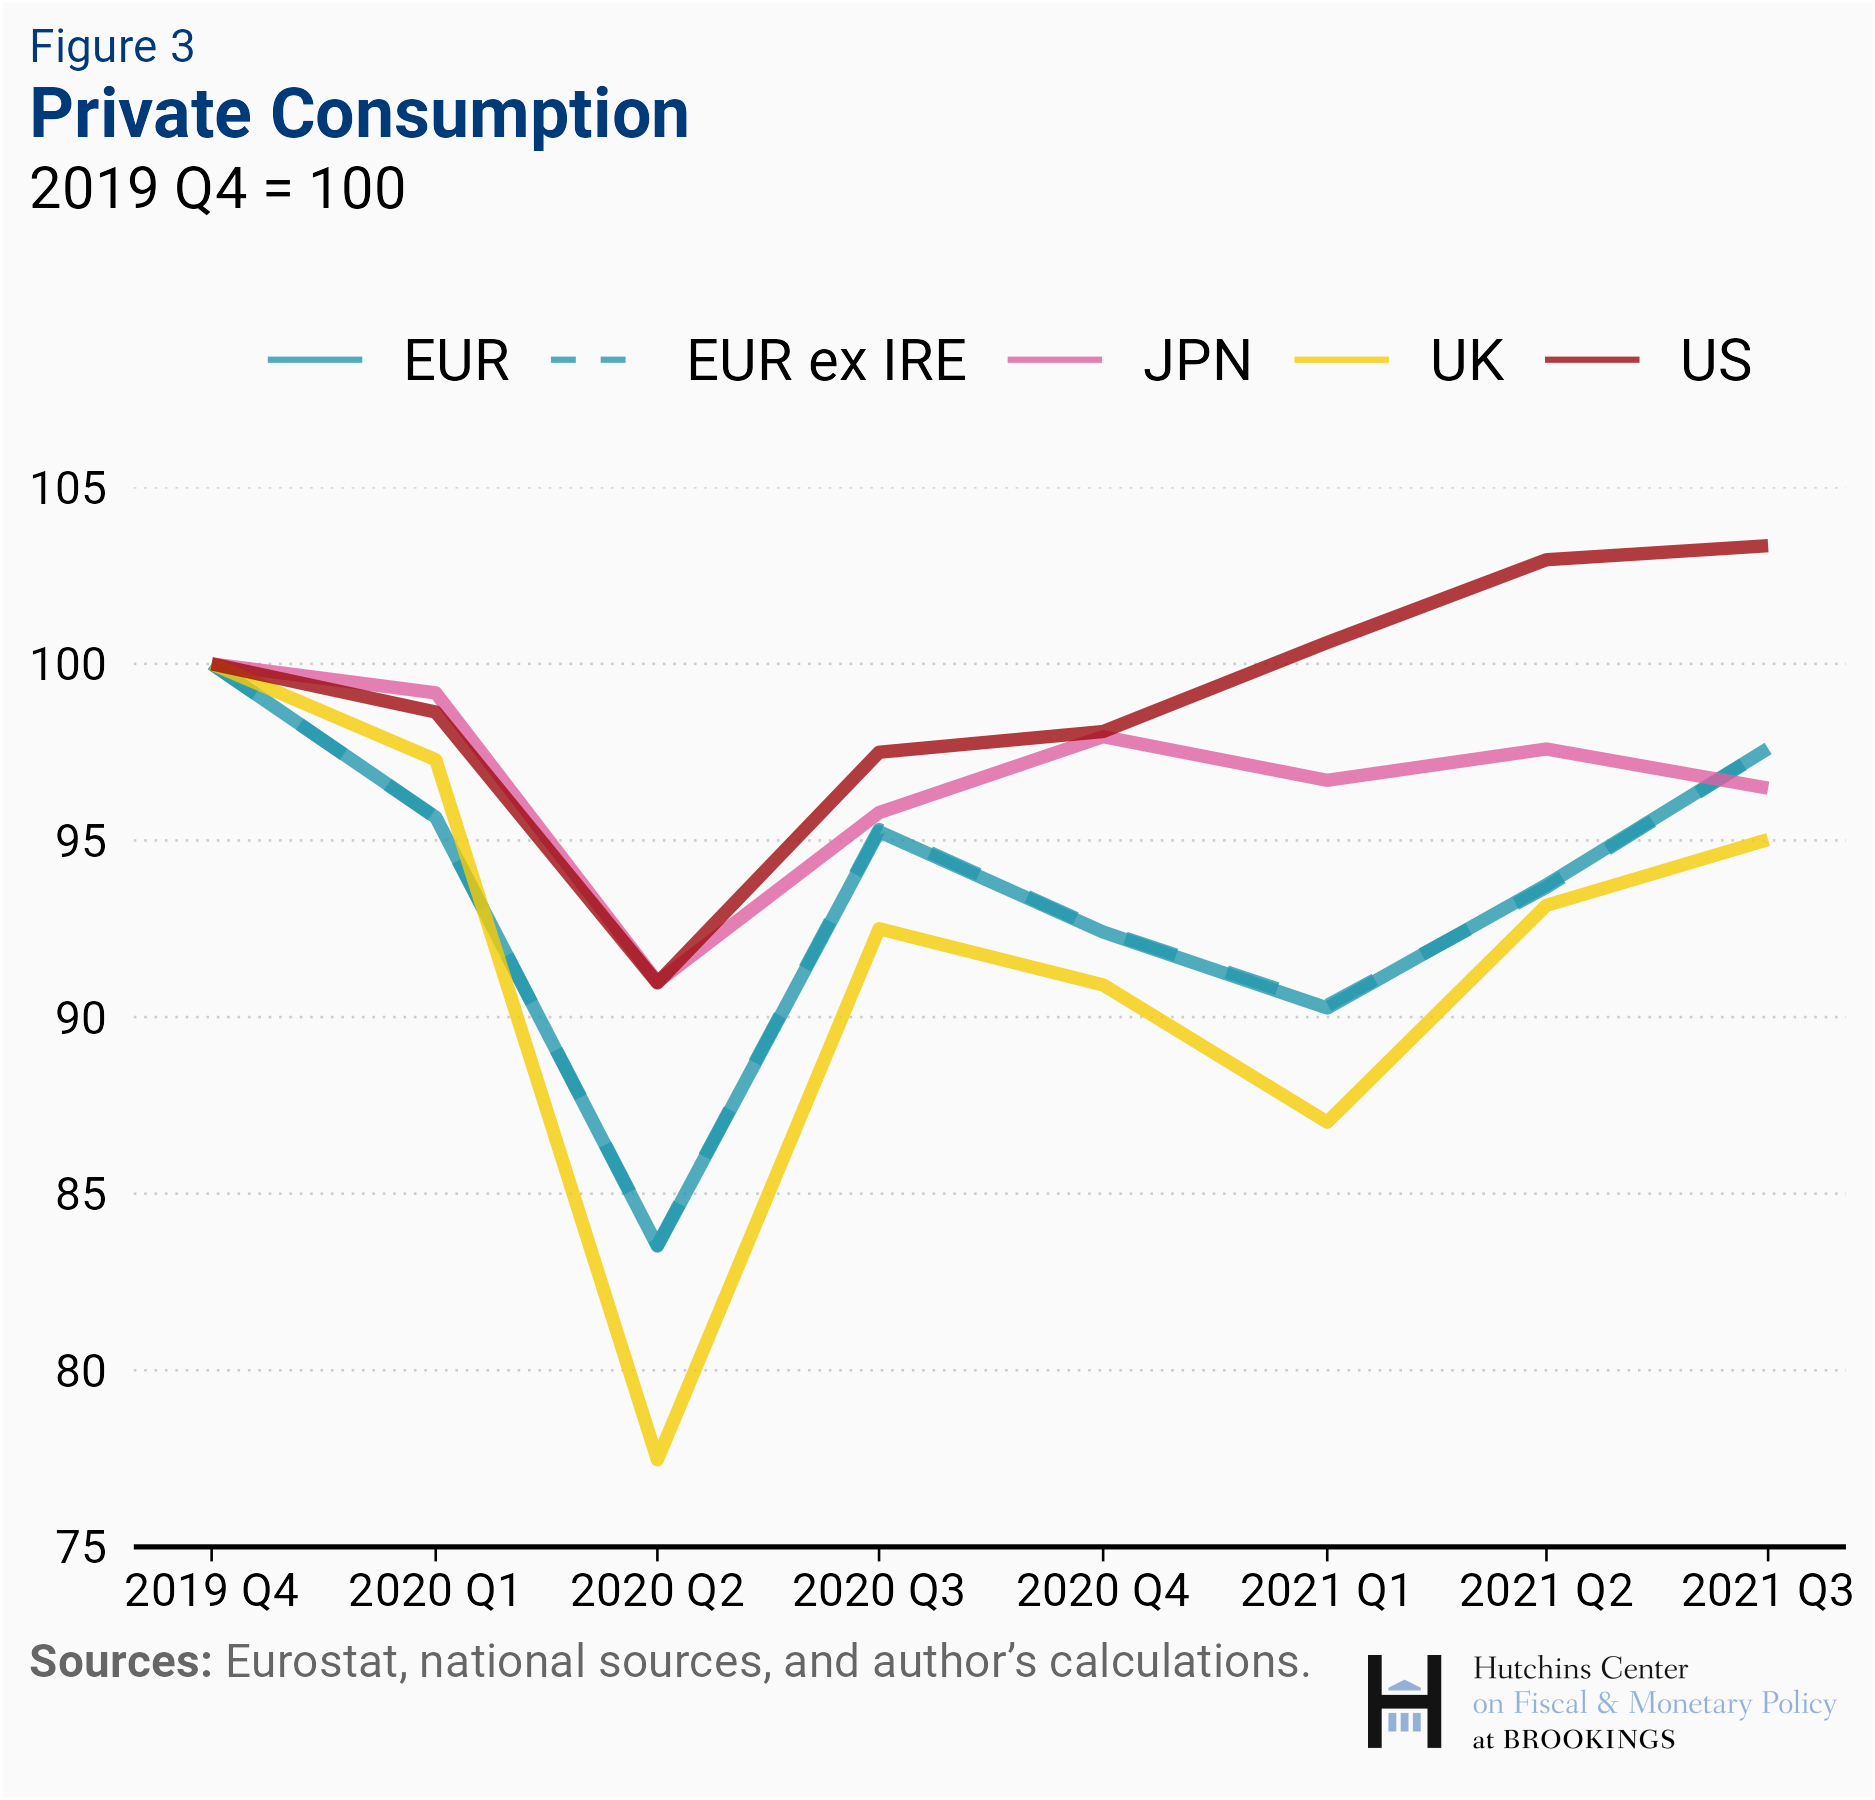
U.S. Consumption Rising Faster Than GDP
Compared to other advanced economies, the recovery in the U.S. stands out because domestic consumer spending has risen so much.[2] As the pandemic curtailed consumption of contact-intensive services around the world, the U.S. consumption of services, despite a very strong rebound, remained in the third quarter of 2021 some 1 ½ percent below its pre-pandemic level while consumption of goods was up by 15 percent. Consumption of durable goods rose more than 20 percent, despite a sharp decline in car purchases in the third quarter driven by supply constraints. The U.S. also faced labor shortages, as labor force participation remained substantially below its pre-pandemic levels despite strong labor demand. In contrast, labor force participation remained broadly stable in other major advanced economies, where ties between firms and workers were generally maintained through furlough schemes. These differences, together with those in the strength of domestic demand, have contributed to stronger inflationary pressures in the U.S. than in other major advanced economies.
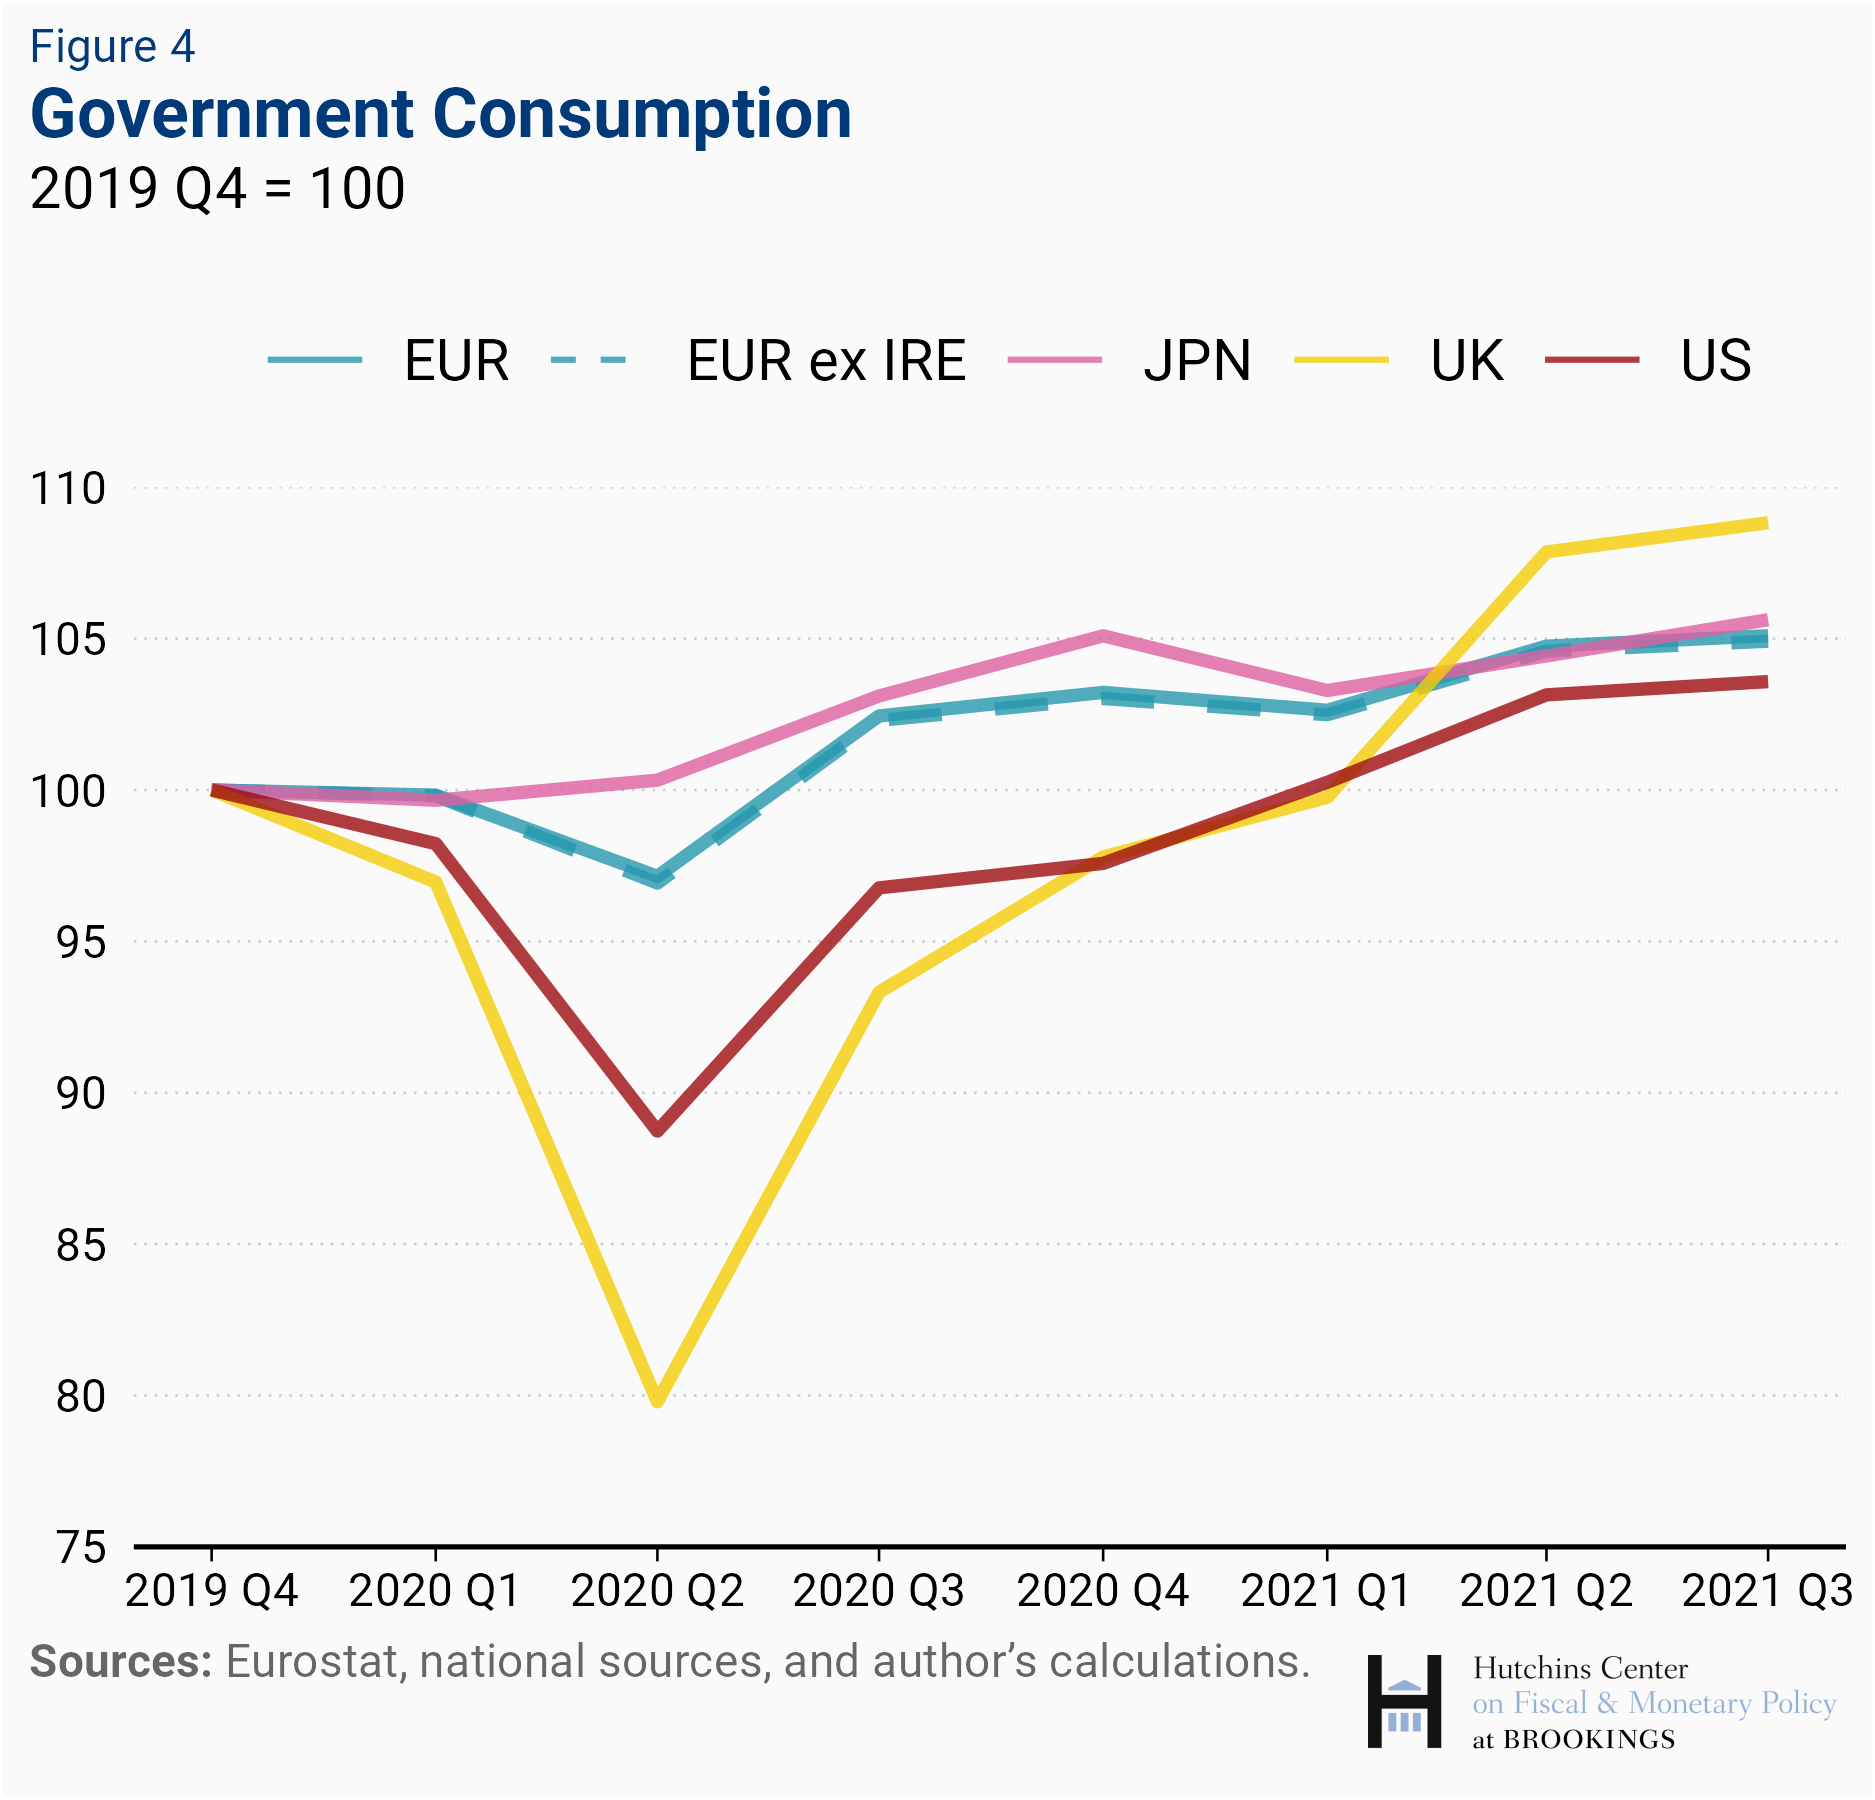
Government consumption up across the board
A common element across all advanced economies has been a rise in government consumption (which includes government wages and salaries and government purchases of goods and services). Note that the increase in the U.S. is slightly more modest because this category does not include government transfers, which were particularly substantial in the U.S. Also, health spending is mostly public in the other countries in the table.
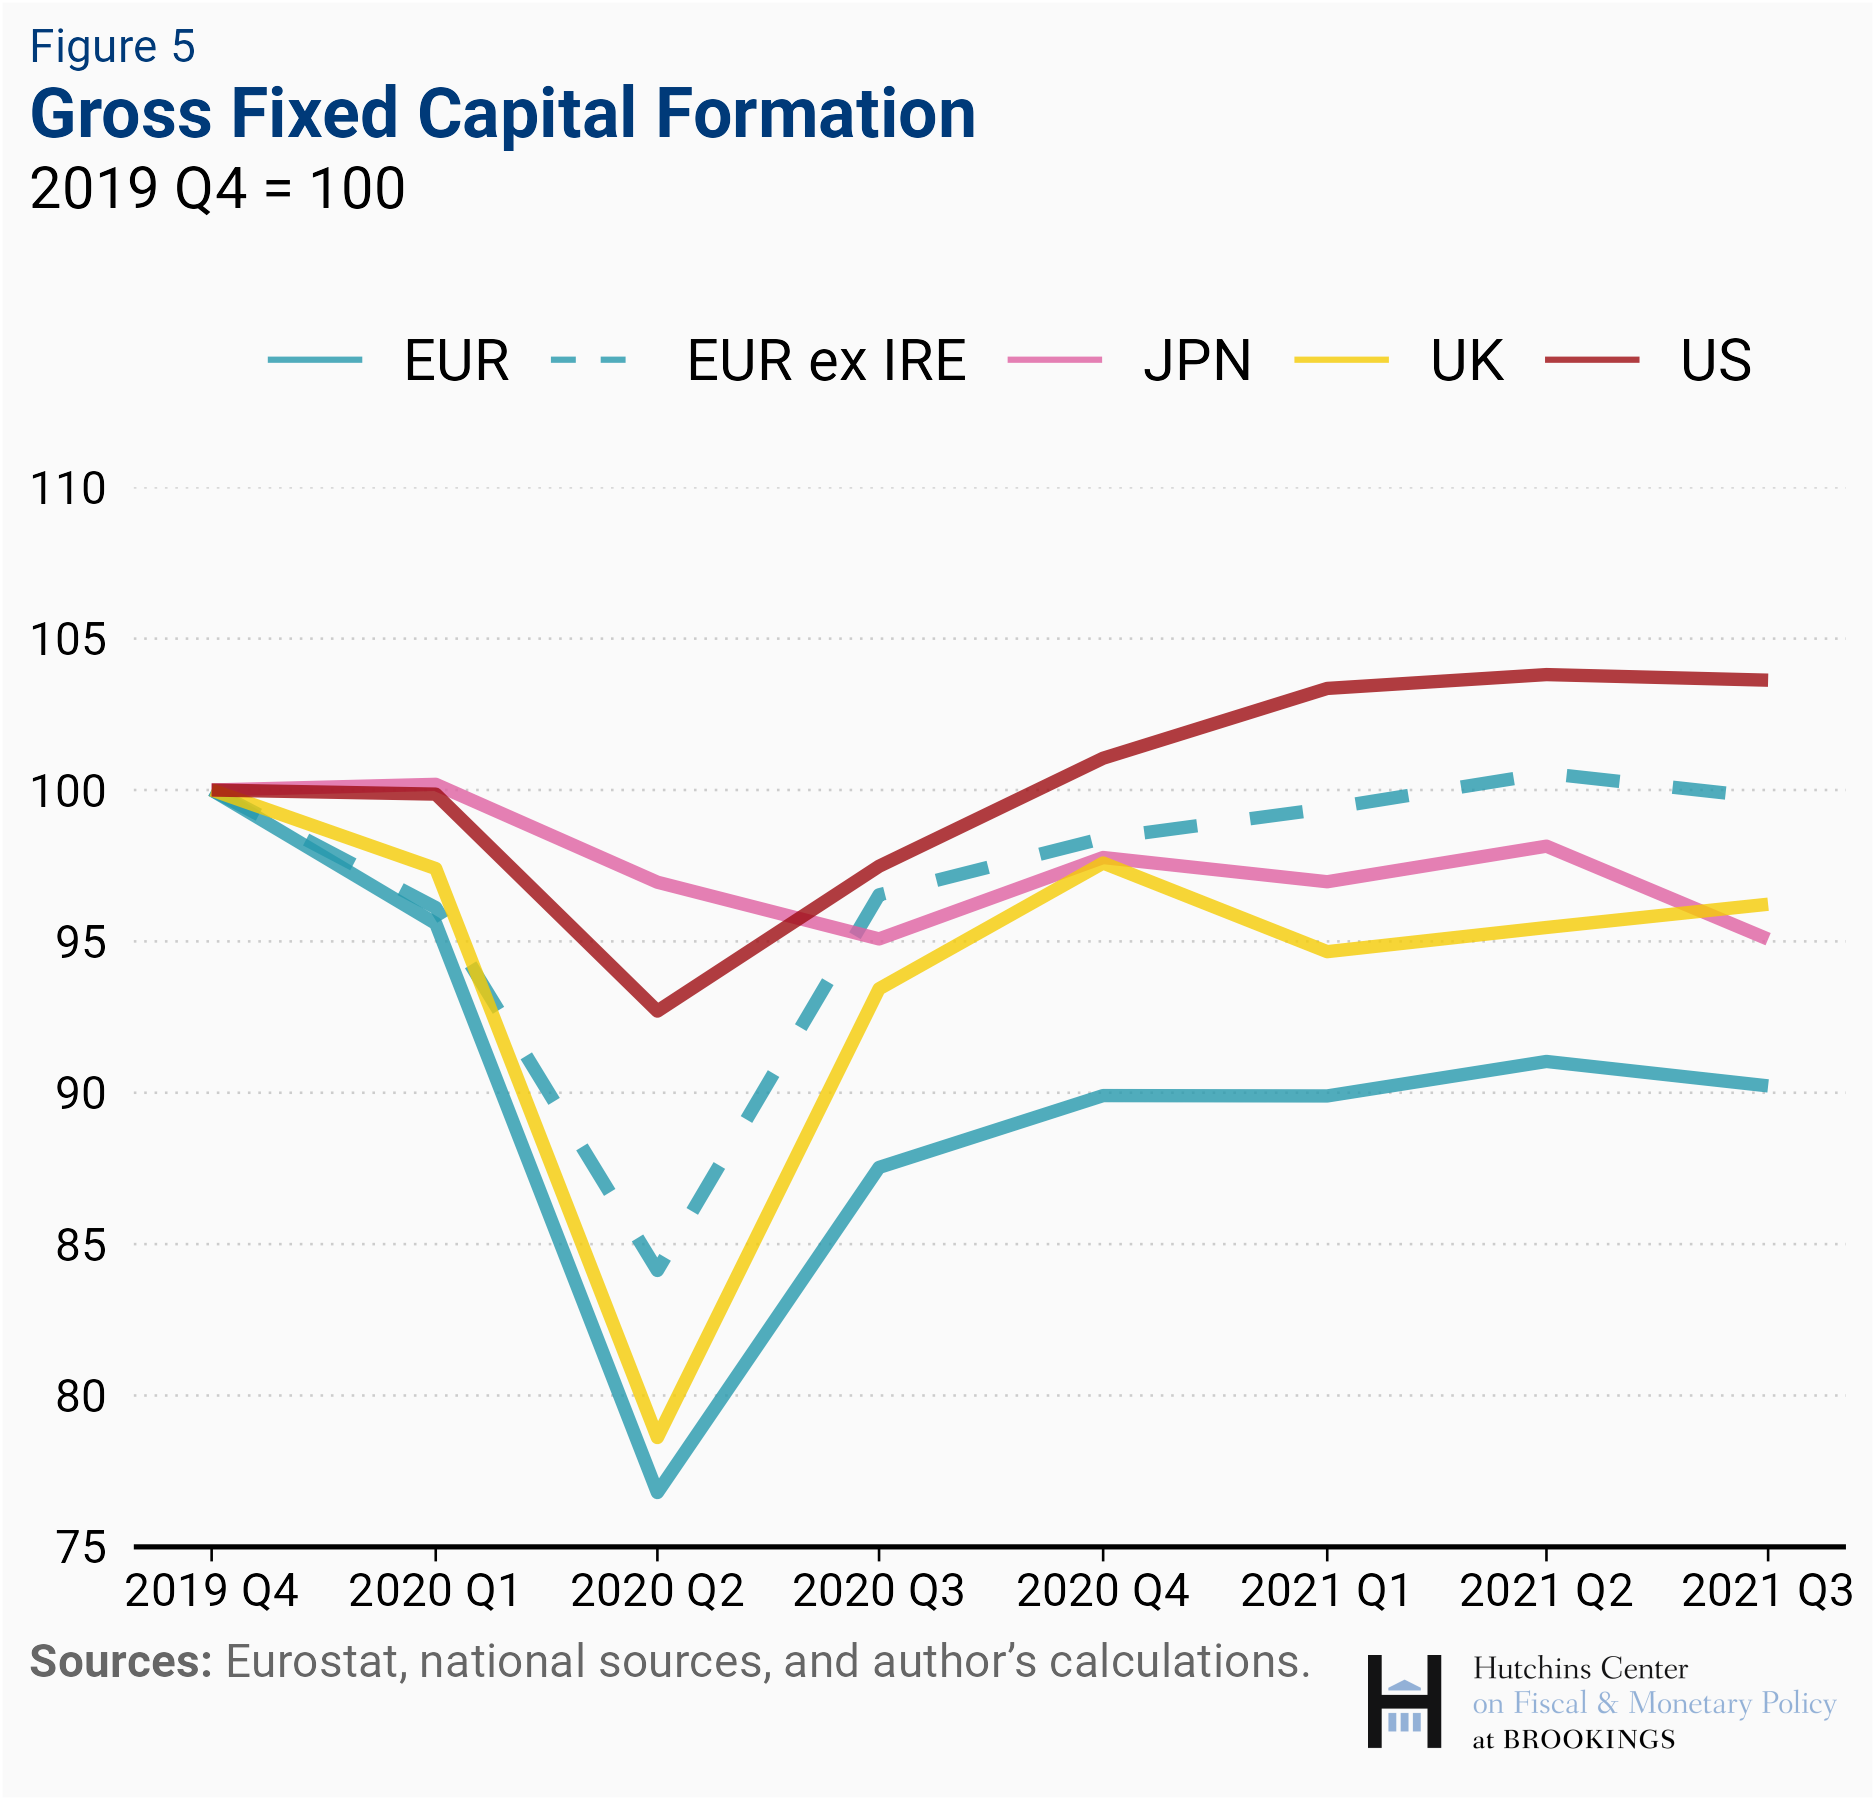
Investment has rebounded, but the capital stock is down
Data on gross fixed capital formation shows a pattern broadly similar to private consumption, with a much stronger contraction in European countries than in the U.S. and Japan. Despite the subsequent recovery, the capital stock remains below its pre-crisis trend, especially in Europe, as new investment has not compensated for the sizable shortfall during the first half of 2020. Lower investment in the transportation sector, affected by the semiconductor shortage and the decline in air travel, is an important reason for the shortfall.
Trade growth: strong demand for goods, supply constraints
While trade in some services—particularly tourism—came to a virtual standstill in 2020 and is only slowly recovering, trade in goods rebounded sharply after an initial decline, as demand for goods has been very strong. Three key factors have shaped the dynamics of exports and imports across countries.
The first is the strength of domestic demand—in the case of private consumption, driven primarily by household disposable income. The hefty size of fiscal stimulus in the United States—in absolute terms and relative to other countries—has played a key role in sustaining U.S. consumption and imports. In turn, the strength of U.S. demand has helped export growth in U.S. trading partners, while the more subdued pace of domestic demand in U.S. trading partners is one factor holding back U.S. exports.
The second factor is the composition of economic activity pre-COVID—countries where manufacturing is a more important share of GDP have generally benefited from an increase in foreign demand, given the nature of the shock which has shifted spending from services to goods, while countries relying to an important extent on exports of services (think of tourism exports for countries such as Greece, Portugal, and Spain) have been hurt.
The third factor is supply constraints, which have affected goods’ production across the world. These have been triggered by a variety of factors, including reduced production and orders during the initial downturn, subsequent COVID-related shutdowns, and the unexpectedly rapid rebound in demand. For instance, constraints in the availability of semiconductors have put a dent in global production of a variety of goods, such as autos, and affected exports in advanced economies, especially in the third quarter. Globally, firms facing supply bottlenecks accommodated strong demand by running down inventories, which are particularly low, and inflationary pressures increased across the globe, with soaring commodity prices and goods prices rising notably after a long period of stability.
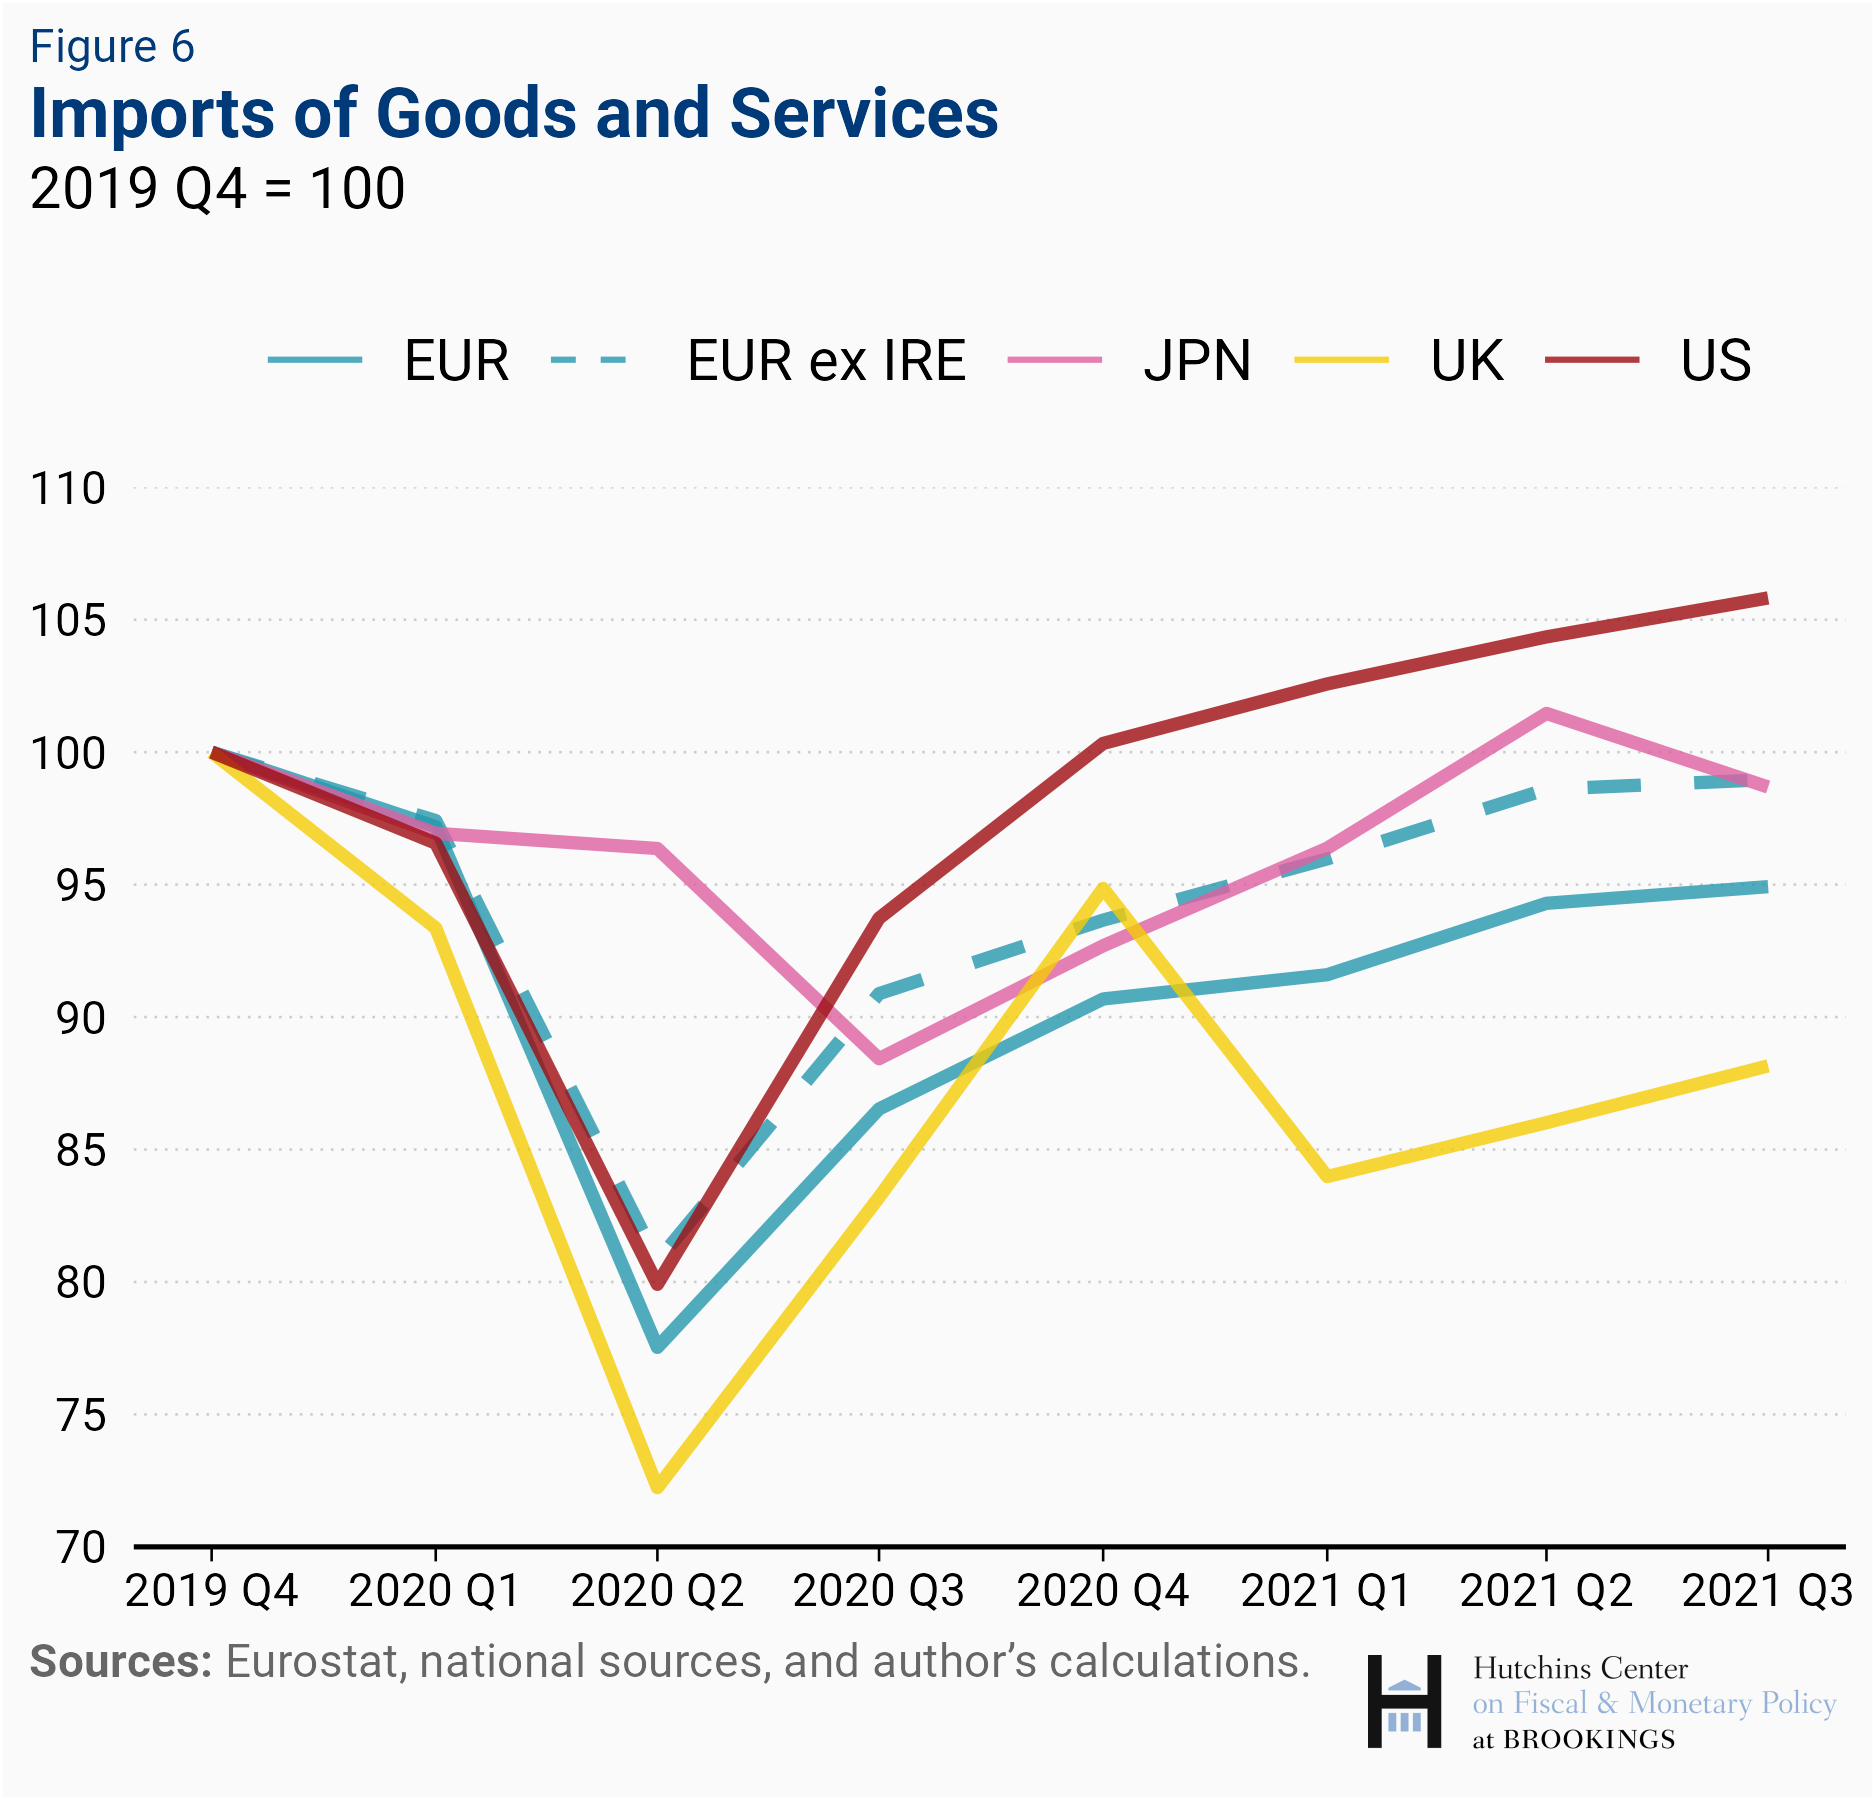
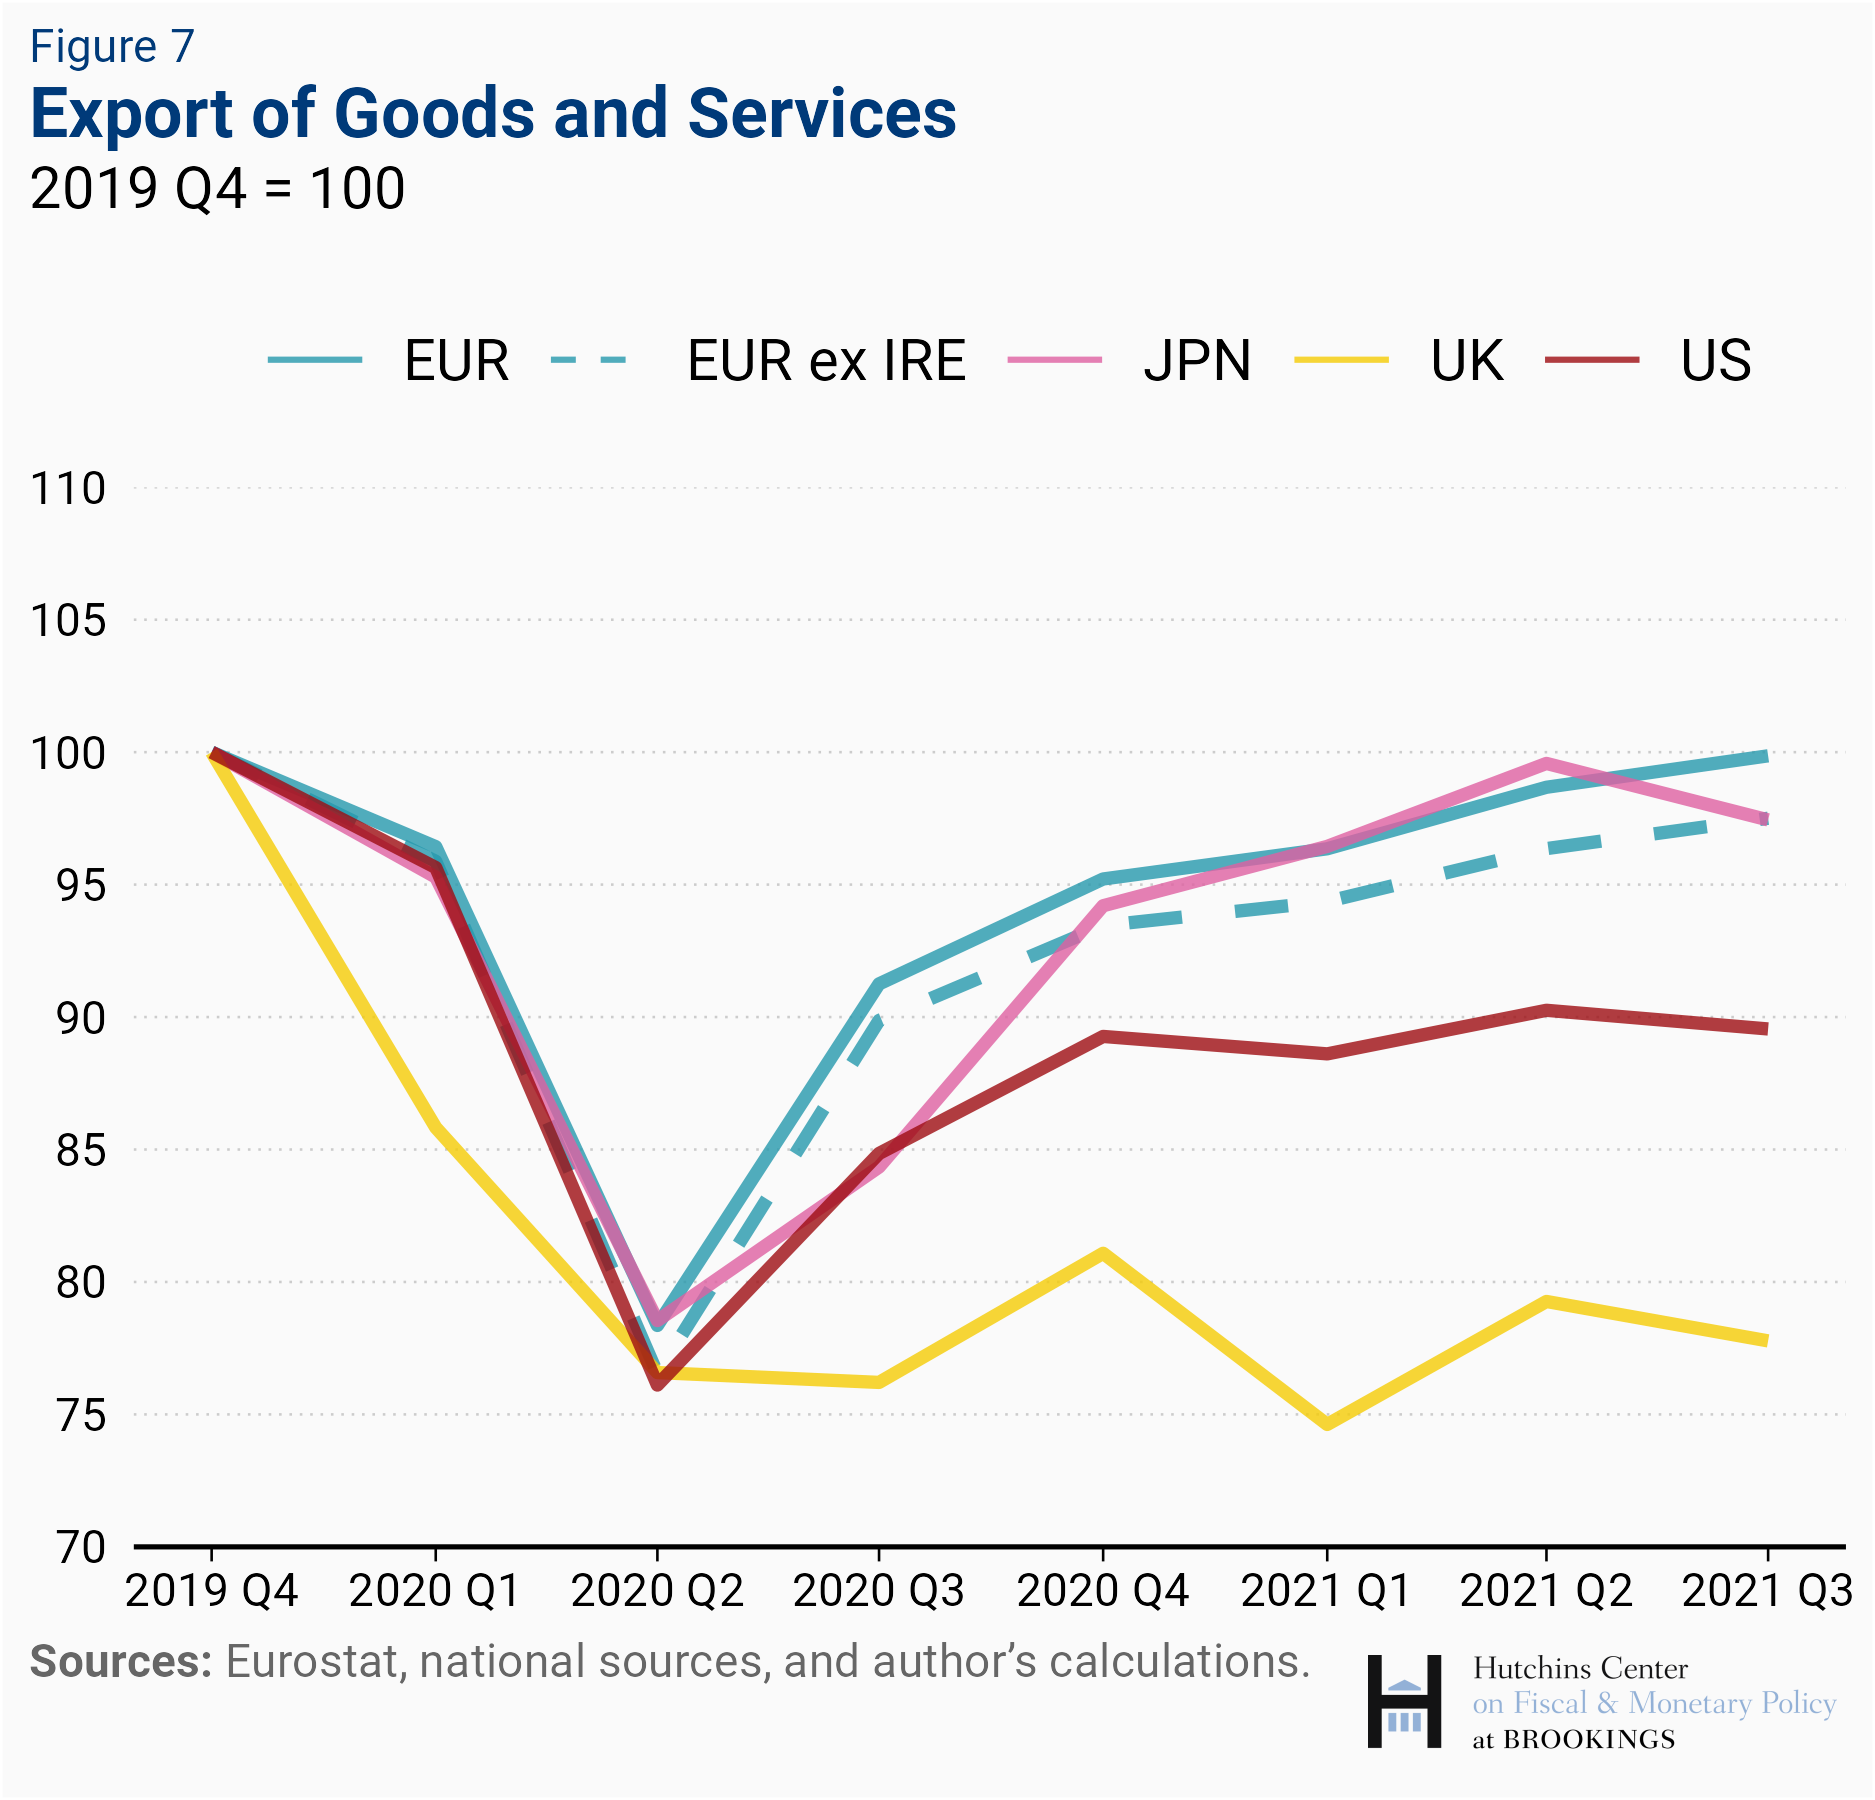
Overall, looking across all advanced economies, exports have been weaker than imports.[3] In contrast, exports have grown faster than imports in China and other economies in emerging Asia. Chinese exports of manufactured goods have benefited greatly from shifts in global demand, while Chinese imports of services, which were particularly substantial for travel (both tourism and education expenditures) plummeted with the closure of borders.
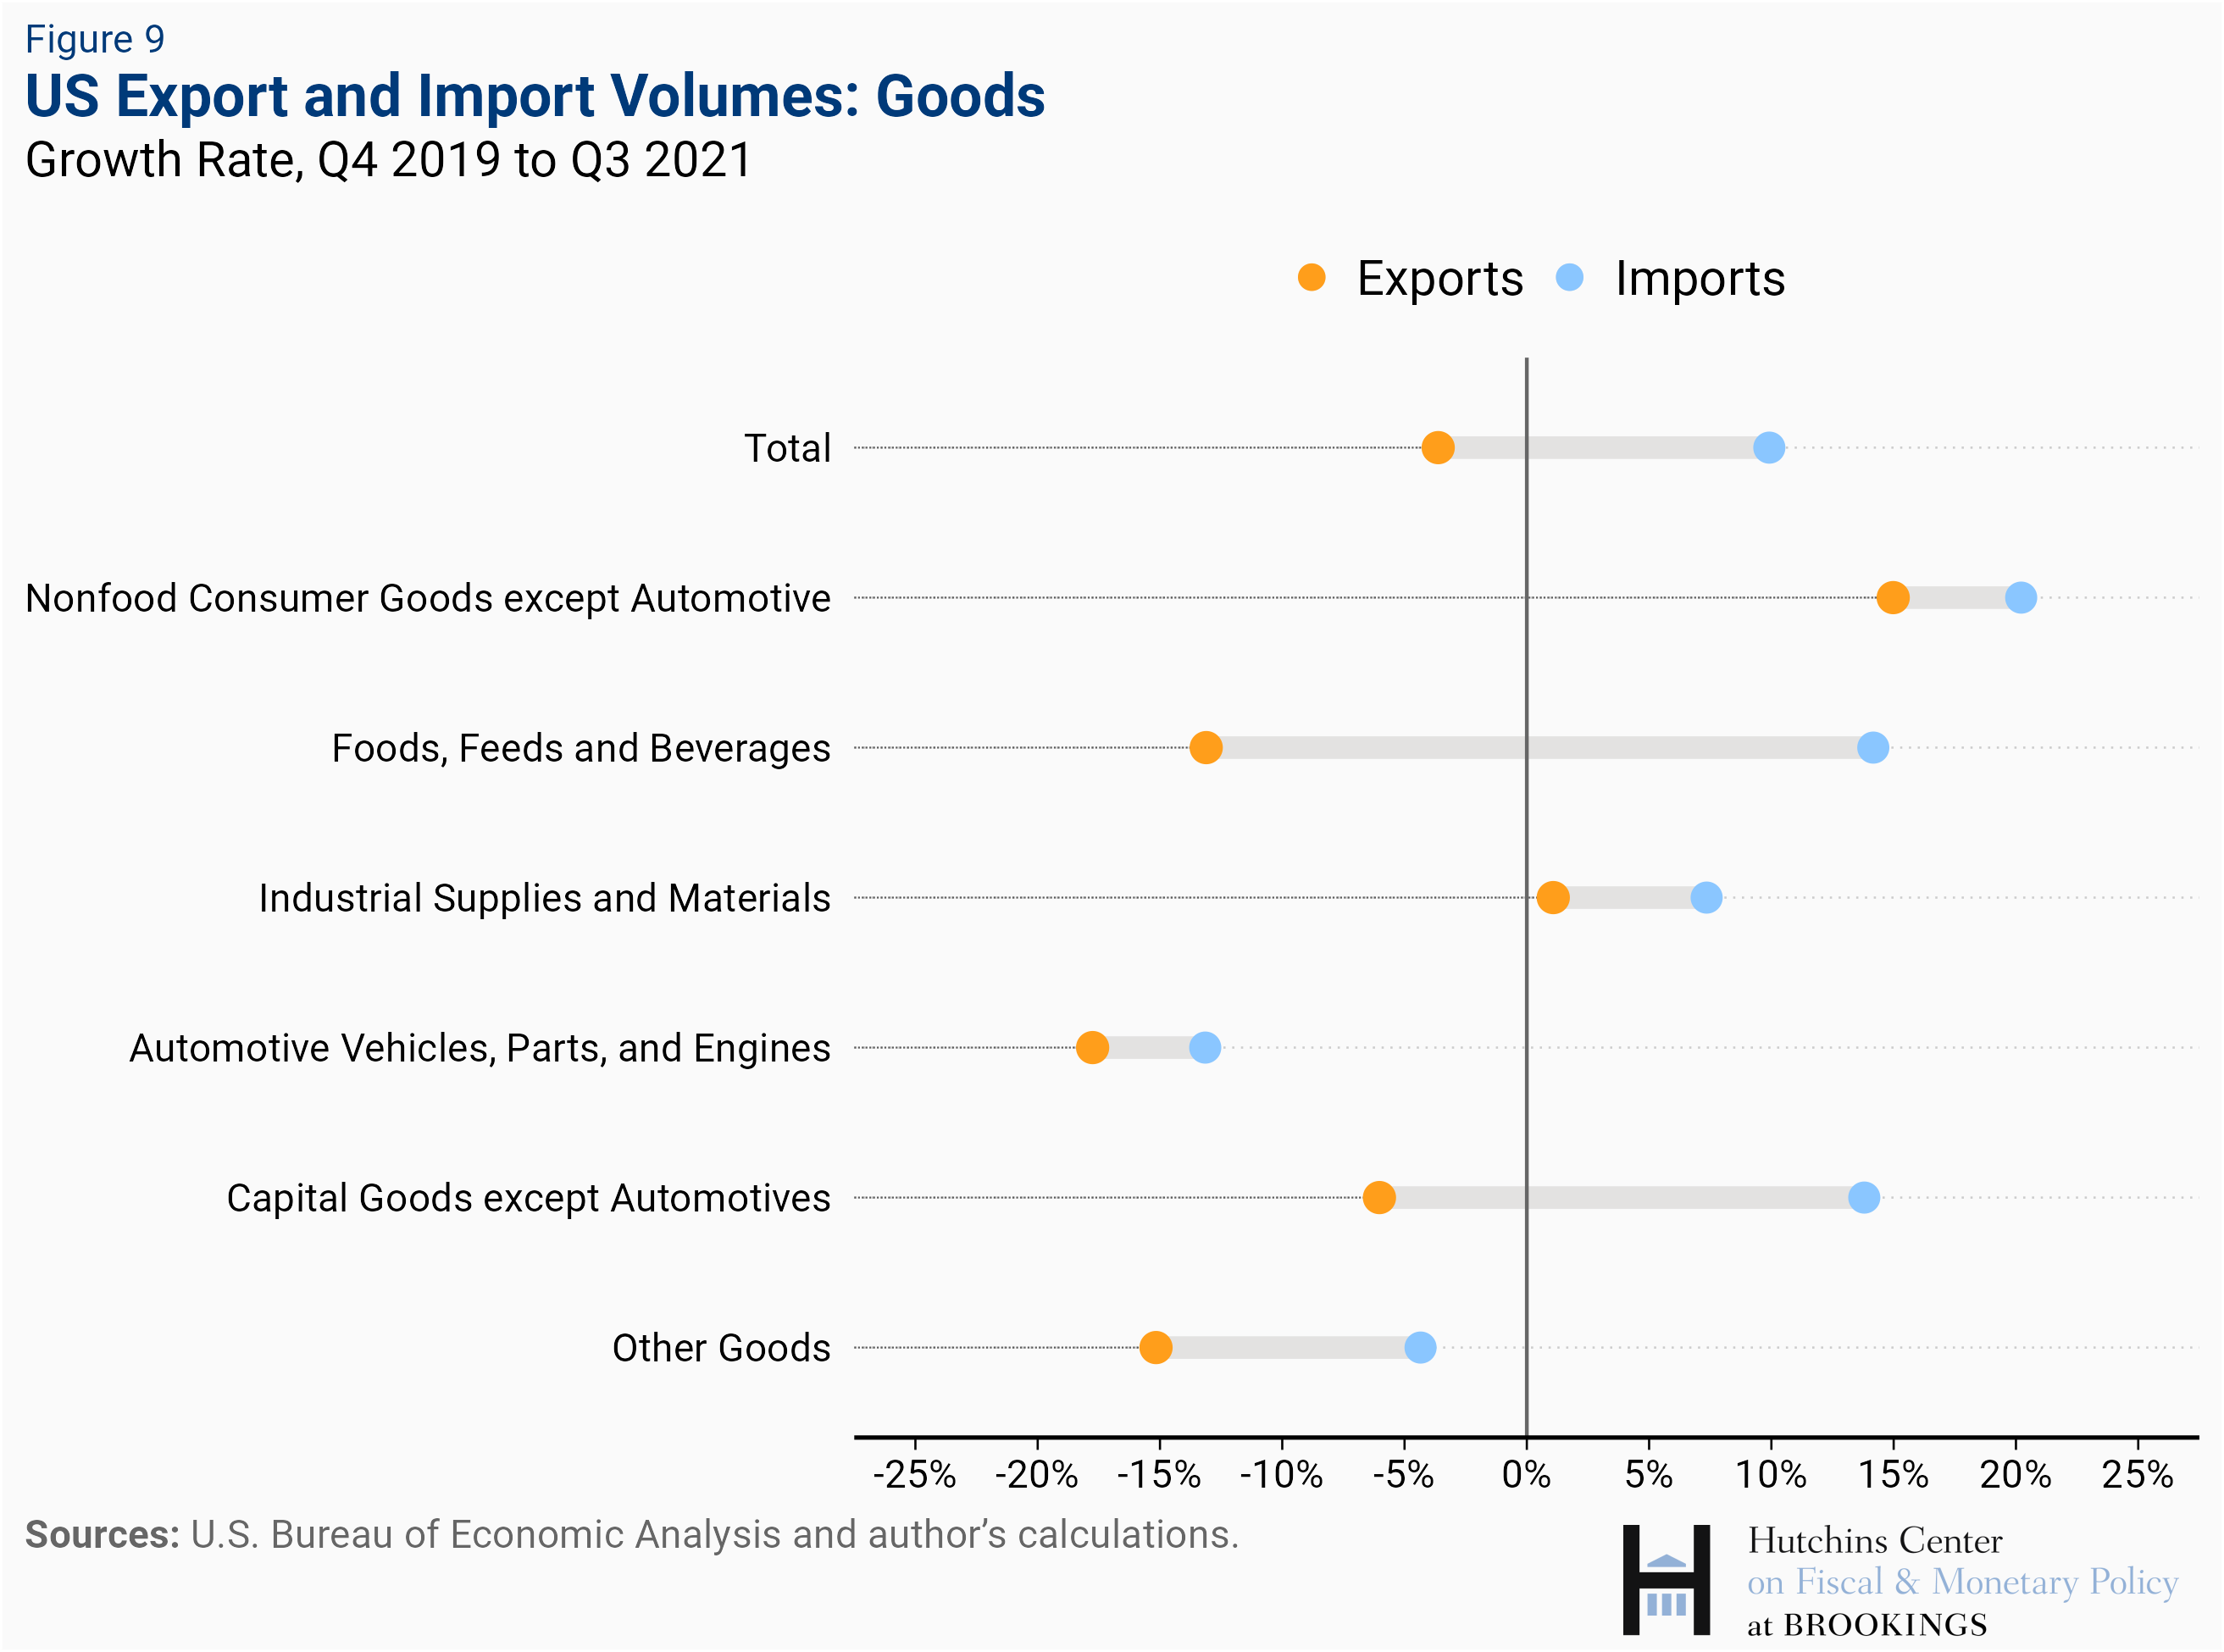
U.S. consumption recovery boosts imports of consumer goods
The composition of U.S. trade provides an additional explanation for the different dynamics of exports and imports, over and above the difference in the growth rate of domestic demand in the U.S. relative to its trading partners. Specifically, the U.S. is a net importer of goods and a net exporter of services, and consumer products account for a larger share of imports of goods relative to exports.
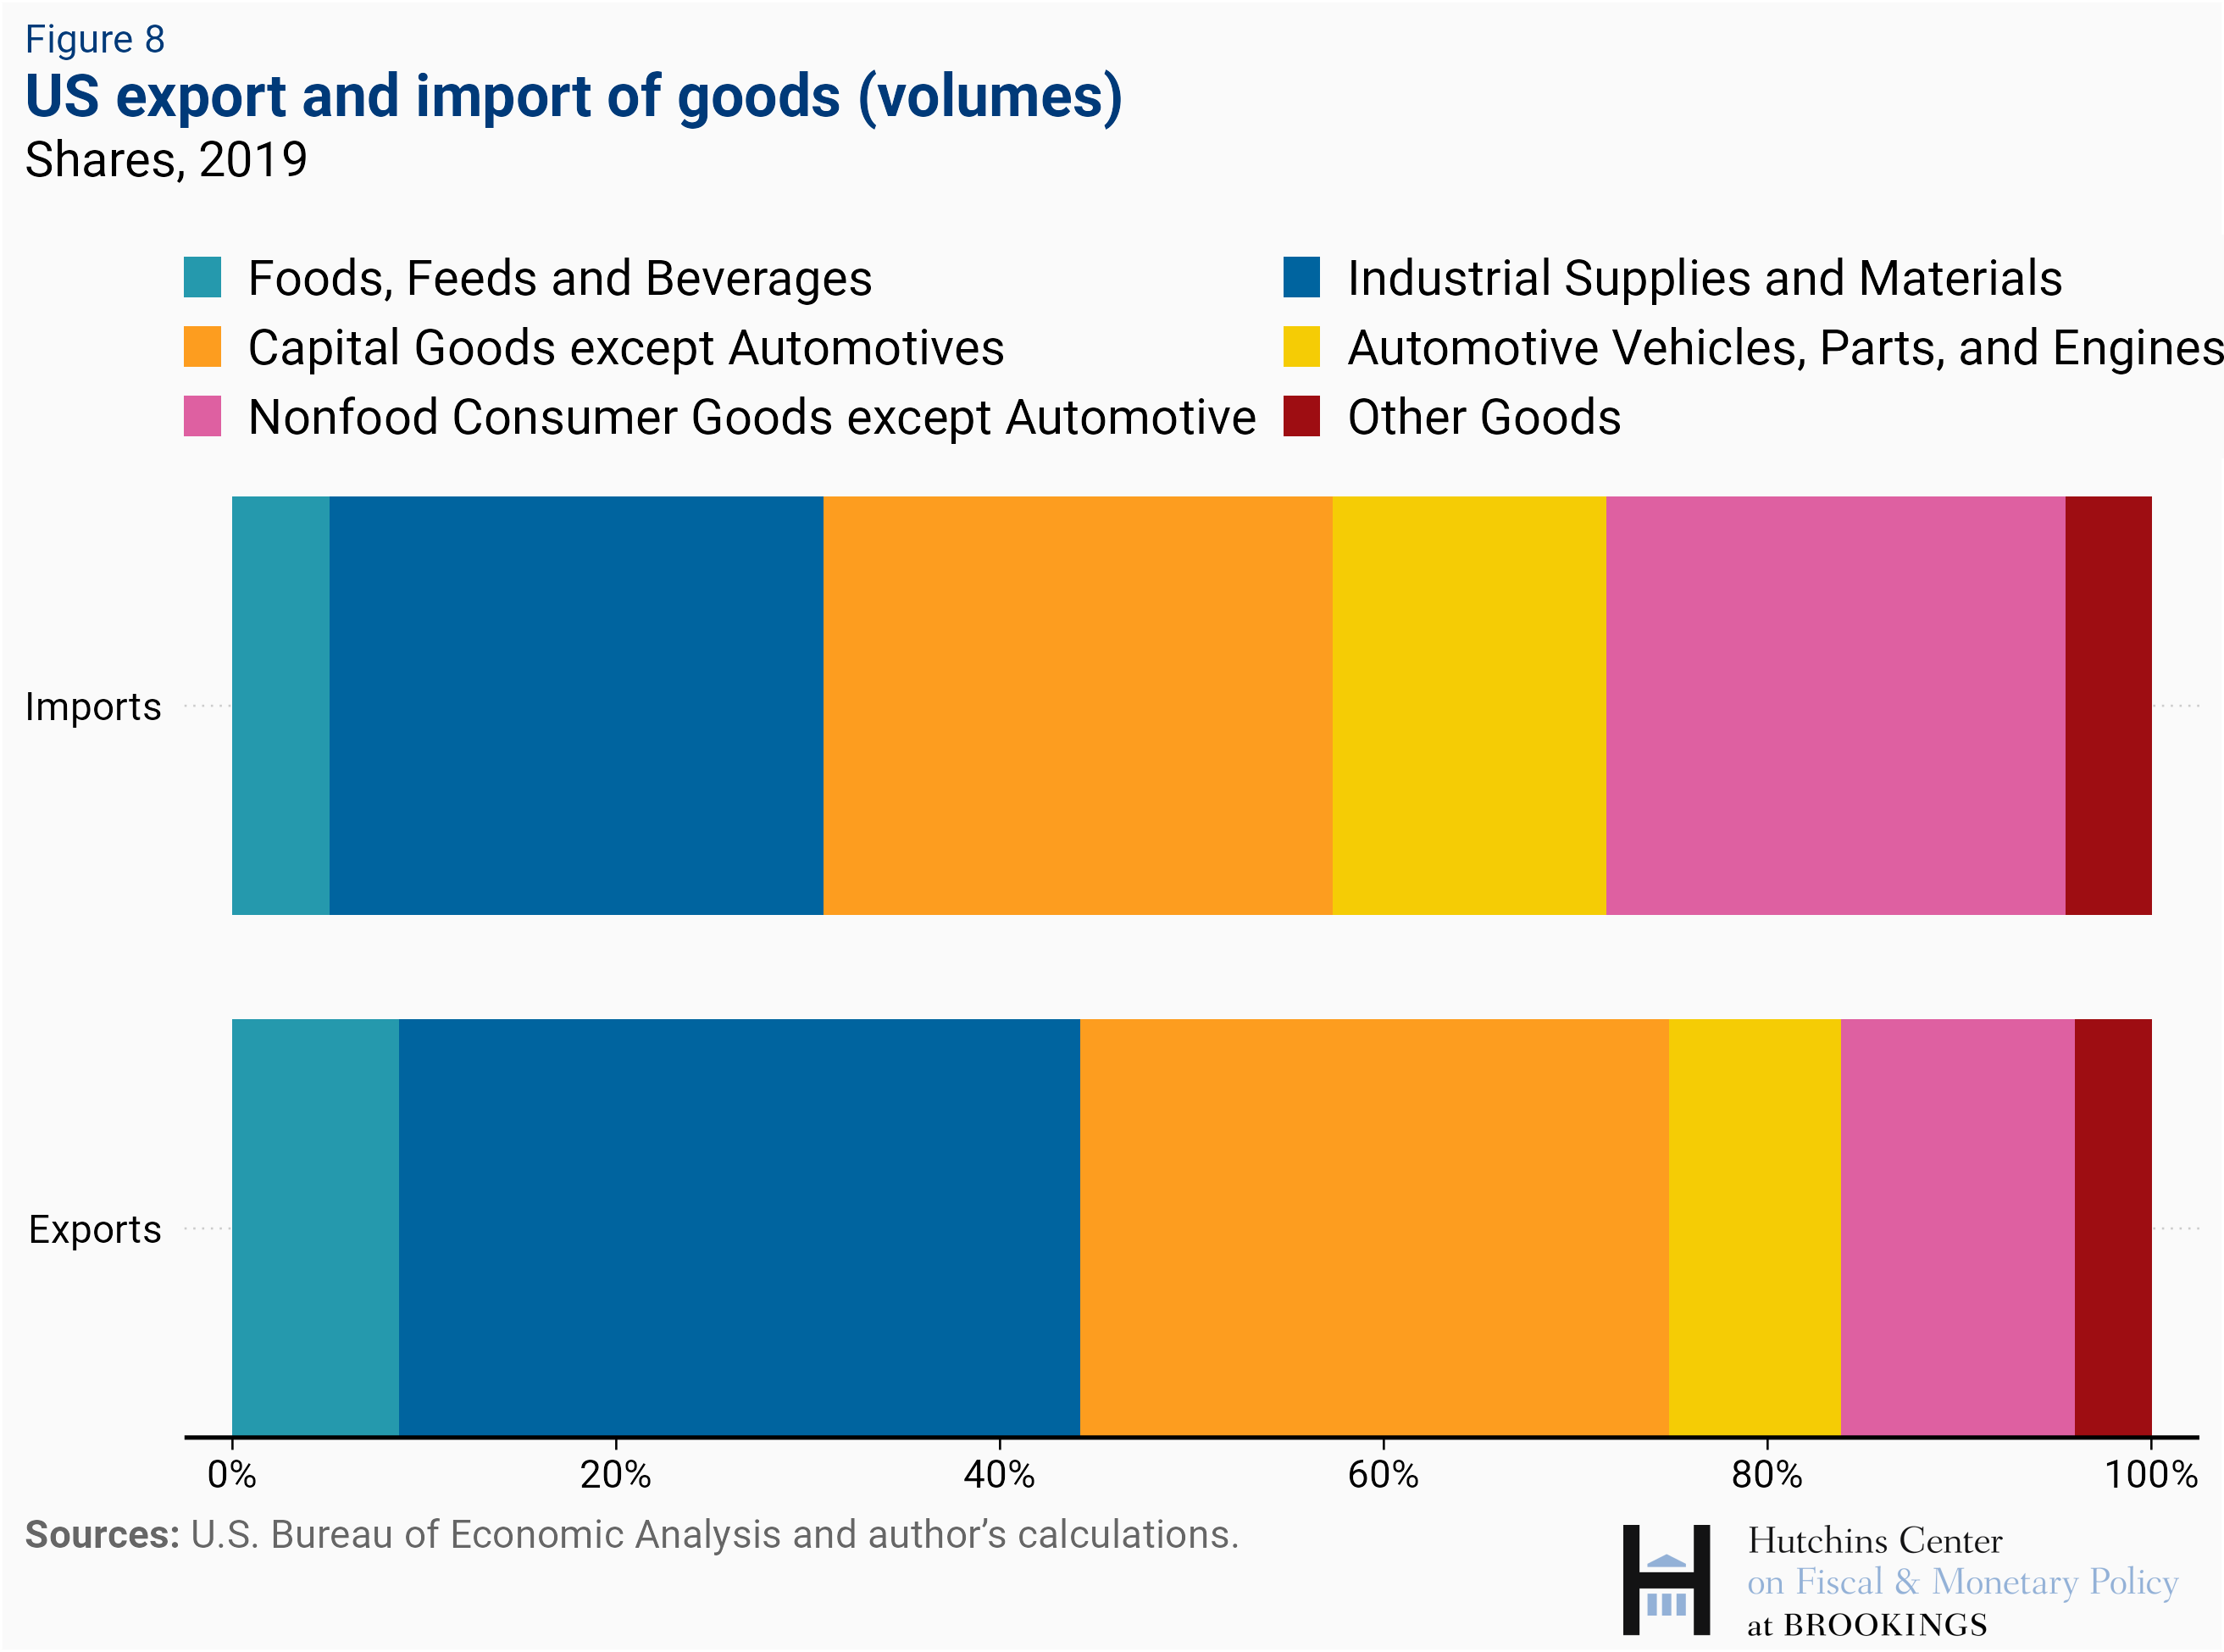
The strong recovery in spending on consumer goods has therefore boosted U.S. imports and widened the U.S. trade deficit. Furthermore, the more rapid recovery in capital spending in the U.S. compared to its trading partners has also implied faster growth in imports of industrial supplies and capital goods relative to exports. The trade data also highlights the importance of supply bottlenecks and constraints: these are particularly visible in the data for trade in cars and car parts in the third quarter of 2021.
Recovery prospects
Growth prospects for the fourth quarter and 2022 looked pretty strong for advanced economies until a few weeks ago, but a new wave of infections hitting European countries, especially Germany, and the discovery of the new omicron variant have increased uncertainty over short-term prospects. This notwithstanding, growth prospects for advanced economies have remained much more favorable than those for many emerging and developing economies, where vaccination rates are much lower and economic activity remains substantially below the pre-crisis trend. An important question for advanced economies is going to be the speed with which supply capacity will rise, both in the goods sector and in services as re-opening occurs. This will be key to allow the recovery to continue without the need for a more drastic policy tightening to reduce inflationary pressures.
[1] For the euro area we also show GDP and its components, excluding Ireland. This is because Irish national accounts are heavily affected by financial operations of multinational corporations, particularly in regard to transfers of intellectual property (IP) to Irish affiliates of U.S. companies. These transfers (which were very large in Q4 2019 and Q1 2020, for instance) boost investment and imports (they are recorded as imports of IP matched by new investment in IP), and to a somewhat lesser extent, GDP.
[2] Indeed, total demand in the United States (a measure of domestic spending) was 3.3 percent above its level in the last quarter of 2019, while the corresponding figure for U.S. GDP was 1.4 percent.
[3] The weakness of UK imports and especially exports in the aftermath of Brexit is particularly notable.
The Brookings Institution is financed through the support of a diverse array of foundations, corporations, governments, individuals, as well as an endowment. A list of donors can be found in our annual reports published online here. The findings, interpretations, and conclusions in this report are solely those of its author(s) and are not influenced by any donation.
Authors

-
Acknowledgements and disclosures
The author thanks Manuel Alcala Kovalski for his assistance with the figures, and Rafael Portillo, Malhar Nabar, and David Wessel for their useful comments.


Commentary
A most unusual recovery: How the US rebound from COVID differs from rest of G7
December 8, 2021