Misc
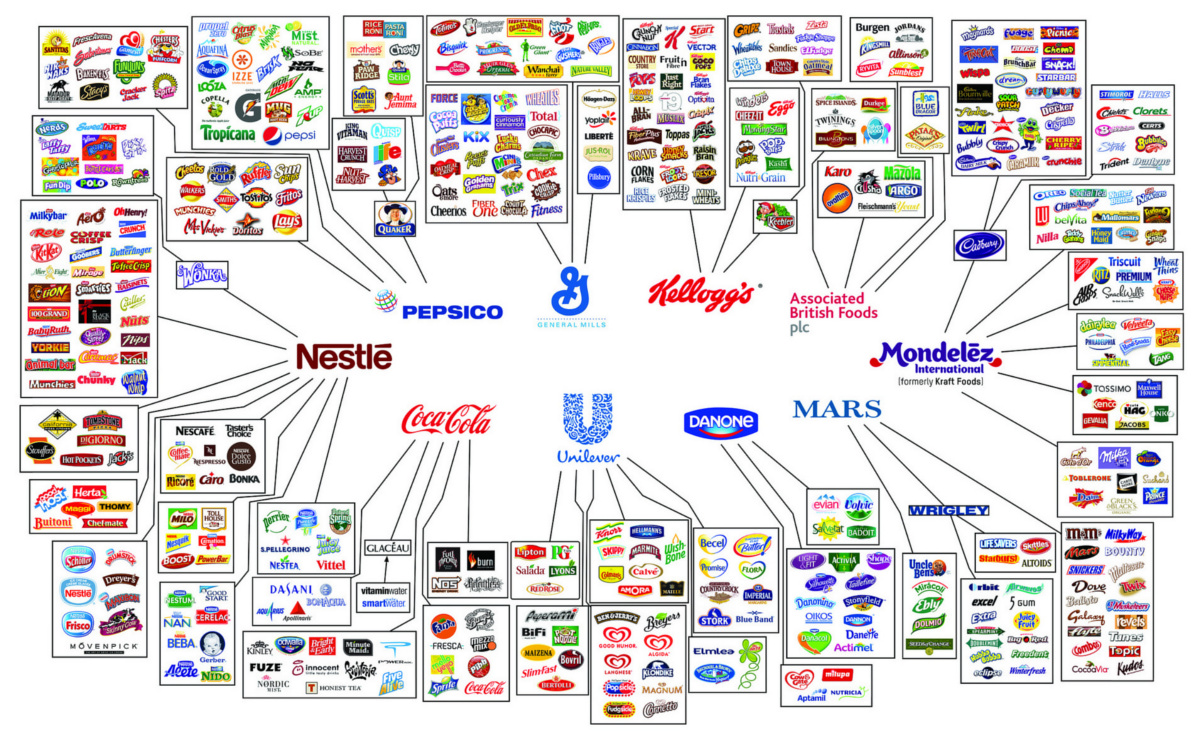
The Illusion of Choice in Consumer Brands
The Illusion of Choice in Consumer Brands
Explore the full-size version of the above graphic in all its glory.
If today’s infographic looks familiar, that’s because it originates from a well-circulated report that Oxfam International puts together to show consolidation in the mass consumer goods industry.
We are sharing it because we believe it is important for you to be aware of who is supplying the different brands and goods served on your dinner table.
Unlikely Links
The illusion of choice does not arise from the products we expect the companies to sell. We inherently know that PepsiCo sells plenty of beverages, including its flagship product. We know that Nestlé makes Kit Kat, Nesquick chocolate syrup, Nespresso coffee machines, and Nescafé instant coffee.
What is less obvious is that Nestlé makes Gerber baby food, Hot Pockets, DiGiorno pizzas, and Stouffer brand frozen foods. Nestlé even owns two competing brands of fancy, carbonated water: San Pellegrino and Perrier.
In fact, Nestlé has at least 29 brands with annual sales over $1 billion. The company literally has hundreds of different products in sectors ranging from pet food to soups and sauces. It’s the world’s largest food company by revenues, and it’s worth a whopping $240 billion in market capitalization.
They Might Be Giants
It’s not just Nestlé that is mind-boggling in size and scope.
Other companies such as Coca-Cola, Kellogg’s, Mondelēz, PepsiCo, General Mills, Danone, and Mars are also massive. They each own dozens of brands that dominate certain product categories.
Want to buy crackers? Pick up some Ritz, Triscuits, Wheat Thins, Air Crisps, or Premium brand crackers – but know they are all owned by Mondelēz (formerly Kraft Foods).
Buying a chocolate bar? There are seemingly hundreds to choose from, but its just the illusion of choice. They pretty much all come from Mars, Nestlé, or Mondelēz (which owns Cadbury).
There’s nothing wrong in buying from these brands, but remember that each dollar of your money is a vote. Vote for products and companies you believe in!
Note: the above graphic is about 1.5 years old, and it misses recent acquisitions or changes in brand ownership. For example, Power Bar is now owned by Post Holdings, another giant consumer foods conglomerate. That said, we believes the point of the graphic still comes across.


Maps
Which Countries Have the Most and Least Women in the Workforce?
More women in the workforce can indicate a shift towards women having more economic opportunities and facing fewer barriers to working outside the home.
Countries With the Most and Least Women in the Workforce
This was originally posted on our Voronoi app. Download the app for free on iOS or Android and discover incredible data-driven charts from a variety of trusted sources.
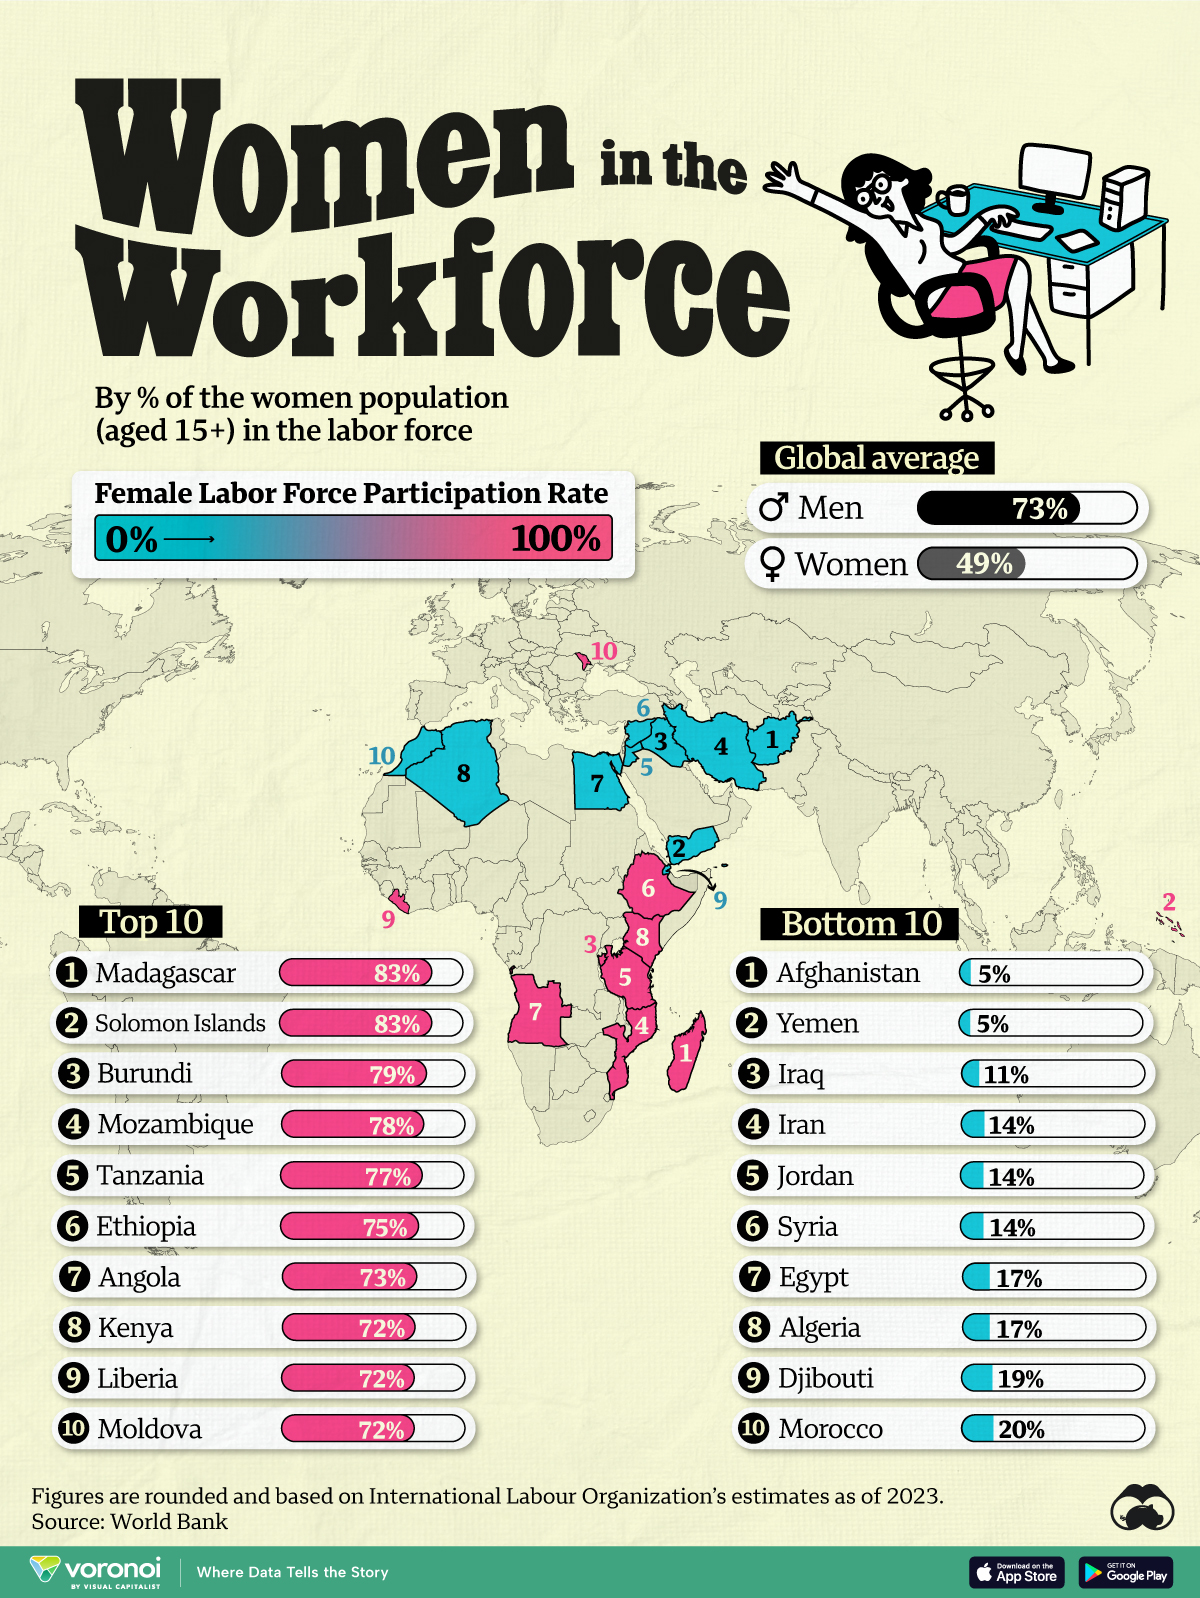
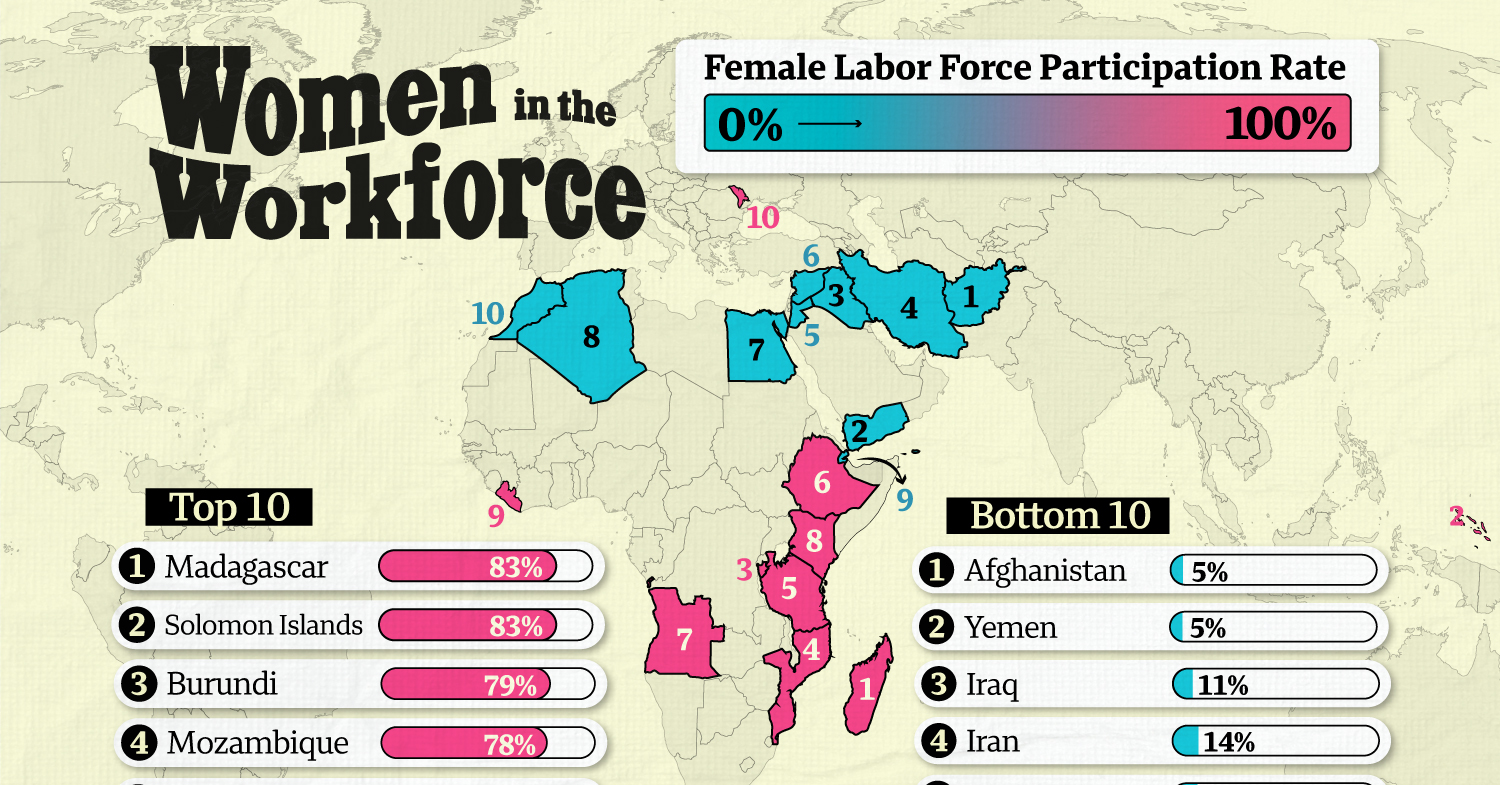
This map shows the top and bottom 10 countries by the percentage of their women population (aged 15+) in the labor force. This is also called the female workforce participation rate.
Data for this graphic is sourced from the World Bank, which aggregates International Labour Organization estimates from 2023.
Ranked: Countries By Rate of Women in the Workforce
Madagascar, Burundi, and Mozambique have some of the highest women workforce participation rates in the world (near 80%).
Here’s a full ranking of countries by their female workforce participation rate.
| Rank | Country | Female Labor Force Participation Rate (2023) |
|---|---|---|
| 1 | 🇲🇬 Madagascar | 83% |
| 2 | 🇸🇧 Solomon Islands | 83% |
| 3 | 🇧🇮 Burundi | 79% |
| 4 | 🇲🇿 Mozambique | 78% |
| 5 | 🇹🇿 Tanzania | 77% |
| 6 | 🇪🇹 Ethiopia | 75% |
| 7 | 🇦🇴 Angola | 73% |
| 8 | 🇱🇷 Liberia | 72% |
| 9 | 🇰🇪 Kenya | 72% |
| 10 | 🇲🇩 Moldova | 72% |
| 11 | 🇪🇷 Eritrea | 71% |
| 12 | 🇸🇸 South Sudan | 70% |
| 13 | 🇮🇸 Iceland | 70% |
| 14 | 🇰🇵 North Korea | 70% |
| 15 | 🇰🇭 Cambodia | 70% |
| 16 | 🇻🇳 Viet Nam | 69% |
| 17 | 🇳🇿 New Zealand | 68% |
| 18 | 🇺🇬 Uganda | 68% |
| 19 | 🇦🇿 Azerbaijan | 67% |
| 20 | 🇨🇲 Cameroon | 67% |
| 21 | 🇨🇩 Congo | 67% |
| 22 | 🇵🇪 Peru | 66% |
| 23 | 🇧🇸 Bahamas | 65% |
| 24 | 🇬🇭 Ghana | 65% |
| 25 | 🇧🇹 Bhutan | 65% |
| 26 | 🇶🇦 Qatar | 64% |
| 27 | 🇲🇼 Malawi | 64% |
| 28 | 🇨🇫 Central African Republic | 63% |
| 29 | 🇸🇪 Sweden | 63% |
| 30 | 🇰🇿 Kazakhstan | 63% |
| 31 | 🇲🇴 Macao | 63% |
| 32 | 🇨🇩 DRC | 63% |
| 33 | 🇱🇨 St. Lucia | 63% |
| 34 | 🇳🇪 Niger | 62% |
| 35 | 🇳🇴 Norway | 62% |
| 36 | 🇳🇱 Netherlands | 62% |
| 37 | 🇸🇬 Singapore | 62% |
| 38 | 🇦🇺 Australia | 62% |
| 39 | 🇯🇲 Jamaica | 61% |
| 40 | 🇨🇭 Switzerland | 61% |
| 41 | 🇨🇦 Canada | 61% |
| 42 | 🇪🇪 Estonia | 61% |
| 43 | 🇹🇱 Timor-Leste | 61% |
| 44 | 🇭🇹 Haiti | 61% |
| 45 | 🇮🇱 Israel | 61% |
| 46 | 🇻🇺 Vanuatu | 61% |
| 47 | 🇨🇳 China | 61% |
| 48 | 🇿🇼 Zimbabwe | 60% |
| 49 | 🇨🇾 Cyprus | 60% |
| 50 | 🇧🇴 Bolivia | 60% |
| 51 | 🇧🇼 Botswana | 60% |
| 52 | 🇮🇪 Ireland | 60% |
| 53 | 🇩🇰 Denmark | 60% |
| 54 | 🇵🇾 Paraguay | 60% |
| 55 | 🇧🇾 Belarus | 59% |
| 56 | 🇹🇭 Thailand | 59% |
| 57 | 🇧🇧 Barbados | 59% |
| 58 | 🇬🇧 UK | 58% |
| 59 | 🇱🇺 Luxembourg | 58% |
| 60 | 🇫🇮 Finland | 58% |
| 61 | 🇧🇫 Burkina Faso | 58% |
| 62 | 🇱🇸 Lesotho | 58% |
| 63 | 🇱🇹 Lithuania | 57% |
| 64 | 🇲🇹 Malta | 57% |
| 65 | 🇦🇹 Austria | 57% |
| 66 | 🇧🇯 Benin | 57% |
| 67 | 🇨🇮 Cote d'Ivoire | 57% |
| 68 | 🇺🇸 U.S. | 57% |
| 69 | 🇩🇪 Germany | 56% |
| 70 | 🇬🇲 Gambia | 56% |
| 71 | 🇬🇺 Guam | 56% |
| 72 | 🇸🇰 Slovakia | 56% |
| 73 | 🇹🇬 Togo | 56% |
| 74 | 🇦🇲 Armenia | 56% |
| 75 | 🇱🇦 Laos | 56% |
| 76 | 🇰🇷 South Korea | 56% |
| 77 | 🇳🇦 Namibia | 56% |
| 78 | 🇺🇾 Uruguay | 56% |
| 79 | 🇱🇻 Latvia | 56% |
| 80 | 🇧🇳 Brunei | 55% |
| 81 | 🇦🇪 UAE | 55% |
| 82 | 🇵🇹 Portugal | 55% |
| 83 | 🇷🇼 Rwanda | 55% |
| 84 | 🇻🇨 St. Vincent & the Grenadines | 55% |
| 85 | 🇯🇵 Japan | 55% |
| 86 | 🇷🇺 Russia | 55% |
| 87 | 🇬🇪 Georgia | 54% |
| 88 | 🇭🇺 Hungary | 54% |
| 89 | 🇸🇮 Slovenia | 54% |
| 90 | 🇰🇬 Kyrgyz Republic | 54% |
| 91 | 🇮🇩 Indonesia | 53% |
| 92 | 🇪🇨 Ecuador | 53% |
| 93 | 🇧🇷 Brazil | 53% |
| 94 | 🇦🇱 Albania | 53% |
| 95 | 🇫🇷 France | 53% |
| 96 | 🇲🇳 Mongolia | 53% |
| 97 | 🇳🇨 New Caledonia | 53% |
| 98 | 🇪🇸 Spain | 53% |
| 99 | 🇿🇦 South Africa | 52% |
| 100 | 🇭🇰 Hong Kong | 52% |
| 101 | 🇳🇬 Nigeria | 52% |
| 102 | 🇿🇲 Zambia | 52% |
| 103 | 🇨🇿 Czechia | 52% |
| 104 | 🇨🇱 Chile | 52% |
| 105 | 🇩🇴 Dominican Republic | 52% |
| 106 | 🇬🇶 Equatorial Guinea | 52% |
| 107 | 🇲🇾 Malaysia | 52% |
| 108 | 🇲🇱 Mali | 52% |
| 109 | 🇵🇱 Poland | 52% |
| 110 | 🇸🇱 Sierra Leone | 52% |
| 111 | 🇨🇴 Colombia | 51% |
| 112 | 🇨🇻 Cabo Verde | 51% |
| 113 | 🇬🇬 Channel Islands | 51% |
| 114 | 🇷🇸 Serbia | 51% |
| 115 | 🇦🇷 Argentina | 51% |
| 116 | 🇧🇪 Belgium | 51% |
| 117 | 🇵🇦 Panama | 50% |
| 118 | 🇧🇿 Belize | 50% |
| 119 | 🇧🇬 Bulgaria | 50% |
| 120 | 🇭🇳 Honduras | 50% |
| 121 | 🇵🇫 French Polynesia | 49% |
| 122 | 🇲🇪 Montenegro | 49% |
| 123 | 🇳🇮 Nicaragua | 49% |
| 124 | 🇹🇲 Turkmenistan | 49% |
| 125 | 🇬🇼 Guinea-Bissau | 49% |
| 126 | 🇹🇩 Chad | 49% |
| 127 | 🇭🇷 Croatia | 48% |
| 128 | 🇰🇼 Kuwait | 48% |
| 129 | 🇸🇿 Eswatini | 47% |
| 130 | 🇵🇭 Philippines | 47% |
| 131 | 🇲🇽 Mexico | 47% |
| 132 | 🇵🇬 Papua New Guinea | 46% |
| 133 | 🇸🇻 El Salvador | 46% |
| 134 | 🇹🇹 Trinidad and Tobago | 46% |
| 135 | 🇬🇷 Greece | 45% |
| 136 | 🇻🇮 U.S. Virgin Islands | 45% |
| 137 | 🇨🇷 Costa Rica | 45% |
| 138 | 🇸🇷 Suriname | 45% |
| 139 | 🇧🇭 Bahrain | 44% |
| 140 | 🇲🇺 Mauritius | 43% |
| 141 | 🇹🇴 Tonga | 43% |
| 142 | 🇲🇻 Maldives | 43% |
| 143 | 🇲🇰 North Macedonia | 43% |
| 144 | 🇬🇳 Guinea | 42% |
| 145 | 🇷🇴 Romania | 42% |
| 146 | 🇨🇺 Cuba | 42% |
| 147 | 🇲🇲 Myanmar | 42% |
| 148 | 🇼🇸 Samoa | 41% |
| 149 | 🇮🇹 Italy | 41% |
| 150 | 🇬🇹 Guatemala | 41% |
| 151 | 🇧🇦 Bosnia & Herzegovina | 41% |
| 152 | 🇬🇦 Gabon | 40% |
| 153 | 🇺🇿 Uzbekistan | 40% |
| 154 | 🇬🇾 Guyana | 40% |
| 155 | 🇻🇪 Venezuela | 39% |
| 156 | 🇫🇯 Fiji | 39% |
| 157 | 🇸🇹 Sao Tome & Principe | 38% |
| 158 | 🇸🇳 Senegal | 38% |
| 159 | 🇧🇩 Bangladesh | 37% |
| 160 | 🇹🇷 Türkiye | 35% |
| 161 | 🇱🇾 Libya | 35% |
| 162 | 🇸🇦 Saudi Arabia | 35% |
| 163 | 🇰🇲 Comoros | 33% |
| 164 | 🇮🇳 India | 33% |
| 165 | 🇱🇰 Sri Lanka | 32% |
| 166 | 🇴🇲 Oman | 32% |
| 167 | 🇵🇷 Puerto Rico | 32% |
| 168 | 🇹🇯 Tajikistan | 32% |
| 169 | 🇳🇵 Nepal | 29% |
| 170 | 🇸🇩 Sudan | 28% |
| 171 | 🇱🇧 Lebanon | 28% |
| 172 | 🇹🇳 Tunisia | 27% |
| 173 | 🇲🇷 Mauritania | 26% |
| 174 | 🇵🇰 Pakistan | 25% |
| 175 | 🇸🇴 Somalia | 21% |
| 176 | 🇲🇦 Morocco | 20% |
| 177 | 🇩🇯 Djibouti | 19% |
| 178 | 🇩🇿 Algeria | 17% |
| 179 | 🇪🇬 Egypt | 17% |
| 180 | 🇸🇾 Syria | 14% |
| 181 | 🇯🇴 Jordan | 14% |
| 182 | 🇮🇷 Iran | 14% |
| 183 | 🇮🇶 Iraq | 11% |
| 184 | 🇾🇪 Yemen | 5% |
| 185 | 🇦🇫 Afghanistan | 5% |
Note: Figures rounded and based on International Labour Organization’s estimates as of 2023.
On the other hand, Afghanistan and Yemen are currently estimated to have the lowest percentage of working-aged women in their workforce at 5%.
By glancing through the bottom 20, it’s apparent that countries in the Middle East, North Africa, and South Asia exhibit notably lower rates of women in the workforce.
As Our World in Data points out, female labor force participation peaks in some of the richest and poorest countries in the world. But is lowest in countries with average national incomes.
More people in the workforce can contribute to economic growth and productivity. As women make up roughly half the population, their participation can be a major driver of economic expansion.

-
 Mining6 days ago
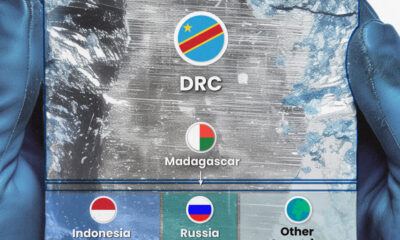
Visualizing Cobalt Production by Country in 2023
-
 Personal Finance2 weeks ago
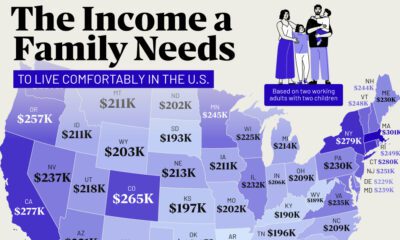
Mapped: The Income a Family Needs to Live Comfortably in Every U.S. State
-

 Energy2 weeks ago
Ranked: The World’s Largest Lithium Producers in 2023
-
 Maps2 weeks ago
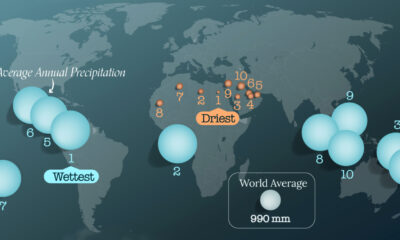
Mapped: The World’s Wettest and Driest Countries
-
 Healthcare2 weeks ago
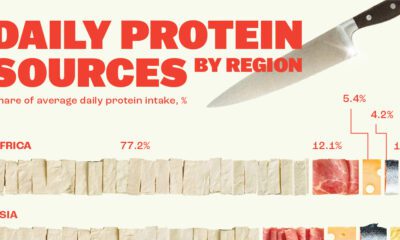
Visualizing Daily Protein Sources by Region
-
 Maps2 weeks ago
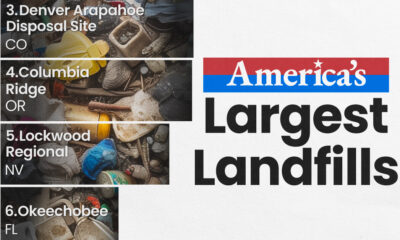
Map: Where Are America’s Largest Landfills?
-

 AI1 week ago
Nvidia is Worth More Than All of These Companies Combined
-

 Stocks1 week ago
Visualizing Berkshire Hathaway’s Stock Portfolio (Q1 2024)