Notes
Evergreen note: “Analytics” are not mere numbers. They’re models: ways of bridging practical (what happens on ice) and theoretical knowledge (what will or can happen based on ice based on prior events). They help define the conditions of performance over a period of time rather than glimpsing raw plus-minus. The climate versus the weather. These are not meant to be a right or wrong way to look at a hockey game; they’re meant to be useful in understanding the conditions of hockey itself.
The Stat: A3Z tracking data.
The question Setting attempts to answer: What can we learn from isolating player performance across all three zones instead of measuring the impact of their shift-to-shift bottom line?
How it answers that question: Corey Sznajder’s tracking data is truly special from a data perspective because it’s not a black box of abstract, mathematical insights. It’s basically a tale of the tape — how a player gets out of the zone, excels or doesn’t on the rush, how they do or don’t forecheck, etc — but categorized against the rest of the league. Much of what’s measured by others is meant to simplify the value of a player i.e. how many goals above a healthy scratch forward we can expect to see them score, how many wins they’re worth, etc. Corey’s data is all about adding layers. In many ways, it’s an attempt at identifying the cause (tracking data) of a player’s value rather than their effect (GAR, sG, WAR, GS, etc). Corey's manually tracked data is divided into the following sections:
General Offense
Playmaking
Offense Type
Transition
Defense
Forechecking
Zone entry defense
Zone Exits
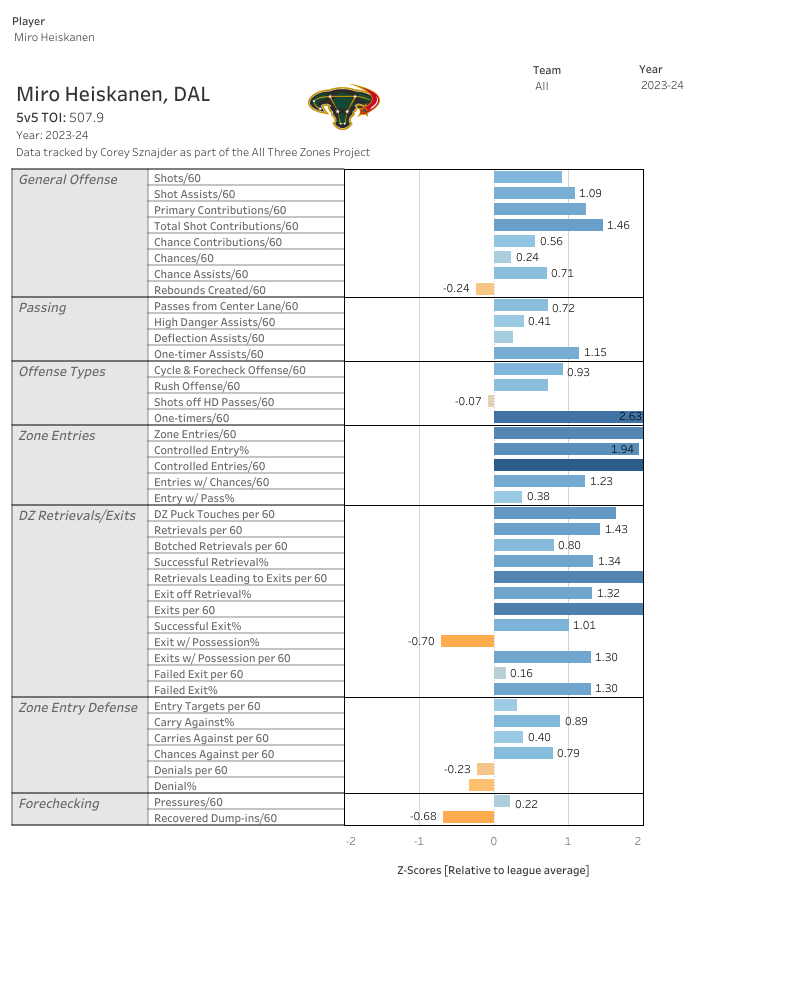
These sections are scaled using Z-Scores so that we see how each player compares to the league average (defined by 0) in every category. Attached is Miro Heiskanen’s card. General offense is exactly what it sounds like: how often a player shoots, how often they assist, and it includes their primary contributions, which only count goals and primary assists — an important distinction since this is the most repeatable layer of offense. (It’s also the layer of offense that is less volatile among forwards, and more volatile among defenseman.)
Playmaking is arranged in ascending order, starting with low to high passes, center lane assists, and lastly -- passes that occur from behind the net or that cross the slot from the faceoff circles. These are arranged by their history of which passes drive shooting percentages the highest.
Offense types are broken up by the chances a player creates from the rush, on the forecheck, off rebounds, etc. What does this say about a player? Rush chances convert at a higher rate, in keeping with the famous Jen LC stat that 64 of all goals are scored off controlled entries. However, there are more shots that result from forechecking, thus players who are good at creating on the cycle are also more likely to be strong possession players.
Forechecking refers to when a player forces an uncontrolled exist, like an icing, board clear, or turnover.
Recoveries refer to dump-in recoveries. However, these are counted when plays are made off the dump-in recoveries so that we don’t end up with noise.
Zone entry defense is what it sounds like: how often is a player targeted (entry targets per 60), how often do they allow possession against, and whether opponents tend to generate chances off those entries.
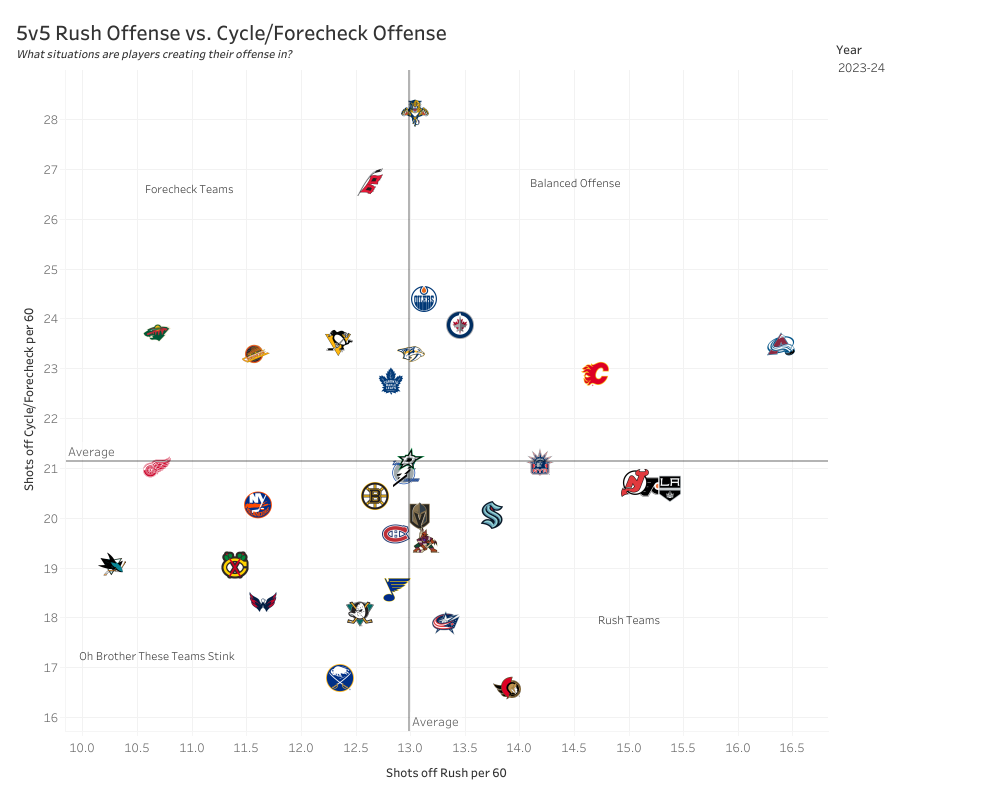
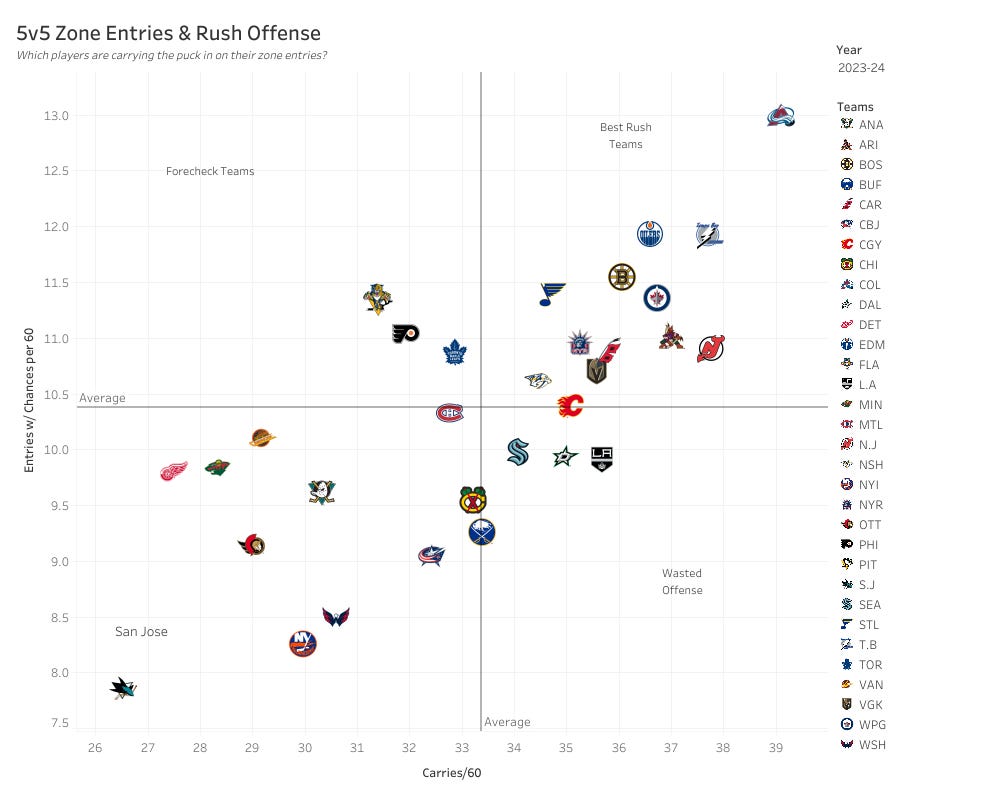
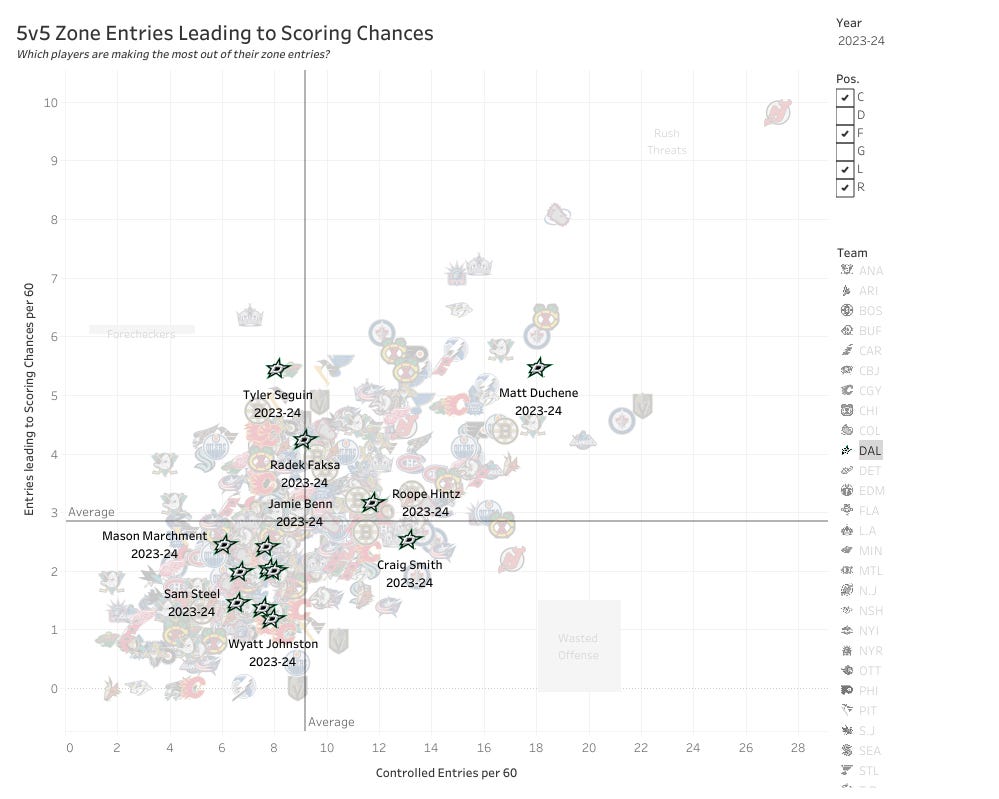
Another cool thing about Corey’s data is that you can find basically anything. Don’t know which teams were great at defending the pass? Now you do! (See attachment) Don’t know which teams were the best/worst at defending zone entries? (See attachment) Now you do! They’re also broken down within teams so you can see which players excel and which do not. (See attachment!)
Personal note: if you're looking to be an amateur analyst, or are an aspiring hockey writer, Corey's data should be mandatory IMO. So much of explaining what we see, or how teams perform or not depends on understanding performance itself. Corey's data gives you the most intimate insights into player and team performance. A single card won't tell the whole story, but it can give you a new appreciation for players you’re used to watching from a different point of view. Or, as with Dallas — insight into fascinating contradictions (in this case, how does such a great goal-scoring team end up being so wasteful in terms of chances created?). I also think his player cards are the best way to analyze defensemen, since the scope of their duties go far beyond simply shot differential. It’s no wonder, when he did his own analysis of the most repeatable transition skills, that players like Miro Heiskanen and Chris Tanev rated the highest.
One last thing: While I believe Corey’s data is the best in the business, it’s important to distinguish between a micro and macro-level view of data. Other forms of data may be less intuitive, but that doesn’t make them less useful.
Sources/Further Reading:


Dive into your interests
We'll recommend top publications based on the topics you select.
