Not All NDX Stocks Are Joining The Party

Free Chart In Focus email
Delivered to you every week
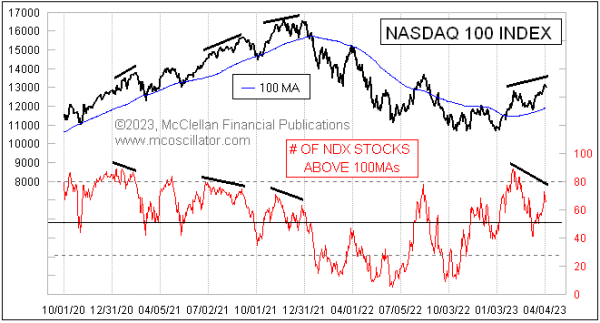
The big tech darlings like Microsoft and Apple have a big weighting in the the SP500 and in the Nasdaq 100 (NDX), and their recent strength has pulled the NDX up to a higher high. But we are not seeing confirmation of that in this week's chart.
This week's chart shows an indicator that I feature numerically every day in my Daily Edition. It depicts the number of stocks in the Nasdaq 100 that are currently above their own 100-day simple moving averages.
I built this years ago, after deciding that I wanted to have my own Advance-Decline data on those NDX stocks. That meant gathering data on each of the 100 component stocks, keeping track of splits, mergers, delistings, symbol changes, and other headaches involved with keeping such data. But it also allowed me to segue into other similar indicators, like this one.
For many years, the folks at Investors Intelligence have kept data on how many NYSE stocks are above their 200-day moving averages. So 200 days was the lookback I started with for this indicator, and once I had it all calculated I was not as satisfied with the result as I hoped to be. So I did some tinkering with that lookback, and eventually settled on using 100MAs for each of the component stocks, because it made for an indicator that seemed to behave better and gave better insights.
Right now it is showing a lower reading than the 83 it posted on Feb. 13. For now that is an apparent divergence versus the higher price high. Any current divergence must be characterized as an apparent divergence until well after the fact, because sometimes a divergence can get rehabilitated. If stock prices keep rallying, and if the rest of the NDX components all start climbing up above their 100MAs, then the divergence could go away.
I also like to always caution readers that any divergence is a "condition", not a "signal". The stock market does not have a mandate to go lower just because we notice this divergence (or any other). But it does work out that way a lot of the time, and the message here is that the rest of the components are not participating in the rally as much as the big-cap stocks that drive the price index. Uptrends are stronger when they are broad, and they are problematic when led by just a handful of stocks.
Tom McClellan
Editor, The McClellan Market Report
Mar 18, 2022
Drawdown in NDX Stocks |
Aug 20, 2021
Waning Number of NDX Stocks In The Uptrend |
Apr 15, 2021
NDX Stocks Above 100MA |