
Let’s consider some binary investments. Stocks that look like loaded coins.
- $1.00 stock that is 50% to go up or down $1
- Expectancy = 50% ($1) + 50% (-$1) = $0
- Variance = 50% (1) + 50% (-1) = 1
- Standard deviation = = 1
- SD/Stock Price = 100%
- MAD = 50% () + 50%() = 1
- MAD/Stock Price = 100%
- MAD/SD = 100%
Let’s compute some key metrics:
Let’s price some options while we’re at it.
The $1 strike (ATM) call is worth $1 if the stock goes up to $2 and its worthless if it drops to zero.
ATM call = 50% ($1) + 50% (0) = $.50
ATM put = 50% ($1) + 50% (0) = $.50
ATM Straddle = c + p = $1.00
Let’s look at a skewed example next…
- $2.00 stock that is 1/3 to go up $1 or 2/3 to go down $2
- Expectancy = 66.67% ($1) + 33.33% (-$2) = $0
- Variance = 66.67% (1) + 33.33% (-2) = 2
- Standard deviation = = 1.41
- SD/Stock Price = 71%
- MAD = 66.67% () + 33.33%() = 1.33
- MAD/Stock Price = 67%
- MAD/SD = 94%
ATM call = 66.67% ($1) + 33.33% (0) = $.67
ATM put = 66.67% (0) + 33.33% ($2) = $.67
ATM Straddle = c + p = $1.33
Quick observations before moving ahead
Balanced stock
S = $1.00
MAD = 1
MAD/Stock Price = 1
SD = 1
SD/Stock Price = 1
Straddle = $1.00
Skewed stock
S = $2.00
MAD = 1.33
MAD/Stock Price = .67
SD = 1.41
SD/Stock Price = .71
Straddle = $1.33
- The MAD = the straddle price
- The straddles are increasing in value with the spot price. This is intuitive — if two stocks have the same percent volatility but one is 2x the price of the other its straddle will also be 2x the price. This is also seen in the straddle approximation. The straddle is directly proportional to S:

- The volatility and MAD numbers are depicted in absolute dollars and naturally increased when we looked at the higher priced, skewed stock. But the straddle didn’t double in value from $1 to $2 because the volatility actually decreased as a percent of the stock price.
Here’s a comparison of 9 stocks. They all are priced fairly (ie zero expectancy) but have increasing stock prices and skew (the increasing prices are just a convenience so I could keep the downside risk constant at “lose 100%”):
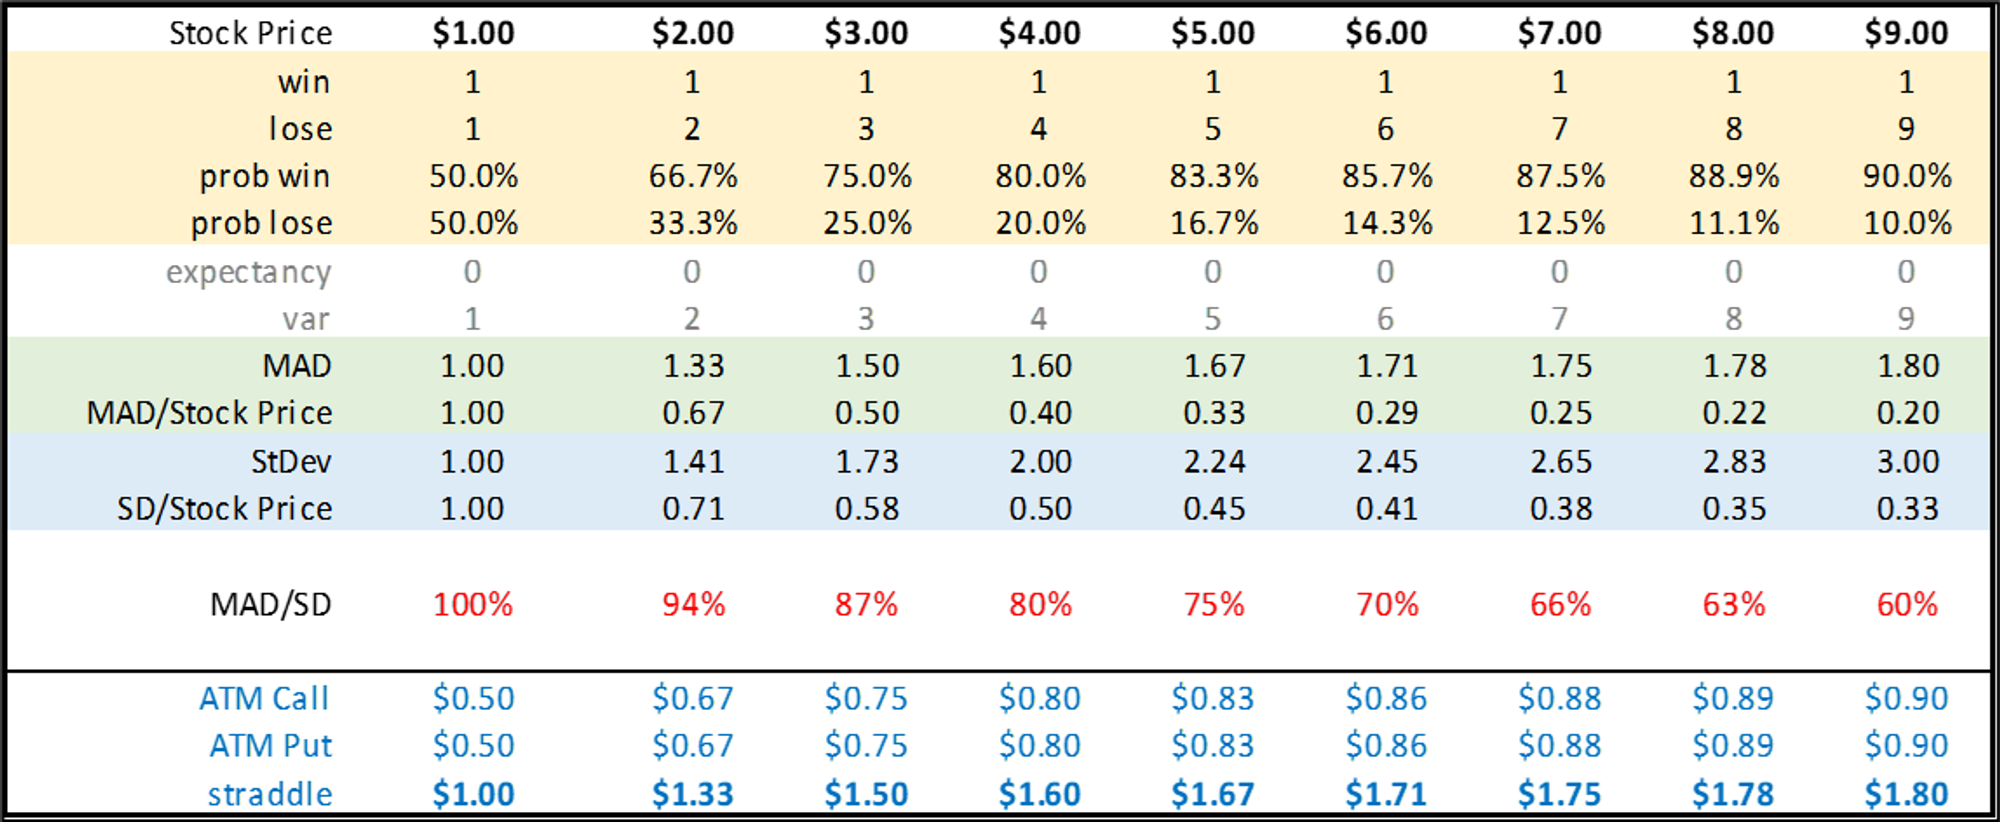
Discussion
We are looking at examples with increasingly more skew. This is negative skew. The downside is always losing 100%.
That downside volatility is being held fixed while the upside return is shrinking but the fair stock price is counterbalanced by an increased probability of experiencing a positive return.
The combined effect of:
- reducing the upside potential
- while holding the downside return fixed
- and simply increasing the number of times we get the positive return
⇒ suppresses the volatility.
But here's a blunt question:
Not really, right?
The lower volatility is deceiving. The risk is moving from the meat of the distribution to the tail where its more resistant to being managed.
The nature of low probability events is:
- We don't know much about them because by definition they are seen less
- Being slightly off in our estimates has profound effects in payoff space. A 1% probability should pay 99-1 odds. A 2% event should pay 49-1. But can you really tell the difference between something that occurs 1% vs 2% of the time? Depending on the strategy this can have a profound impact on what’s considered prudent sizing.