


This week’s Economist/YouGov poll covers the 2024 presidential election, which sources Americans trust for election information, funding for Israel, the Palestinians, and Ukraine, and Time magazine's selection of Taylor Swift as Person of the Year.
The 2024 election
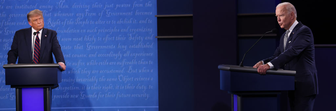
- The contest between the likely Democratic and Republican nominees for president is close: 43% of registered voters would vote for President Joe Biden and 43% for former President Donald Trump
- More registered voters believe Trump would win in 2024 (44%) than think Biden would (37%)
- Registered voters who say they would vote for Trump against Biden are more likely to think their candidate would win that matchup (84% say he would while 4% think Biden would beat Trump) than are people who would prefer Biden to expect Biden would defeat Trump (77% think Biden would win in that matchup and 6% think Trump would win)
- 51% of Democrats say they want Biden to run for re-election in 2024
- 65% of Republicans want Trump to run in 2024
- 70% of Democrats say Biden’s age and health would affect his ability to fulfill his duties as president — either a little or severely — if he were re-elected
- 88% of Americans say Biden would be affected at least a little
- Republicans are less worried about how Trump’s age and health would affect his ability to serve than Democrats are about Biden: 46% say it would affect him a little or severely
- Among Americans overall, 58% say Trump would be affected at least a little
- Trump remains the overwhelming frontrunner for the GOP nomination: 61% of Republicans and Independents who lean Republican have Trump as their first-choice candidate
- Florida Governor Ron DeSantis is second with 11%. Nikki Haley is in third with 10%.
Whom Americans trust for election information
- More Americans trust their friends and families to provide accurate information about elections than trust poll results, the news media, social media, and political campaigns
- Poll results rank second, with the caveat that trust of polls among poll takers may differ from trust among people who don't take polls
- Democrats are more trusting than Republicans of election information from the news media, political campaigns, and election polls
- Republicans and Democrats have roughly equal levels of trust in friends and family and social media as sources of election information
Israel-Hamas war
- More Americans continue to sympathize with the Israelis than with the Palestinians in the ongoing conflict (38% vs. 13%)
- 24% of Americans — including 32% of Democrats and 17% of Republicans — say they sympathize with both the Israelis and the Palestinians
- More Americans would decrease military aid to Israel than increase it (29% vs. 20%)
- As many would increase humanitarian aid to the Palestinians as decrease it (24% vs. 25%)
- Democrats are more likely to support decreasing military aid to Israel than increasing it, and increasing humanitarian aid to the Palestinians than decreasing it. Republicans are more likely to have the opposite view on each.
- 46% of Americans, including 30% of Democrats and 65% of Republicans, disapprove of how Biden is handling the Israel-Hamas war
Funding for Ukraine
- Twice as many Americans would decrease U.S. military funding to Ukraine as would increase it (33% vs. 17%)
- More Americans nonetheless want Congress to authorize additional funds for Ukraine rather than let funding run out entirely (45% vs. 34%)
- 64% of Democrats and 33% of Republicans support authorizing funding
Time’s Person of the Year: Taylor Swift
- Americans like Taylor Swift. 57% have a very and somewhat favorable opinion of her — higher than the favorable rating for any political figure asked about in this poll.
- More Americans strongly or somewhat approve than disapprove of her selection as Time’s Person of the Year for 2023 (40% vs. 34%)
- Younger adults are more likely than older ones to approve of Time’s decision
- Democrats are more likely than Republicans to approve
- Men and women are roughly equally likely to approve
People and groups in the news
Each week, we ask Americans how they feel about selected political and non-political figures and groups. Below, we present the net favorability of each of the people and groups asked about this week, calculated by subtracting the percentage of Americans who view them very or somewhat unfavorably from the percentage who view them very or somewhat favorably. Americans with no opinion of each are not included in the calculations. Figures may not add up precisely because of rounding:
- President and vice president
- Joe Biden: -19 net (39% view favorably, 58% unfavorably)
- Kamala Harris: -16 net (36% view favorably, 52% unfavorably)
- Political figures
- Hakeem Jeffries: -1 net (26% view favorably, 28% unfavorably)
- Mike Johnson: -8 net (24% view favorably, 32% unfavorably)
- Nikki Haley: -9 net (31% view favorably, 40% unfavorably)
- Chuck Schumer: -14 net (29% view favorably, 43% unfavorably)
- Donald Trump: -16 net (41% view favorably, 56% unfavorably)
- Ron DeSantis: -17 net (32% view favorably, 49% unfavorably)
- Vivek Ramaswamy: -21 net (23% view favorably, 43% unfavorably)
- Kevin McCarthy: -22 net (25% view favorably, 47% unfavorably)
- Chris Christie: -34 net (22% view favorably, 56% unfavorably)
- Mitch McConnell: -44 net (18% view favorably, 61% unfavorably)
Methodology: Respondents were selected from YouGov’s opt-in panel using sample matching. A random sample (stratified by gender, age, race, education, geographic region, and voter registration) was selected from the 2019 American Community Survey. The sample was weighted according to gender, age, race, education, 2020 election turnout and presidential vote, baseline party identification, and current voter registration status. Demographic weighting targets come from the 2019 American Community Survey. Baseline party identification is the respondent’s most recent answer given prior to November 1, 2022, and is weighted to the estimated distribution at that time (33% Democratic, 31% Republican). The margin of error for the overall sample is approximately 3%.
Image: Getty