

Turning on your television it can feel like politicians are everywhere. But the politicians that dominate the news barely scratch the surface of how many politicians there are in the United States. There are almost 100,000 unique governments in the United States, all electing 1 or more people to oversee that government. From School Board to City Council to President, the numbers of elected officials can be dizzying, which is why we put together this infographic to look at all of them, and break down the numbers.
If you'd like to dig into the data sets, or see it broken down by state, scroll below the infographic to get tables and links to our data.
This data was collected from a number of sources, the main one being the 1992 Census of Governments which collected data on every elected official in the United States. We took appended this data from the National Conference of State Legislators and compared it to Jennifer Lawless's 2012 book Becoming a Candidate. Where possible we updated this data with more recent numbers, but the data on local governments from that time period is the best we have.
See the Data by State
| State | Population | Total | Federal | State | Local | Politicians Per 10,000 citizens |
|---|---|---|---|---|---|---|
| United States | 327,167,434 | 512,658 | 534 | 17,628 | 493 830 | 20.6 |
| Alabama | 4,887,871 | 4,385 | 9 | 436 | 3 949 | 10.9 |
| Alaska | 737,438 | 1,929 | 3 | 255 | 1 674 | 35.1 |
| Arizona | 7,171,646 | 3,289 | 11 | 239 | 3,050 | 9 |
| Arkansas | 3,013,825 | 8,408 | 6 | 349 | 8,059 | 35.8 |
| California | 39,557,045 | 18,925 | 55 | 226 | 18 699 | 6.4 |
| Colorado | 5,695,564 | 8,605 | 9 | 280 | 8 325 | 26.1 |
| Connecticut | 3,572,665 | 9,147 | 7 | 333 | 8 814 | 27.8 |
| Delaware | 967,171 | 1,171 | 3 | 80 | 1 091 | 17.6 |
| District of Columbia | 702,455 | 348 | 0 | – | 348 | 5.7 |
| Florida | 21,299,325 | 5,588 | 29 | 934 | 4,654 | 4.3 |
| Georgia | 10,519,475 | 6,529 | 16 | 465 | 6,064 | 10.1 |
| Hawaii | 1,420,491 | 183 | 4 | 91 | 92 | 1.7 |
| Idaho | 1,754,208 | 4,775 | 4 | 171 | 4,604 | 47.4 |
| Illinois | 12,741,080 | 42,336 | 20 | 623 | 41,713 | 37 |
| Indiana | 6,691,878 | 11,624 | 11 | 506 | 11,118 | 21 |
| Iowa | 3,156,145 | 16,479 | 6 | 319 | 16,160 | 59.4 |
| Kansas | 2,911,505 | 18,895 | 6 | 343 | 18,552 | 76.3 |
| Kentucky | 4,468,402 | 7,060 | 8 | 565 | 6,495 | 19.2 |
| Louisiana | 4,659,978 | 5,051 | 8 | 629 | 4,422 | 12 |
| Maine | 1,338,404 | 6,556 | 4 | 210 | 6,346 | 53.4 |
| Maryland | 6,042,718 | 2,123 | 10 | 356 | 1,767 | 4.4 |
| Massachusetts | 6,902,149 | 22,173 | 11 | 225 | 21,948 | 36.9 |
| Michigan | 9,995,915 | 18,704 | 16 | 652 | 18,052 | 20.1 |
| Minnesota | 5,611,179 | 18,870 | 10 | 623 | 18,247 | 43.3 |
| Mississippi | 2,986,530 | 4,754 | 6 | 296 | 4,458 | 18.5 |
| Missouri | 6,126,452 | 17,281 | 10 | 994 | 16,287 | 33.8 |
| Montana | 1,062,305 | 5,106 | 3 | 201 | 4 905 | 63.9 |
| Nebraska | 1,929,268 | 13,899 | 5 | 201 | 13 698 | 88.1 |
| Nevada | 3,034,392 | 1,218 | 6 | 141 | 1,077 | 10.1 |
| New Hampshire | 1,356,458 | 7,347 | 4 | 430 | 6 917 | 66.2 |
| New Jersey | 8,908,520 | 9,042 | 14 | 121 | 8 921 | 11.8 |
| New Mexico | 2,095,428 | 2,201 | 5 | 220 | 1 981 | 14.5 |
| New York | 19,542,209 | 25,932 | 29 | 950 | 24 982 | 14.4 |
| North Carolina | 10,383,620 | 5,820 | 15 | 593 | 5 227 | 8.8 |
| North Dakota | 760,077 | 15,482 | 3 | 205 | 15 277 | 242.3 |
| Ohio | 11,689,442 | 19,366 | 18 | 231 | 19 135 | 17.9 |
| Oklahoma | 3,943,079 | 8,989 | 7 | 362 | 8 627 | 28.6 |
| Oregon | 4,190,713 | 7,833 | 7 | 290 | 7 543 | 27.6 |
| Pennsylvania | 12,807,060 | 30,476 | 20 | 1 200 | 29 276 | 25.7 |
| Rhode Island | 1,057,315 | 1,138 | 4 | 155 | 983 | 11.3 |
| South Carolina | 5,084,127 | 3,943 | 9 | 195 | 3 748 | 11.3 |
| South Dakota | 882,235 | 9,684 | 3 | 155 | 9 529 | 139.1 |
| Tennessee | 6,770,010 | 6,950 | 11 | 321 | 6 629 | 14.3 |
| Texas | 28,701,845 | 27,628 | 38 | 815 | 26 813 | 16.3 |
| Utah | 3,161,105 | 2,711 | 6 | 200 | 2 511 | 15.7 |
| Vermont | 626,299 | 8,534 | 3 | 186 | 8 348 | 151.6 |
| Virginia | 8,517,685 | 3,104 | 13 | 143 | 2 961 | 5 |
| Washington | 7,535,591 | 7,724 | 12 | 537 | 7 187 | 15.9 |
| West Virginia | 1,805,832 | 2,772 | 5 | 205 | 2 567 | 15.5 |
| Wisconsin | 5,813,568 | 17,829 | 10 | 450 | 17,379 | 36.5 |
| Wyoming | 577,737 | 2,742 | 3 | 121 | 2,621 | 60.4 |
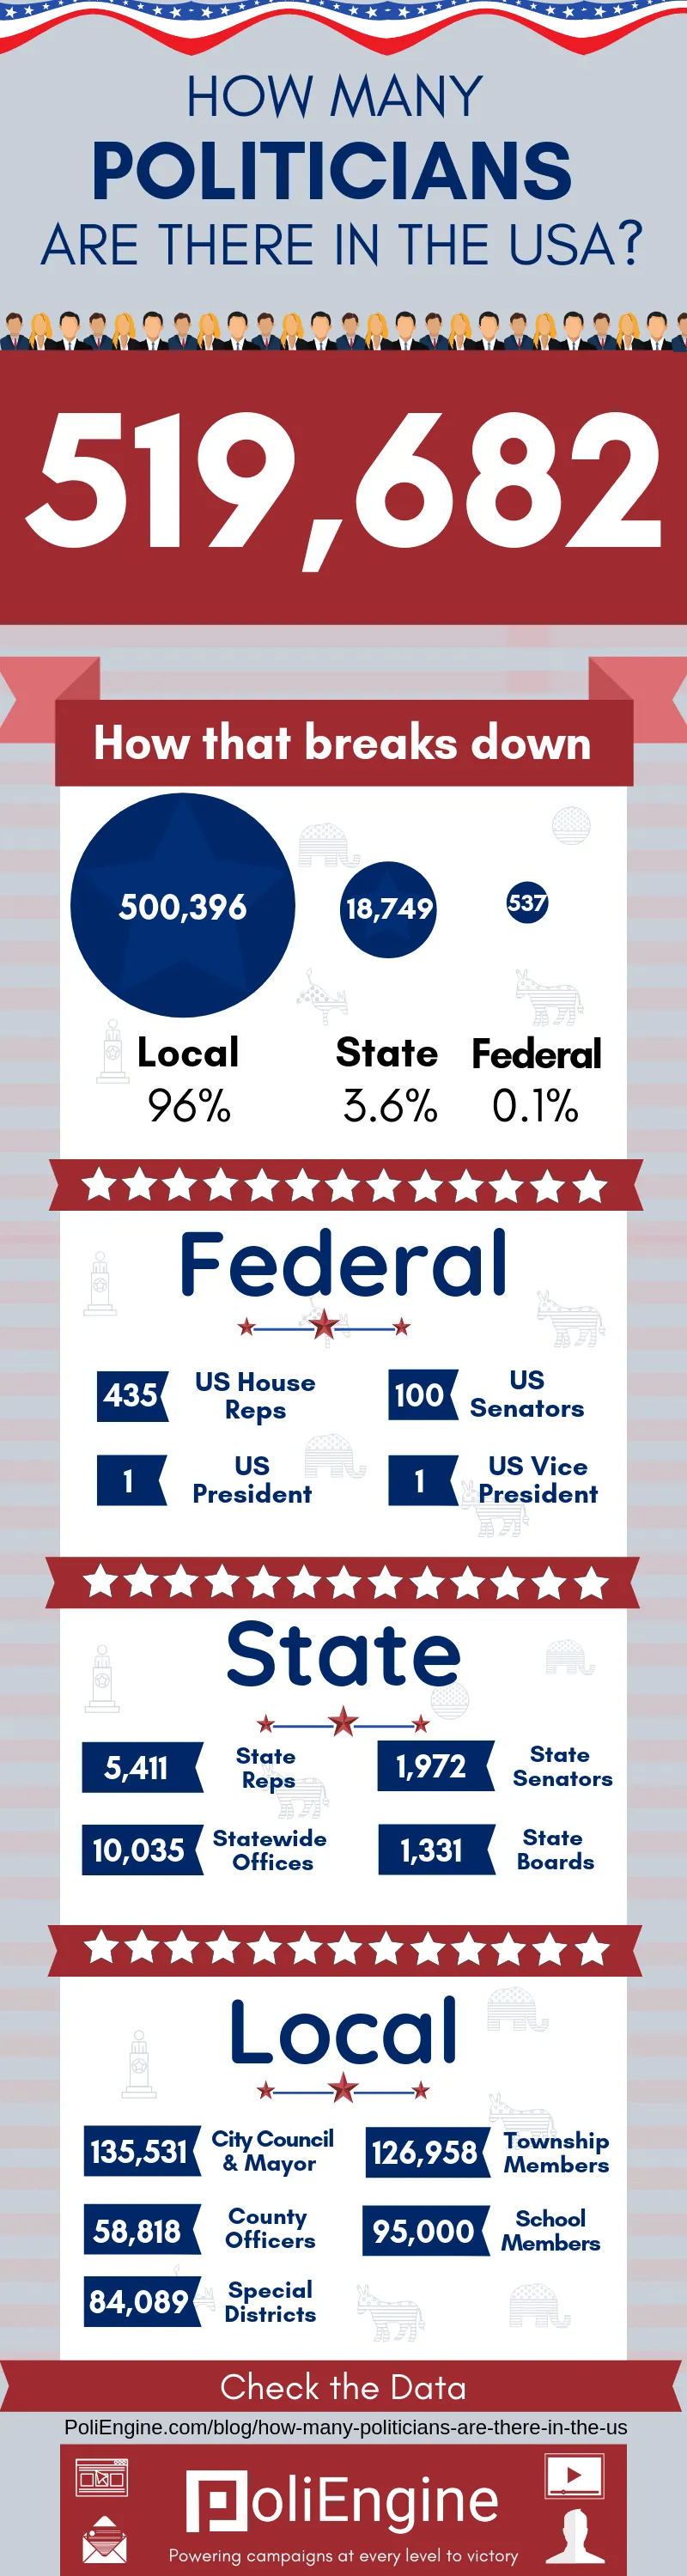
According to these data sources, there are 519,682 politicians across the United States. Of these, 535 are Federal politicians, 18,749 are State Politicians, and 500,396 are local politicians. Note that the state data is slightly lower than the totals, as we do not include territories in the table.
We break this down further by each level:
Federal Politicians
There are 435 United States Congresspeople, 100 United States Senators, and of course 1 US President and 1 US Vice President.
State Politicians
There are 5,411 State Representatives, 1972 State Senators, 10,35 statewide office holders, and 1,331 state boards.
The average number by state is 376.6.
Statewide office holders includes the big names, things like governor, or attorney general, but many states put office holders like administrative offices or judges. The vast majority of these seats are judicial, which are elected in a judicial district which is larger than a county area, so it is considered a statewide office.
Local Politicians
The vast majority of politicians, 96.2%, are local elected officials. These break down to 135,531 city elected officials, 126,958 township members, 58,108 county officers, 95,000 school board members, and 84,089 special district members.
States range wildly in how they administer local governments. For instance, 20 states administer what are called "townships", small municipal governments that are usually below 10,000 citizens. These are referred to as "towns" in New England states.
Special districts are unique to various geographic areas. For a comedic take on these (and a great explanation) see John Olivers great take down of special districts.