

Abstract
The capacity factor (CF) is a vital parameter used to quantify the performance and efficiency of a wind turbine. An increase in generation efficiency leads to higher wind power production, improving the economics within the growing global wind market. In this research, we use a data-driven statistical method to explore the contributions of the three main drivers of CF change: turbine aging, changes in wind speed, and technological improvements. We find that for the group of old turbines (operated before 2008) with an unchanging technical condition, wind increases contributed ∼10% to the increasing CF on average from 2010 to 2020. For new turbines (built from 2008 to 2020), technological improvements had a strong positive effect on CF from 2015 to 2020, exceeding the effect of wind increases and offsetting the effects of aging. On average, rising wind speeds increased CF by ∼5% per year, while technological improvements increased it by ∼12%. As the installed capacity of wind turbines grew, technological progress became the dominant driver in CF increase. However, poor site selection potentially compromised the positive effect on CF afforded by technology changes early in the decade.
Export citation and abstract BibTeX RIS

Original content from this work may be used under the terms of the Creative Commons Attribution 4.0 license. Any further distribution of this work must maintain attribution to the author(s) and the title of the work, journal citation and DOI.
1. Introduction
Capacity factor (CF), which is the ratio of the average power output and the maximum power capacity (Abed and El-Mallah 1997, McMillan and Ault 2008), is an important parameter for quantifying the efficiency of a wind turbine. With the rapid growth of wind power globally (Iniyan et al 1996, Sahin 2008, Zhao et al 2009, Esteban et al 2010, Hou et al 2010), increasing the CF is desirable to the wind power industry because higher CFs should increase efficient power generation and therefore profitability. The global installed capacity of wind energy increased from 181 GW in 2010 to 743 GW in 2020 (Murdock et al 2021), allowing it to become one of the largest renewables worldwide, second only to hydropower (Jung and Schindler 2022). As a country with a high efficiency of wind power generation, the annual CF in the US increased from 0.310 in 2010 to 0.353 in 2020, an approximate 14% jump that increased annual power generation by 27.99 TWh (GWEC 2021).
The CF depends fundamentally on the technical design of the wind turbine (including the blade radius and unit height), its performance state, and wind speed phenomena. Scrutinization of the various factors influencing CF can potentially improve the efficiency of wind turbines and power output by identifying issues of needed focus, for example in the design of turbine components, maintenance scheduling, or appropriate site selection for wind farms (Herbert-Acero et al 2014, Veers et al 2019). A deeper understanding of the drivers contributing to CF is paramount for further leveraging wind's potential role in the global energy mix.
Although it is commonly accepted that technological advances and appropriate site selection are key reasons for an increase in CF over time (McElroy et al 2009, Herbert-Acero et al 2014, Lewis 2016, Veers et al 2019), there is a lack of consensus on the relative roles of all contributing factors. For example, Zeng et al (2019) argue that half of the increase in CF can be attributed to wind speed (2.5%), and Millstein et al (2022) consider that the effect of wind speed (2.6%) was similar, but much smaller than technological progress, estimated at 25%. Potential sources of any discrepancy among various past estimations could be in the manner in which power generation is derived, failure to include the effects of turbine aging, and differences in the wind fields used in the analysis.
To address the research gap, we propose a statistical approach that categorizes the drivers of CF change into three distinct types: turbine aging, wind speed change, and technological progress. After filtering for data quality, we singled out 943 of the 1229 onshore wind farms in the continental United States for analysis. We focus on the USA because the available high-quality data represents 80% of the installed capacity, including all major wind farms in the country (figure 1). The variation of CF is calculated from the energy generation dataset of the 943 farms. Empirical aging parameters are then considered, and the impact of wind speed is estimated. Based on the kinetic equilibrium equation, we estimate the influence of technological progress by interannual iterations. These analyses allow us to explore the underlying reasons for wind capacity change in recent decades, laying a foundation for improvements in the coming decades.
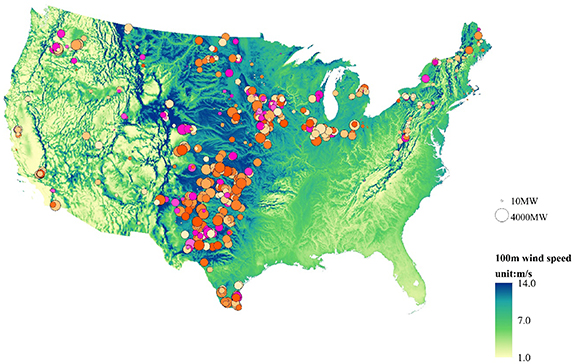
Figure 1. Spatial location of wind plants in the Continental US.
Download figure:
Standard image High-resolution image2. Methods
2.1. Datasets
To determine the annual peak capacities (MW) of wind turbines, we used information from the United States Wind Turbine Database (abbreviated as USWTDB, URL: https://eerscmap.usgs.gov/uswtdb/), which is updated continuously through collaboration between the Lawrence Berkeley National Laboratory, the US Geological Survey, and the American Clean Power Association. The database contains details of wind turbines and technical specifications collected from project manufacturers. All the records are digitized and position-verified from aerial imagery to ensure data integrity. Our analysis focused on land-based turbines that began operating between 1998 to 2020. We used latitude and longitude data to identify the location of 70 143 individual wind turbines, then reduced the dataset to include 1229 wind plants with the corresponding EIA plant IDs. After excluding the erroneous data, we used 943 available plants (52 565 individual turbines) in the analysis (figure 1).
We used the electricity generation by wind energy collected from the US energy information administration (EIA). The EIA-906, EIA-920 and EIA-923 survey forms include monthly and annual data on fuel consumption and generation at the power plant level. EIA-906 lists power plant data prior to 2004; EIA-920 includes data for years 2004–2007. Beginning in 2008, EIA-923 superseded the predecessor survey forms. The net generation collected by EIA is total electrical output net of station service, including the internal consumption in production process and power delivered to the grid. We use the raw data to calculate the annual electricity generation of onshore wind turbine farms to determine CF.
2.2. Calculation of CF
CF is net electricity generation (ENG) divided by rated peak (max) capacity (C) of a wind turbine, which for any given time period is expressed simply as:
In following, the CF for a group of n turbines in a farm is calculated as a weighted average:
Equation (2) can also be applied to all 943 farms we considered. In the analysis, we divided the wind farms into old and new vintage categories, using 2009 as the cut-off year. We separate them because the 'old-fleet' turbines installed prior to 2009 were both fewer in number and had a lower technical level than those that were built subsequently (new-fleet). Fleets installed yearly from 2009 onwards are referred to as '2009 fleet', '2010 fleet', ..., '2020 fleet'.
We use a kinetic equation to estimate the drivers of CF change (equation (3)) by including the effects of wind turbine aging  , wind speed variation
  and technological advances
  :
:
In the calculation, the net effect of wind variation on CF is estimated by comparing the expected and observed CF after excluding the aging effect. The impact of technological progress is quantified by the change in initial installed CF with that of past fleets.
2.3. Quantifying the drivers of CF
The CF of wind plants decreases naturally because of the physical depreciation of turbine components, such as generators, gears, and bearings (Byrne et al 2020). This loss in efficiency can be expressed as a percentage using an attrition rate (k) parameter that varies for wind farms operating in different geographical locations. In our study, we follow the analysis of Hamilton et al (2020) to assign a k value of 0.53% for old vintage (installed prior to 2009) power plants during their first 10 years of operation. From year 11 onward, the k value increases to 1.3%. In year 10, the CF of these old plants drops abruptly owing to the effect of a USA tax credit that applies only to 'new' plants: i.e. less money is invested in repairs and maintenance once the credit is removed on older plants (Hamilton et al 2020). We therefore use a k value of 3.6% in year 10. For new vintage power plants, we assign a value of 0.17% to k. In comparison, higher decay rates are reported for Germany, Sweden, and the UK, ranging from 0.6% to 1.6% (Staffell et al 2014, Olauson et al 2017, Germer and Kleidon 2019). In some of the figures, we use an attrition rate of k = 0.9% to illustrate specific examples; this value is the midpoint of the range of 0.5%–1.3% reported by Hamilton et al (2020).
The change in CF can be predicted as a negative compounding process that considers the cumulative loss over time (Staffell and Green 2014). Without considering wind variation and technological improvement, the CF of each group will decrease constantly after the initial operation year and the expected value of group CF ( ) is predicted by the following equation:

where  is the operation year of the turbine; and
  refers to the CF in the second year of operation. We use the CF at age two as the initial year-one value is often erroneous because of commissioning and teething issues with turbines that typically occur in year one (Hamilton et al
2020).
refers to the CF in the second year of operation. We use the CF at age two as the initial year-one value is often erroneous because of commissioning and teething issues with turbines that typically occur in year one (Hamilton et al
2020).
The CF of a wind turbine is also impacted by wind variation. Once the age effect is removed, comparison of observed and expected CFs effectively allows for the determination of the contribution of wind speed variation (α) on CF:
For this calculation, we assume that wind plants built in the same year have the same technology level, allowing technological progress to be reflected by the inter-group CF trend increase. To derive CF for the first year of wind power plants  , we combined the CF variation equation (equation (3)) and
  to exclude the effect of aging and wind speed variation between years:
We then can predict the theoretical CF of wind plants with physical aging based on  . Similar to the method used in the wind effect calculation, the impact of technological progress is reflected by the difference between the two expected values:

In following, the percentage change in the effect of technological progress (β) is expressed simply by the following equation:
3. Results
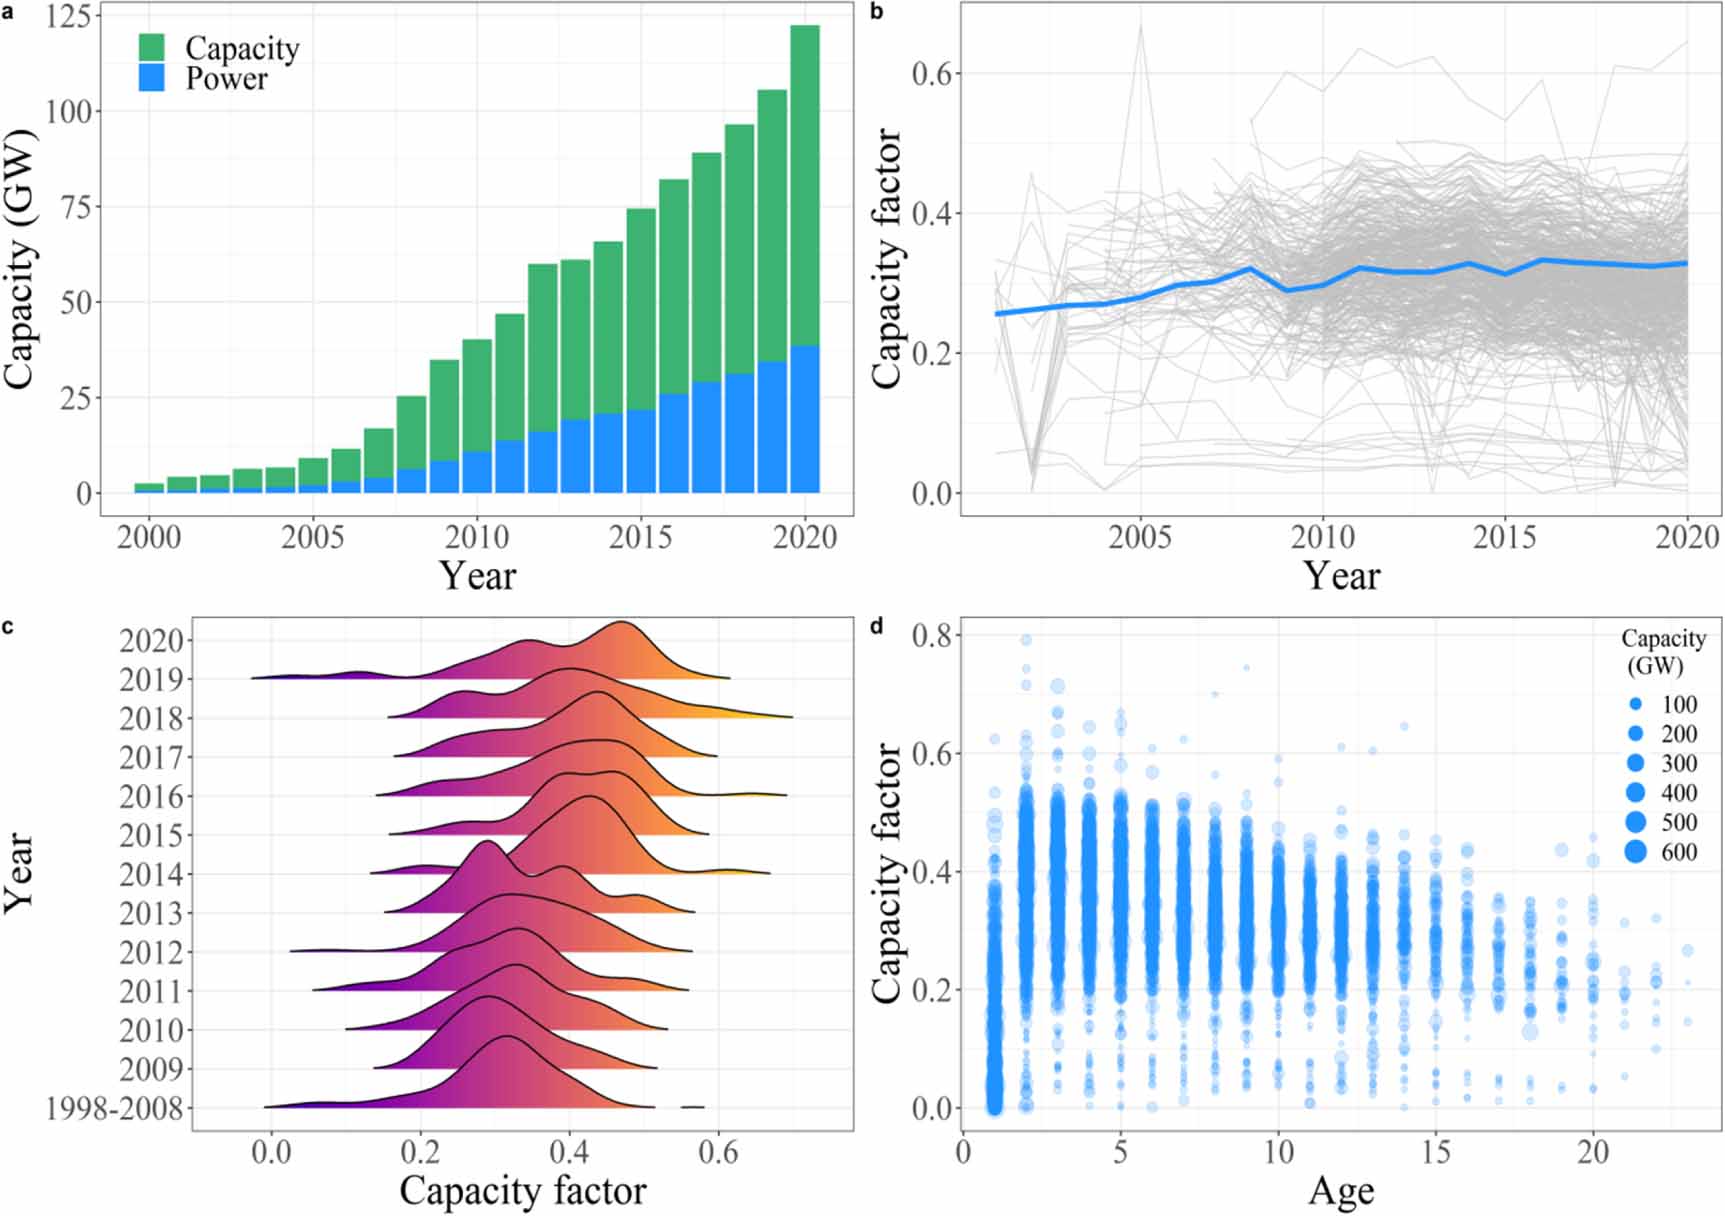
From 2000 to 2020, the installed wind power capacity in the continental US increased from 2.54 GW to 122.48 GW; and the generated power (per unit hour) rose from 0.64 GW to 38.56 GW (figure 2(a)). Over this two-decade period, the mean CF of the entire fleet grew gradually from 0.25 to 0.33 (figure 2(b)). This increase is largely related to the increase in the median initial CF value for individual fleets (table 1), which grew from about 0.3 in 2008 to 0.4 by 2020, but with a noticeable shift occurring in 2014 (figure 2(c)). The great annual variability in CF among the 943 individual plants over time reflects age-related declines, wind changes, and technological advances (figure 2(b)).
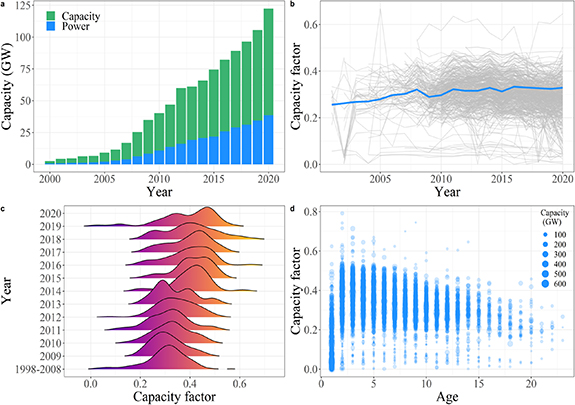
Figure 2. Wind energy resources in the Continental US from 2000 to 2020. (a) The accumulative capacity and generation power in each year. (b) The changing of CF over time for all 943 plants, highlighting in the mean CF. (c) The distribution of CF changes for each group. (d) The variation of CF against with age.
Download figure:
Standard image High-resolution imageTable 1. The number of plants and the initial CF2 for each group.
| Fleet | Old | 2009 | 2010 | 2011 | 2012 | 2013 | 2014 | 2015 | 2016 | 2017 | 2018 | 2019 | 2020 |
|---|---|---|---|---|---|---|---|---|---|---|---|---|---|
| Number of plants | 201 | 96 | 50 | 71 | 126 | 9 | 37 | 56 | 61 | 56 | 53 | 45 | 82 |
| CF2 | 0.30 | 0.29 | 0.34 | 0.33 | 0.34 | 0.36 | 0.41 | 0.42 | 0.43 | 0.42 | 0.42 | 0.41 | 0.41 |
A downward trend in CF related to aging for the 943 wind farms considered is discernable (figure 2(d)). In plants installed prior to 2009, the change in observed CF declines from 0.33 in 2011 to 0.28 in 2020, or by 0.015%–0.035% over the 10 year period (figure 3(a)). The effect of aging on electricity generation from 2010 to 2020 is roughly 3.67 TWh, based on a hypothetical annual decrease of 0.9% for the old fleet (figure 3(d)).
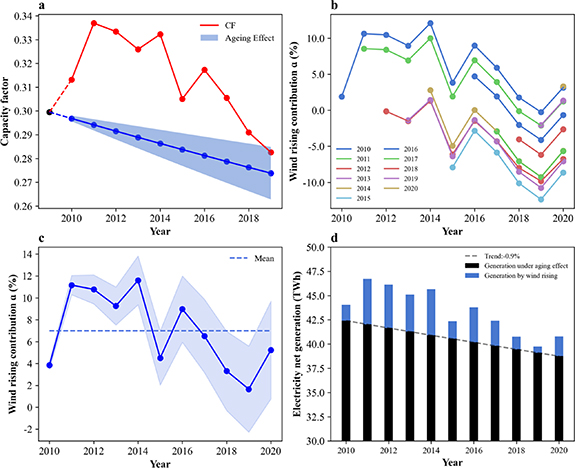
Figure 3. The effect of wind variation on CF for 201 old plants. (a) The variation of observed CF (red) and theoretical CF impacted by aging effect (blue, ranging of k = 0.5%–1.3%). (b) Wind effect estimated under different beginning years from 2010 to 2020. (c) Wind effect estimated by setting the initial CF to the long term mean value. The blue line (k = 0.9%, the median of experience range) and the shaded area (k = 0.5%–1.3%) indicate the proportion of wind contribution on power generation based on a range of attrition rate k. (d) Wind power generation under the combined effect of temporal wind variability and turbine aging. The black bar represents the amount of generation if only physical deprecation exists. The difference of actual and predicted output is shown in the blue bar, which is the extra generation by wind variation.
Download figure:
Standard image High-resolution imageThe estimated wind contribution to CF change for the old fleet is 7% on average for the period 2010–2020 (figure 3(c)). The boost in CF owing to wind increases was highest (∼10%–12%) in the early part of the period, reducing to 4%–6% by the end of the decade (figure 3(b)). Rising wind speed contributed to the highest CF increases (0.02–0.03) in the years with the greatest observed wind speeds (2011, 2014 and 2016), aligning with the trend of stronger winds following 2010, as reported by Zeng et al (2019). After 2016, the wind contribution to CF change declined, approaching zero by the end of the decade (figure 4(b)). The mean contribution of elevated wind speeds was 5 ± 1%, ranging from 2% in 2015 to 11% in 2014 (figure 4(b)).
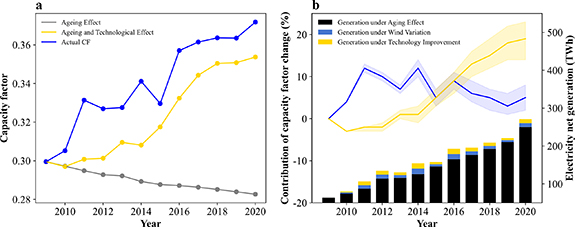
Figure 4. The effect of wind variation and technology improvement on CF for all 943 plants. (a) The variation of CF driven by aging (grey), technology (yellow) and wind variation (blue). (b) Drivers of CF and their influencing contribution of power generation. The histogram of black color represents expected output based on installed CF impacted only by aging effect. The yellow and blue bar represent the extra generation produced by technology improvement and wind variation. The lines plotted in the same color represent the percentage of technical and wind contribution with the uncertainty range drawn in the surrounding shaded area. The sum of the three bar charts indicates the realistic power generation each year.
Download figure:
Standard image High-resolution image
Care is needed when interpreting these trends because there were fewer fleets in the earlier years; and some of those early fleets were associated with high wind-related contributions to CF increases (figure 3(b)). Overall, the effect of wind on energy generation is equivalent to 0.65–4.74 TWh yr−1, or 2.85 TWh on average (figure 3(d)). The increase in power generation due to wind is an estimated 10 ± 3% above the expected generation value. Here the uncertainty largely reflects the uncertainty of aging effect, which compounds over time.
For all fleets, the CF of aging turbines declines over time, but the CF and power generation of the entire fleet increase (figure 4). Under the 0.9% attrition rate in the example, the wind speed increase was a strong influencing factor for wind power generation throughout the period. The effect of wind speed after 2010 is mostly positive (figure 4(b)), which corresponds to Zeng's study showing the turning point in the rebound of surface wind speed was about 2010. The continental data we use in this analysis shows relatively low wind speed prior to 2010. We recognize that the performance of wind farms is sensitive to temporal variations in local wind speed (Carvalho et al 2012, Collins et al 2018), especially for plants with large installed capacities. Therefore, on a national scale, even a modest increase in wind speed can be a big boost to the overall energy output.
The effect of new wind power technology became apparent beginning in 2014 (figure 2(c)), after which the mean CF at installation increased from about 0.3–0.35 in 2020. The contribution of technology improvement in the example shown in figure 4 exceeded the effect of greater wind speeds in enhancing CF after 2016. On average, the increase was 12 ± 0.1% for the decade. Regarding power generation, wind speed increases led to an average of 8 105 TWh boost in power generation (figure 4(b)). Advanced technology contributed another 20 034 TWh of energy generated (figure 4(b)). The contribution of wind speed changes to this total amount of increased energy output is 29% versus 71% for technological advances.
4. Discussion
Our determination of a 5 ± 1% boost in CF related to wind speed increases is about double that (2.5%–2.6%) determined by Zeng et al (2019) and Millstein et al (2022). Our inclusion of an aging term in the estimation of CF change is likely the main cause of this difference. Here, we admit there is not a good means to accurately estimate the change in those prior results if aging is considered due to the different data and analysis methods we used. What is certain, however, is that failure to consider the negative impact of natural aging of the wind turbine on the CF leads to an overestimation of other drivers by some extent.
Another potential cause of the difference in our estimates and those before is the data used: i.e. wind farm output data (this study) versus the windspeed data. Use of the latter is problematic because of the potential for wind speeds to be underestimated if the wind observation network fails to accurately capture the wind fields where the farms are located. A coarse network likely fails to capture high variability in wind speeds that potentially exist at very large scales (small areas).
Low-resolution measurements, both in the spatial and temporal sense, may also lead to inaccurate wind estimates if extremes are aggregated to values that are within the cut-in and cut-out range where electricity is generated (Akdağ and Güler 2013, Pryor and Barthelmie 2021). Even dedicated probability density functions (e.g. Weibull, Rayleigh, or Logistic distribution) developed for wind resources (e.g. Akorede et al 2013, Akyuz et al 2013, Boudia et al 2013, Maatallah et al 2013, Wu et al 2013) may have great uncertainty if the parameters of distribution functions vary greatly over small areas (Kwon et al 2013, Nemes and Munteanu 2013). Our output-associated approach allowed us to isolate the effect of wind by excluding the loss in CF related to aging. This approach makes it possible to estimate the impact of wind speed on power generation in regions where high-quality observations are not available.
Compared with wind speed changes, technological progress is not limited by spatial or temporal factors. Over time, turbine design changes have allowed for utilizing sites with moderate suitability in wind resources (Ha et al 2013). Technological progress is also achieved by modifying the design and management of wind turbines, such as strengthening the supervision and maintenance of wind farms or promoting relevant preferential policies according to actual electricity demand. For instance, advanced layout optimization was used to optimize the placement and the selection of turbines (Chowdhury et al 2013), leading an improvement of 6.4% in CF of the wind farm.
While the 12% increase in CF owing to technological improvements during the decade was expected (Staffell and Pfenninger 2016), we did not find this benefit in the early years of the decade when the total installed capacity was small. One plausible explanation is that some of new sites during this early period may not have been ideal for generating wind energy reliably, for example due to limitations of wind phenomena, grid infrastructure, and other issues (Beckman and Xiarchos 2013). The amount of electricity produced by wind energy at that time was also regulated by policies. Another possible reason is that grid issues may arise as the construction of wind turbines are increasingly integrated with the electric grid (Bolik 2003). For example, if there is an overabundance of wind power on the grid, it may be necessary to curtail some of the power generated by the wind turbines (Shafiullah et al 2012), leading to a lower CF.
5. Conclusion
We find that the overall CF increased gradually in the continental USA in the last decade from 0.25 to 0.35. The substantial annual variability in CF changes among the individual plants reflects the combined effects of age-related declines, wind changes, and technological advances. The effect of aging on electricity generation from 2010 to 2020 was roughly 2–3 TWh, or about 0.9% per year, but we note some uncertainty in this rate of change. Wind speed increases in the first several years after 2010 contributed to boosting CFs, but the wind contribution greatly reduced in the latter part of the decade. Advanced technology contributed significantly to the increase in CF at installation from about 0.3 in 2014 to 0.35 in 2020, contributing to the generation of 20 034 TWh of energy above expectation. Wind speed increases led to an 8 105 TW boost in power generation, mostly in the first half of the decade. The associated effects on nation-wide CF were 5 ± 1% and 12 ± 0.1% for wind and technology improvements, respectively. Overall, this study highlights the importance of considering the effect of aging, wind speed changes, and technological advances in analyzing changes in wind power generation efficiency.
Acknowledgments
This study was supported by the National Natural Science Foundation of China (Grant No. 42071022), Guangdong Basic and Applied Basic Research Fund (2022A1515240070) and the start-up fund provided by Southern University of Science and Technology (No. 29/Y01296122). ADZ participation was associated with the Sustainable Pathways to Expand ASEAN Renewables project (e-ASIA Joint Research Program). We thank the United States Wind Turbine Database (USWTDB) for providing the wind project information. We also thank the United States Energy Information Administration (EIA) for detailed electric power data on wind energy.
Data availability statement
The data that support the findings of this study are openly available at the following URL/DOI: www.eia.gov/electricity/data/eia923.
Author contributions
Zhenzhong Zeng: Conceptualization, Methodology Jiayu Xu: Methodology, Software, Writing—Draft Junyu Zou: Methodology All other authors: Writing—Review & Editing.