The app for independent voices
Evergreen note: “Analytics” are not mere numbers. They’re models: ways of bridging practical (what happens on ice) and theoretical knowledge (what will or can happen based on prior events). They help define the conditions of performance over a period of time rather than glimpsing raw plus-minus. The climate versus the weather; defining the signatory rather than just the signature. These are not meant to be a right or wrong way to look at a hockey game; they’re meant to be useful in understanding the conditions of hockey itself.
The Stat: Regularized Adjusted Plus Minus (RAPM)
The question RAPM attempts to answer: What does a player’s impact look like if we try to evaluate their impact in isolation, using a fixed version of plus/minus?
How it answers that question: RAPM is a counterpoint to plus/minus. Let’s say Wyatt Johnston is a –3 for the night. He scored twice at even strength, making him a +2 offensively, but he was on the ice for five goals against, making him a –5 defensively. Overall, a –3 seems bad. It looks like Johnston was good offensively for the night, really bad defensively, and therefore a net negative overall.
However, what if two goals that Johnston was on ice for was on the penalty kill? What if Ryan Suter and Radek Faksa were on the ice on three of the five occasions where Johnston ate a minus? What if the opposition was Connor McDavid and Leon Draisaitl in three of those five occasions? What if this all on the night of a back-to-back?
This is where plus/minus fails, and what RAPM tries to account for. Johnston being a –3 for the night is certainly bad. But that doesn’t tell us about his impact; it just tells us about his outcomes. If he’s a –3 but spent a good portion of his shifts with weaker players against elite opponents while still having an outward impact, then we need some way to untangle all of that context so that Johnston’s value is accurately defined. That’s why instead of using goals, which are subject to noise, models like RAPM use shot attempts, which provide enough data to identify patterns in a player’s impact.
RAPM isolates a player’s impact by calculating the following:
an offensive (and defensive) plus/minus shot differential for the teammates they didn’t play with
an offensive (and defensive) plus/minus shot differential for the opponents they played against
an offensive (and defensive) plus/minus shot differential for the scorestate
an offensive (and defensive) plus/minus shot differential for shift starts
an offensive (and defensive) plus/minus shot differential for scheduling (i.e. back to backs)
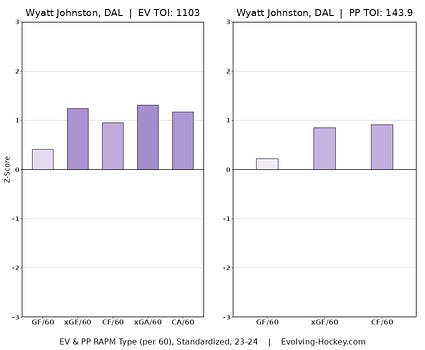
All of these are aggregated and filtered through a mathematical equation (called regression analysis) trying to estimate the positive versus negative relationships within each factor. The end result is each relationship baked into their shift-to-shift impact on goals scored per hour at even strength, expected goals, shot attempts, expected goals against, and shot attempts against. And thus we end up with the chart on the bottom of Wyatt Johnston.
These differentials are measured against Z-scores, which show us the deviation from the mean. Upward and blue = above the mean. Downward and red = below the mean.
For the 2023-2024 season, when we isolate Johnston’s impact from shift to shift, we see that his isolated impact on goals (first bar) was a positive: nothing elite, but because these are just observed goals, perhaps he was just unlucky. His isolated impact on shot quality or expected goals, was much higher. And so forth. TL;DR Version of this chart: for the 2023-2024 season, Johnston had a strong positive impact, across the board, from shift to shift compared to his teammates.
Source: evolving-hockey.com/blo…

