The app for independent voices
Evergreen note: “Analytics” are not mere numbers. They’re models: ways of bridging practical (what happens on ice) and theoretical knowledge (what will or can happen based on ice based on prior events). They help define the conditions of performance over a period of time rather than glimpsing raw plus-minus. The climate versus the weather. These are not meant to be a right or wrong way to look at a hockey game; they’re meant to be useful in understanding the conditions of hockey itself.
The Stat: Moneypuck’s Deserve to Win O’Meter.
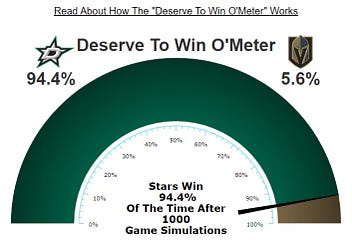
The question the Deserve to Win O’Meter attempts to answer: What is every team’s chance of winning a game, if we were to simulate it 1000 times?
How it answers that question: Moneypuck's “DOM" assume average goaltending for both teams. How that is calculated comes down to adding up the individual expected goals. Moneypuck's expected goal model has some slight variations from other expected goal models. In this case, the following variables are used to assess the probability of a shot becoming a goal by the following.
1.) Shot Distance From Net
2.) Time Since Last Game Event
3.) Shot Type (Slap, Wrist, Backhand, etc)
4.) Speed From Previous Event
5.) Shot Angle
6.) East-West Location on Ice of Last Event Before the Shot
7.) If Rebound, difference in shot angle divided by time since last shot
8.) Last Event That Happened Before the Shot (Faceoff, Hit, etc)
9.) Other team's # of skaters on ice
10.) East-West Location on Ice of Shot
11.) Man Advantage Situation
12.) Time since current Powerplay started
13.) Distance From Previous Event
14.) North-South Location on Ice of Shot
15.) Shooting on Empty Net
Moneypuck's model also accounts for so called "flurries" -- you've seen this a thousand times. A shot is generated on net, and a player tries to bludgeon the puck past the goaltending on a series of extraneous tries. The general conceit here is to think of team performance in terms of distributions rather than averages.
Attached is the DOM for Dallas vs Vegas in Game 3 of the 2024 Stanley Cup Playoffs. You may remember this game as an absolute butt whipping. The Stars outshot the Knights 99 to 62, and had the high danger shot edge 23 to 4 (!). Dallas had a 93.4 percent chance to win that game across 1000 simulations, and yet despite that, Vegas was one goal away from winning it in overtime. A lot of people mock these whenever a team gets "goalied" but it's not meant to predict who should win the game -- but who should win a game with the game's statistical profile on a long enough timeline. The fact that we sometimes live in the one universe among many in which that Game 3 was that close only speaks to variance and nothing else.
Further reading:
(Inspired by)


