Discover more from Stewdamus' Chart Analysis
Coinbase Denies Retail Buy-In at 59-60k!
#Blackrock Trading Coin Helps to Indicate Our Flash Dump Low
Traders,
I've been seeing a ton of traders who wanted to buy BTC at 59-60k but their transaction "failed". There is a reason why I am now calling BTC, Blackrock Trading Coin and why I have been extra cynical and skeptical about Blackrock's crypto trading exchange, Coinbase, as well as their entry into the crypto space via ETF. But I won't get into conjecture or conspiracy here. Just watch. You'll witness more shenanigans just like this the higher price goes.
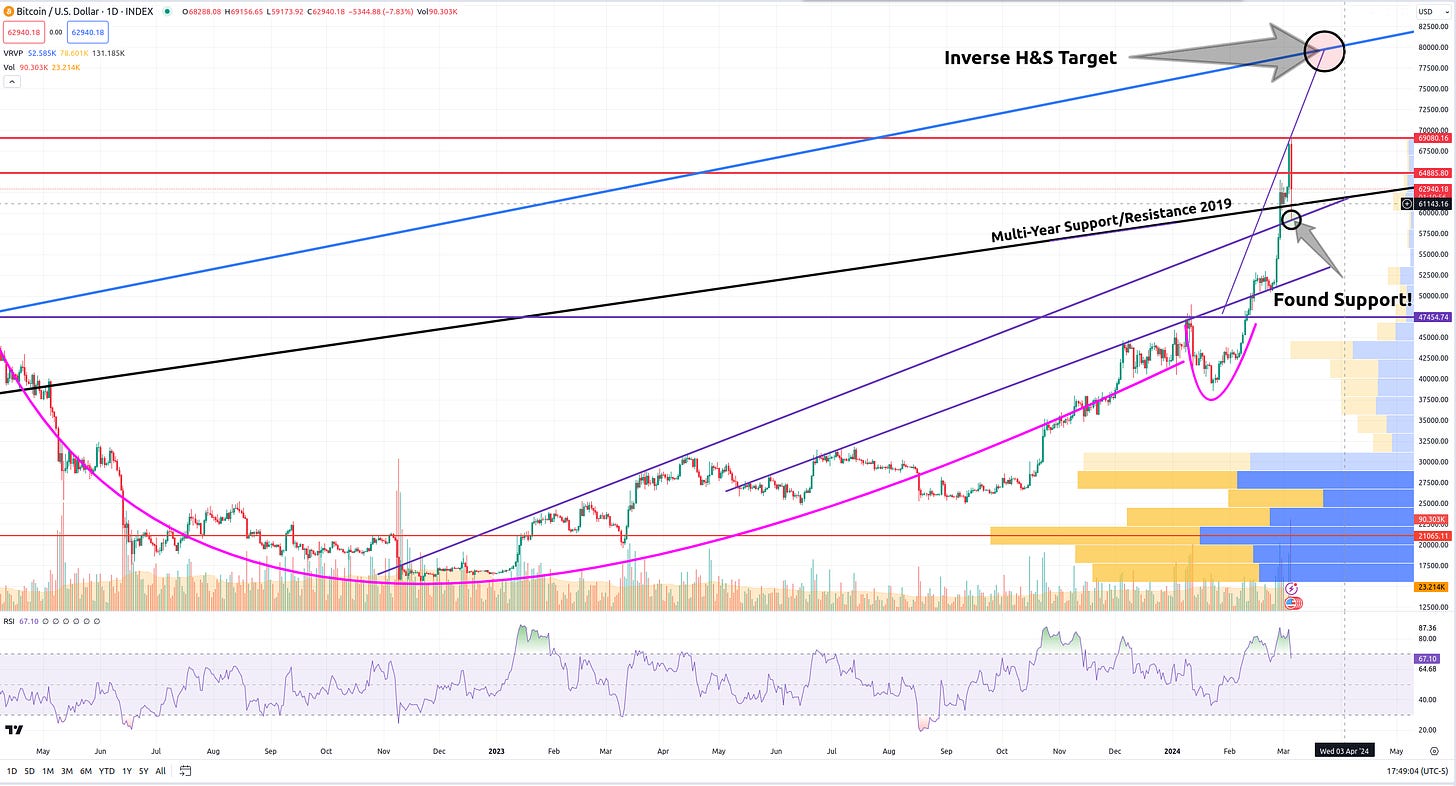
Anyways, we can use Coinbase's buying rejection at 59-60k as further proof that this was the bottom of our liquidation flush. Notice how on my chart the wick down touched exactly that top ascending purple trend line. Once hit, we quickly bounced back above my multi-year ascending support/resistance (now support) trend line from 2019. As long as we stay above this line, I am completely comfortable and confident that our upward journey will continue.
Remember, there is no escaping the math here. ETFs are simply demanding far more than miners can produce. Only 24% of BTC remains liquid. And there is burgeoning institutional demand for BTC ETFs in a growing number of countries. All this before halving. There is no way to get around these fundamental facts. Fundamentals supersede technical analysis in this case. And this is coming from someone who touts technical analysis most of the time.
Fundamentals are a priority but we can see that technicals are supporting fundamentals. Look also at that RSI. Finally, it gets a break and is able to drop back below overbought territory. Altcoin RSI readings look even better.
I suspect when all the dust settles and price closes out this candle we may even be back above that 64.8k support. But if we're not and we settle anywhere above my multi-year line of support, I remain bullishly biased and expect us to hit our inverse H&S target of 79k soon.
Best,
Stewdamus
Subscribe to Stewdamus' Chart Analysis
Prophesying the price action of markets one chart at a time.


