

Why is Gold Acting Like a Tech Stock?
Why is Gold Acting Like a Tech Stock?
When the price of gold and the relative price of technology stocks move closely together, as they have since 2018, this has historically indicated a higher overall stock market.

Sometimes, old analyst hacks like me don’t even understand why we peruse over something – until we see it. Recently when haphazardly stumbling into an overlay chart of the price of gold compared to the relative price of technology stocks – why I looked at this relationship, I can’t tell you -- I was shocked by how closely they have been moving together since 2018.
Chart 1 shows a daily chart of the spot price of gold with the relative price of the S&P 500 technology sector, and it has a +0.94 correlation since 2018! Correlation does not imply causation, but still, why is the price action of gold acting so much like a tech stock? It doesn’t appear to be just some short-term spurious correlation since their respective price actions have been almost lockstep for over six years. But I must confess, I can’t figure out why. Let’s face it, gold is not exactly a growth stock exhibiting a remarkable innovative character. And tech companies don’t appear to be in limited supply, are not overly shiny, and are certainly not the first thing investors think of buying when they are scared and want someplace to securely park funds.

Gold has long been considered a great investment choice during times of turbulence. Because the U.S. has essentially experienced three bear markets since 2018 (almost a 20% decline in 2018, a 34% collapse during the pandemic in 2020, and a 26% reduction in 2022) and during this time large cap technology stocks have had a good run, perhaps tech is increasingly being viewed as a safe haven? But I can’t prove this notion. Bottom line, I don’t know why tech and gold have become inseparable in recent years, but as it turns out, it is not a unique situation.
A History of the Gold-Tech Relationship
A rolling 36-month trailing correlation between the price of gold and the relative price of technology stocks is shown in chart 2. Since being removed from its $35 an ounce peg in 1971, gold has had a volatile relationship with tech stocks. The 3-year rolling correlations have fluctuated widely from about -0.8 to +0.95 and have averaged -0.26. It makes sense they have an inverse overall relationship. Rough economic times – often causing the overall stock market to decline -- is what frequently attracts investors to gold. Conversely, during major stock market runs, gold is often abandoned in favor of some hot tech stocks.

What is more difficult to understand are multiple periods when gold and tech stocks are strongly positively correlated. A closer inspection of chart 2, however, suggests this volatile correlation history is not likely simply spurious or random. Note the red dotted line at +0.4 correlation on the chart. There have been only two major periods when the correlation did not rise above this line – during much of the 1970s and from just before the dot com crash in the late 1990s until the end of the 2008-09 Great Recession crisis. Alternatively, during most of the 1980s, at least the first seven years of the 1990s, and much of the time since 2009, the correlation has often exceeded +0.4.
The 1970s was a decade of turbulence emanating from runaway inflation. Similarly, the period just before 2000 until 2009 was also often catastrophic as the economy dealt with high valuations in the stock market and newfound subpar economic growth. During these difficult times – both in the economy and the stock market – the correlation between gold and tech hardly ever made it above +0.4, and on average was much lower. By contrast, during the 1980s, much of the 1990s, and since the 2008-09 crisis, when economic results and stock market outcomes were more favorable, the correlation was often above +0.4.
Chart 2 also illustrates the most negative correlations primarily occur just before difficult economic and stock market results. During much of the treacherous 1970s, the correlation was near it range lows of -0.7 to -0.8. In addition, major bottoms in the rolling correlation occurred near the -0.7 to -0.8 range just before the economy and the stock market were nearing difficult periods (e.g., 1981, 1987, 1998-00, 2003, and 2007).
Overall, the historical rolling correlation between gold prices and the relative total returns of the technology sector, although volatile, does not appear to be random. Periods of strong positive correlations have been aligned with better economic conditions and satisfying stock market results, whereas lower correlations were typically associated with more turbulent economic and stock market times.
The Gold-Tech Correlation & the Stock Market?
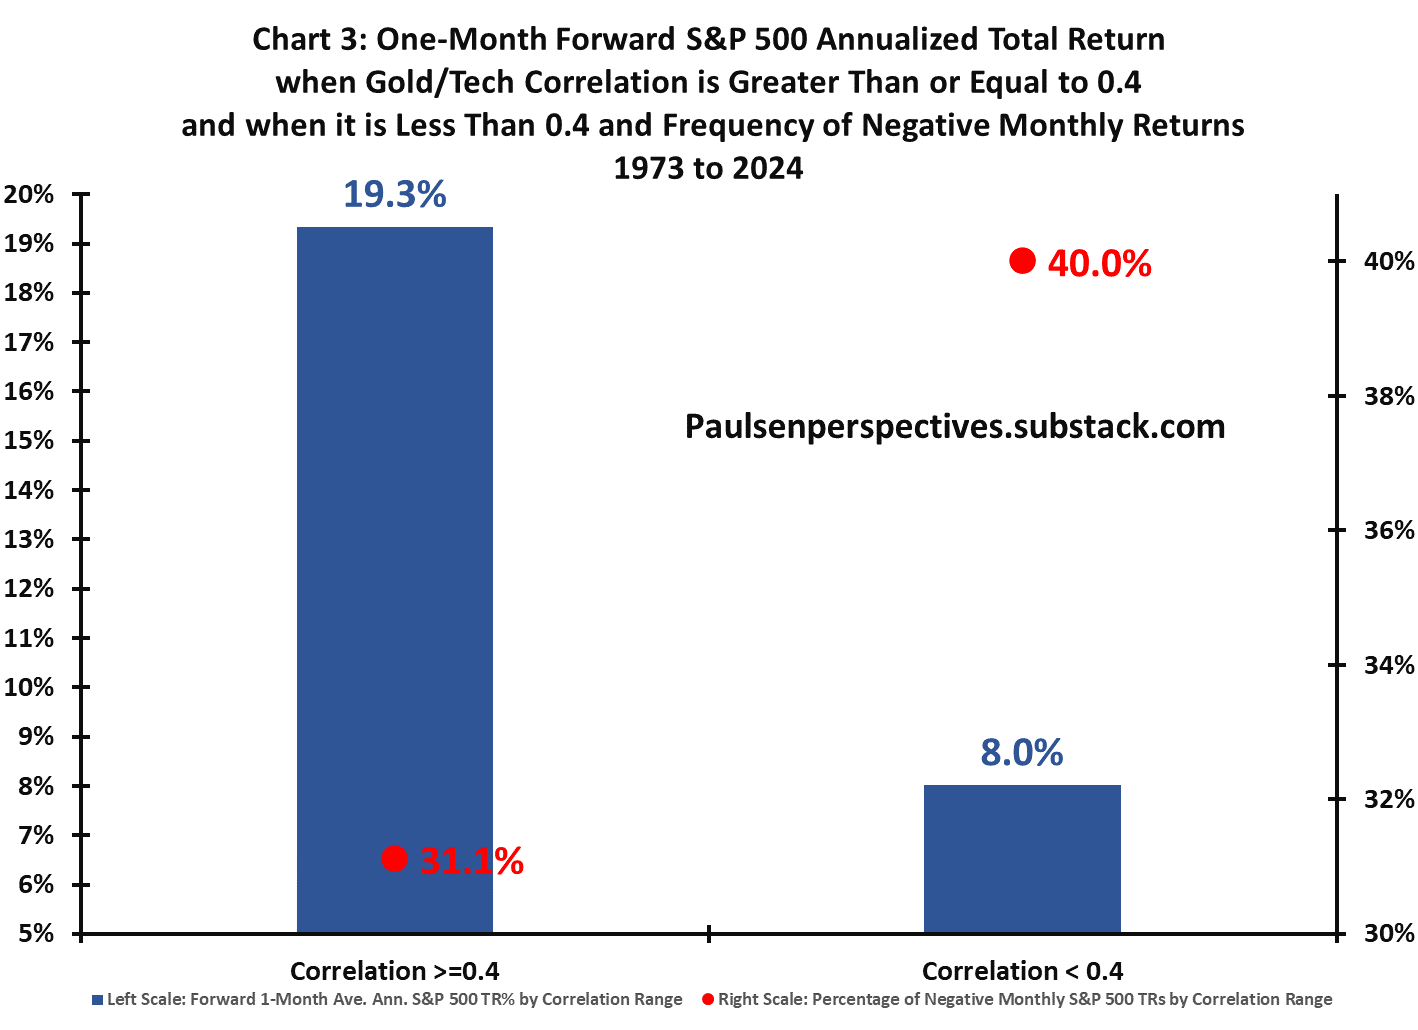
As illustrated in chart 3, the value of this correlation for investors is its historic efficacy in indicating future stock market returns. For all months since 1973, when the correlation was higher than or equal to +0.4 (red dotted line on chart 2), the one-month forward average annualized S&P 500 total return was 19.3%. In addition, during the 225 months when the correlation was +0.4 or better, the S&P 500 suffered a future one-month loss only 31.1% of the time. By contrast, during the 390 months when the correlation was less than +0.4, the S&P average annualized forward monthly return was only 8% and it suffered negative future monthly returns 40% of the time.
Final Comments
I admit this is one weird relationship that is not widely followed. But the correlation between gold prices and large cap relative tech returns does seem to provide profitable information. Historically it yields good indications about when the stock market is likely to provide favorable returns and when caution with stocks in warranted.
“Why” this correlation has provided such competent investment advice for more than 50 years is open for debate. I surely will not pretend to know the answer. But permit me a theory.
My guess is gold has always been used by investors both as a safe haven against a perceived stock market collapse and as a diversifier buffering the volatility of other investments during an ongoing bull market. What is important for future of stock returns is how investors are using gold. Consider the four distinct outcomes comprising the gold-tech stock correlation.
If gold is being sold as tech stocks rise, this negative correlation indicates a lack of worry by investors about high and escalating valuations within the stock market (i.e., a contrarian signal of too much bullishness). If gold is being sold while tech stocks fall, this positive correlation suggests panic and too much bearishness (i.e., both gold and tech stocks are simultaneously being sold probably because recession/deflation fears are spiking). When gold is bought while tech stocks decline, this negative correlation suggest investors fear a collapse and are rushing toward gold for a safe haven. Finally, when gold and tech stocks rise together, as they have since the start of the current bull market, the positive correlation indicates investors are using gold as a diversifier (perhaps recently, as a perceived offset to their Mag-7 stock return volatility?) in an ongoing bull market.
Regardless of whether this theory is on the mark or simply nonsense, as the stock market currently works through a period of consolidation, the positive gold-tech stock correlation is a comforting reminder there are still indicators suggesting the bull market is not yet over.
Thanks for taking a Peek! Jimp
Disclosures__________________________________________________________________
Please note that stocks are inherently risky. Any stock can lose most of its value at any moment, including any stock I mention here. You should never rely on a single source for investment decisions, including me. I am a retired investment strategist offering opinions and observations on the markets, the economy and companies. You should do your own research, and also consult a qualified financial planner and investment advisor before making investment decisions.
This communication has been prepared for your informational purposes only. This material is for illustration and discussion purposes only and are not intended to be, nor should they be construed as financial, legal, tax or investment advice. This material presents information through the date indicated, is only a guide to the author’s current expectations and is subject to revision by the author, though the author is under no obligation to do so. The views expressed herein are solely those of the author. This material should not be construed as a recommendation, or advice or an offer or solicitation with respect to the purchase or sale of any investment. The information in this report is not intended to provide a basis on which you could make an investment decision on any particular security or its issuer.
Certain information has been provided by and/or is based on third party sources and, although such information is believed to be reliable, no representation is made is made with respect to the accuracy, completeness or timeliness of such information. This information may be subject to change without notice. I make no obligation to maintain or update this material based on subsequent information and events or to provide you with any additional or supplemental information or any update to or correction of the information contained herein. Any opinions and assumptions expressed herein are made as of the date of this communication and are subject to change and/or withdrawal without notice. No liability is accepted by the author for any losses that may arise from any use of the information contained herein.
Any financial instruments mentioned herein are speculative in nature and may involve risk to principal and interest. Any prices or levels shown are either historical or purely indicative. This material does not take into account the particular investment objectives or financial circumstances, objectives or needs of any specific investor, and are not intended as recommendations of particular securities, investment products, or other financial products or strategies to particular clients. Securities, investment products, other financial products or strategies discussed herein may not be suitable for all investors. The recipient of this report must make its own independent decisions regarding any securities, investment products or other financial products mentioned herein.
Great Commets Marianne! I think they ring true! I too see investors increasingly perceiving tech is a safe haven. And, you are correct, this positive correlation could go away quick if the Tech stars' EPS disappoint! Thanks for sharing your thoughts !
Thanks for sharing this interesting coincident relationship! I suspect there is one explanation:
Tech’s - software and now hardware - meteoric rise as driver of US stock market returns - is a reflection of quality factor in investing when the market is hit with massive shocks and uncertainties in the recent past 5 years. I would like to look at an important criteria of quality as large positive gap between ROE and cost of capital.
Market seems to look at tech as safe haven and tech stocks are often included in quality investing basket (ETFs).
Like you said, tech and gold are great diversifiers and AI and digital transformation have become a dominant theme in investing.
That may speak for the past 5 years but if tech stocks do not deliver the earnings growth baked into the price, I suspect gold may not fall with them and may hold up.