Visualising Sidekiq Jobs With Flame Graphs
Visualising Sidekiq Jobs using traces is essential for production apps. Flame Graphs and traces are powerful tools. Let's use them.
The Problem
I’ve worked with a lot of teams who use Sidekiq in their Rails app.
Not a single one understood what the jobs were doing.
They’d disagree.
They’d say something like:
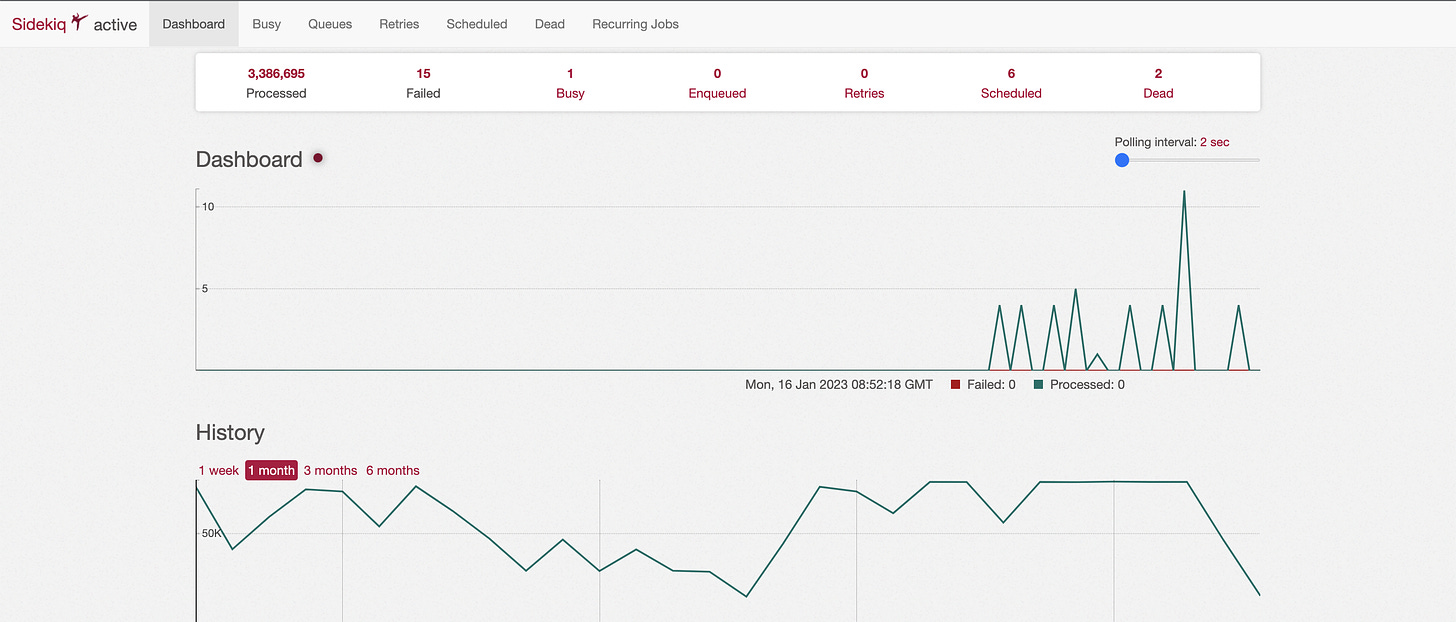
Oh, I just look at the Sidekiq Web UI. It’s great!
The Sidekiq Web UI
This ^^ is, apparently, a great monitoring tool for production systems in 2024.
Not to piss on anyone’s chips… but this is woefully inadequate.
To understand why we need to back up.
What’s the point of observability?
Here’s my definition:
To quickly answer any question of your app running in production.
The more arbitrary and rare the question, the better your observability.
Over the last 2 years, I’ve asked many questions of Rails apps I help manage.
At the start our team couldn’t answer the most basic of questions.
As I’ve improved the observability, we can ask more complex and nuanced questions.
Important Sidekiq Questions
Which incoming request enqueued this job?
Which user enqueued this job?
How many times did this job get retried?
How long did each retry take?
How long did all retries take?
Is exponential backoff working as I expect?
What caused the retry? Database request? API request?
What was the error that caused the retry?
Which line in the code caused the error?
Where does each retry fall in the performance percentiles?
Did this job go to the dead queue?
How long did it take from enqueue to execute?
Is the queue for this job performing within it's SLA?
Did the failure of the job happen at the end? Or the start?
These are incredibly basic questions.
I’ve been in the position where I can only answer a handful of these.
It’s a scary place to be - thousands of jobs being executed an hour without any clue what’s really happening.
The vast majority of these cannot be answered by the Sidekiq Web UI.
So we need something more powerful.
I Wrote The Stupidest TODO App In The World…
I’ve created an app to demonstrate these ideas.
It couldn’t be simpler.
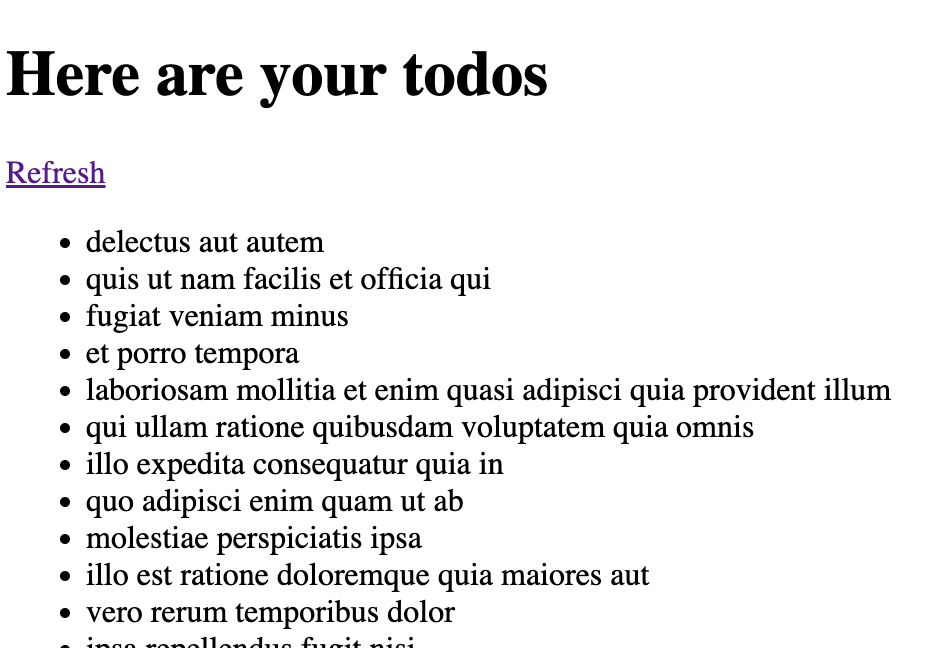
Here is a screenshot:
It downloads TODOs via an API.
It stores them in the database.
It has a super ugly UI.
When you hit “Refresh” it triggers a Sidekiq job.
The job clears out the database and repopulates it.
View the code: https://github.com/JoyfulProgramming/rails_observability_playbook
And yet…
…I Introduced A Bug
I wrote unit tests. I designed my code. I tested it locally.
And the code still had a glaring bug!
Typical.
So how can flame graphs help us debug this?
Introducing Flame Graphs
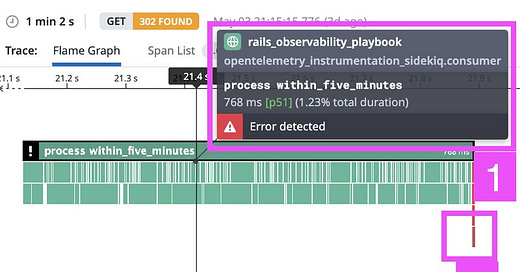
Here is a small section of a flame graph in Datadog:
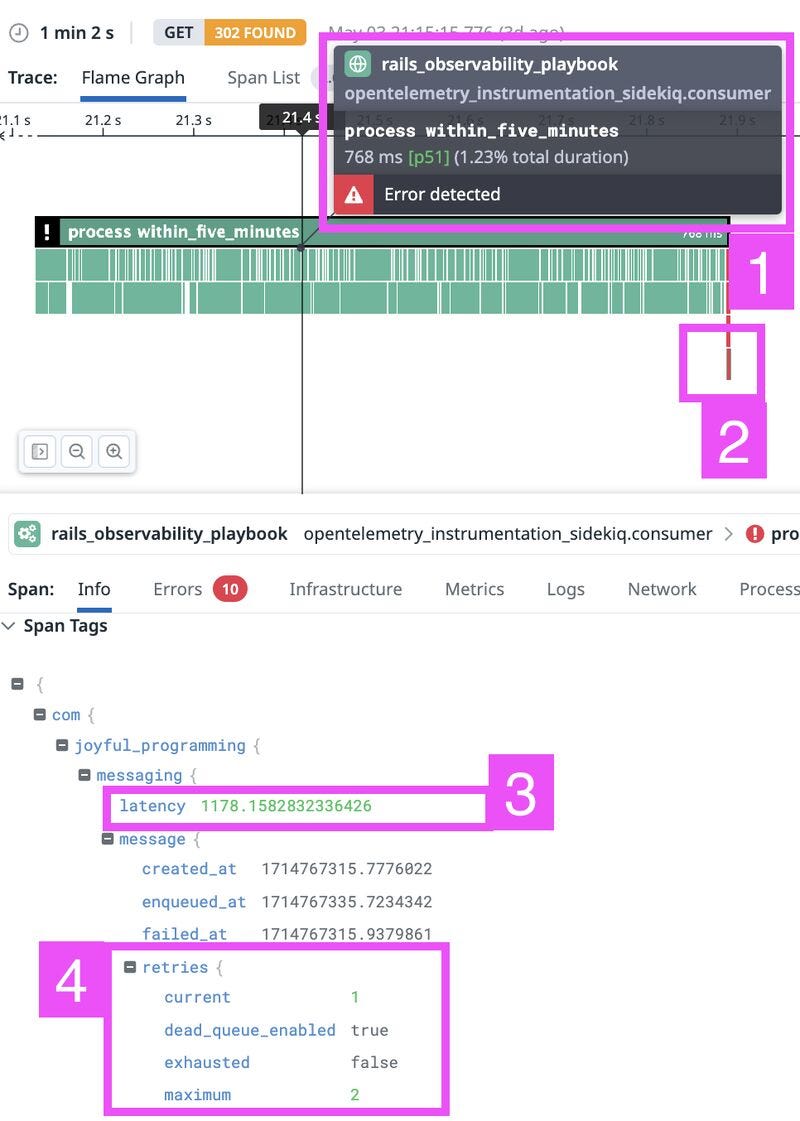
Let’s examine what we get:
1. Overview
Error happened on the
within_five_minutesqueueThis attempt took 768ms
In the 51st percentile of retries
The attempt took 1.23% of the overall trace
Full duration of the trace is at the top left - 1m 2s
Happened in a web request (the little green globe beside rails_observability_playbook)
Attempt was in a consumer process
All from that teeny tiny rectangle. Phew.
2. Error
That teeny tiny red sliver? That's where the error happened.
It happened after many database requests (the slivers of green blocks).
That means we know it’s a database error.
Turns out, the primary key we’re inserting on has already been used.
After a little sleuthing, I realised that jobs are overlapping and causing conflicts in the database.
3. Latency
This one piece of information has saved me countless hours.
Latency is the time from job being enqueued to starting.
Measured in ms, it’s 1.1 seconds in this example.
Seeing the latency in a single job? Yeah, fine.
But aggregate them over a week?
You'll get a real time view of how long jobs take in your queue.
This answers questions like:
Which queues are overloaded?
Which queues are performing well?
Can you alert me on overloaded queues?
All easy peasy.
Chef's kiss. Mwah. 🤌
4. Retries
I've never seen anyone instrument job retries in production.
This boggles my mind. Again? Basic information.
Aggregating this information gives you answers to questions like:
What are the average retries for a specific type of job?
What are the maximum number of retries?
How often are jobs sent to the dead queue?
Which jobs are not going to the dead queue?
And many more.
In my example, I could see that some jobs retried a couple of times then succeeded.
The Bottom Line
I’ve had to manage incidents with and without this information.
I’ve had to fix bugs with and without this information.
So I’m speaking from the trenches when I say this…
Instrumenting Sidekiq jobs makes debugging in production a dream.
Want help?
I’m on a mission to teach Rails engineers how to observe their Rails apps in production.
Even if you’re not using Rails, many of the principles can be adapted for your technology.
Check out the resources below.
Hit me up on LinkedIn with any questions you have.
Resources
Subscribe to Joyful Programming
Helping Engineers Understand Their Ruby on Rails Apps and Reduce Time To Resolution Of Incidents.

