


For those of us trying to detect election fraud, we need some quick tests we can use to see if anything seems fishy, and where we should look more carefully. At that point, we can work to get additional data and use various other tools, like AuditEngine, a ballot image auditing tool, to review the election in detail. But we don’t want to deploy those more critical tools everywhere since they do take time and effort to run.
I’m going to dig into various analysis methods that might make sense in future articles, but here, we can look primarily at how well do voters vote along party lines, comparing the presidential contest with other contests.
Bullet Ballot or Bullet Voting
The term “Bullet Ballot” is being used in this election to mean a ballot with only one vote, i.e. for Trump, and the notion is that this could explain the big difference between the votes for Trump, and the votes for the Republican candidate in the next contest down. As it turns out, this appears to mainly a myth once we took a hard look at the data, as there really are not a big chunk of ballots voted this way.
Traditionally, a bullet ballot was a single vote in a contest where you can vote more than once, such as in multi-winner bodies like a city council. The Wikipedia article on bullet voting (https://en.wikipedia.org/wiki/Bullet_voting) describes all the various strategies used when offered the chance to vote for more than one candidate in a contest. If you really like only one candidate, then it is a common technique to vote only for that candidate and no others, and leave one undervote.
In the early days of our democracy, the President and Vice President received their own votes, with the electoral college delegates having two votes to cast. The one with the most votes would be the president, and the other vice president. In the election in 1800, both candidates, Aaron Burr and Thomas Jefferson both received the same number of votes. This is called the “Burr Dilemma” and it remained a tie even after the tie-breaking process. After that, they changed to voting for President and Vice President with a single vote to avoid that situation.
Bullet voting is for one contest, by that definition. A full ballot is not subject to the same type of bullet voting, as each contest is distinct. But certainly, a voter could vote for just one candidate in one contest, and that would indeed be a type of bullet ballot, and is the type suggested in recent days for Nevada (but again, is not the case).
Straight-Ticket, or Party-Line voting
Straight-Ticket, or Party-Line voting (https://en.wikipedia.org/wiki/Straight-ticket_voting) is when a voter votes for all candidates of the same party with one vote at the top. This was very common until about 1960.
Usually there would be a selection at the top to vote for all the candidates affiliated with the selected party, usually only Democratic, Republican, or Libertarian. It was still being used in Michigan when I watched the recounts being done there after the 2016 election, and there are still a number of states that use it.
In Michigan, the voter can opt to override the Party Line on any contest by adding a vote in that contest for some other candidate. In some areas, they still use a Grid-Type Ballot (such as in New York and New Jersey) where the candidates for a given party would be in a single column, and each contest would be the rows. The voter could find their party of interest and vote for each box in the grid in a straight “Party Line” down the page. This somewhat implements straight party voting without actually having a separate option on the ballot.
Recently, this grid format has been challenged and I predict will eventually be dropped — especially for primaries — because it is hard to choose should be the endorsed candidate in the party, and therefore determine who will be in the first column.
The term Bullet Voting could be used for a straight ticket ballot, with that one option to choose a party at the top, but it is not a term I’ve yet seen in that context except in recent conversations.
Split ticket voting
Split Ticket voting is the opposite of Straight Ticket voting. But indeed, you could have various grades of splitting the ticket, depending on how many times you depart from the party line.
Even if not affiliated with a party, a given voter may vote for all R or D candidates, and then they are Solid R or Solid D voter. This would only be applicable in non-primary elections where there are various parties on the ballot.
Partisan Control Dimension
It is important to recognize a special Partisan Control dimension when faced with voting for a candidate in a larger body, such as for Senate, U.S. House, or state legislatures. These bodies are controlled by the party with the majority of members aligning with that party. Thus, the dominant consideration of many voters is not whether they “like” the particular candidate or if they support that candidate’s qualifications and positions, but whether they want their party to have control of that larger body. This partisan control dimension does not come into play in the same way when considering local candidates that may have a party affiliation included on the ballot, but where there is no strategy around controlling a larger body.
When contests have the partisan control dimension, it may be the overriding factor if control of the body is close to being won or lost, and less important if the body is already tipped heavily one way or the other. Currently, all federal contests have this dimension (as the US House and Senate are nearly 50/50). And of course the President has a similar but even more significant control dimension.
Roll off
“Roll off” is the term used for the tendency for voters to skip “down ballot” contests, sometimes only voting for the top few contests that they know about, and skipping the lesser-known contests such as for judges and local boards and councils. Sometimes, the term “Drop off” can be used for this as well.
Drop off
Now, let’s turn to “drop off” as was used in the letter we recently sent to the Department of Justice and Attorney General Merrick Garland. Again, we were looking for a measure that could be used to identify states and districts that “look fishy” so we could do more careful review of those districts.
In this measure, we know that the US Senate and US House contests definitely include the Partisan Control dimension, so anyone who is aligned with a party will likely recognize that a party-line vote is important and vote for the first contest after President in the same party, and for the endorsed candidate of that party. If they don’t then they are not a “Solid Party” voter. And, any ballot that it voted for President and in the second contest, if it is voted for the opposite party or any other candidate, then that is a split ticket and this is what I was calling drop off. I think a better term might be “Party-line drop off.” It does not mean that the voter stopped voting altogether, but they did not stay with the party at least with the first contest on the ballot. If there are several contests with the partisan control dimension, we can use those too, such as if both ht US Senate seat and US House seat are both on the ballot.
For this type of Party-line drop off to be significant, the second contest on the ballot must have the partisan control dimension, and also be contested. And if that second contest is not only contested, but is also a very close and “hot” contest, it is even more true that partisan voters will likely cast a vote in that contest along their party affiliation or tendency of support.
This is a simpler approach than that used by Larry Moore in his analysis discussed in this news article: https://thefulcrum.us/bridging-common-ground/arizona-election, where 16 down-ballot contests were evaluated to determine if a voter should be regarded as solid-R or solid-D, if they voted in half or more of the partisan contests along party lines. The article says:
There was “a slight increase in the Disaffection index for GOP voters, from 6.2% [in 2020] to 7.1% [in 2022],” the report said. “Over the same time, the percentage of disaffected Arizona Republicans who cast ballots for Democrats (i.e., Disgust index) grew from 65% to 86%.”
In his definition, he calls a “disaffected voter” someone who was a solid party voter and did not vote for the candidate of the same party at the top of the ticket. Thus, out of 1000 votes, there would be 62 such solid-R voters that would not vote for Trump. Then, out of those 62, some would vote for Biden, the D-party candidate, and the rest would vote for someone else or leave the contest blank.
So at 65%, of the 62 = 40 would vote for Biden while 22 would skip the Presidential contest or vote for some other candidate. It is important to understand that the disgusted index is a percent of the fraction of the disaffected voters. Another somewhat clearer way to present this would say that of solid R voters, 4% voted for Biden and 2.2% voted for someone else or left it blank. Saying that the percentage of disgusted voters was 65% makes it seem it is a bigger fraction but it is really only 4% of the total.
We also have some results from Shiro Kuriwaki et al, where he and his group used a database of ballots from the 2020 election1:
Our release includes vote records for President, Governor, U.S. Senate and House, and state upper and lower chambers – covering 42.7 million voters in 20 states who voted for more than 2,204 candidates.
Kuriwaki’s group focused in on the same question, but slightly differently:
As our main exercise, we ask whether partisans — defined by their votes for Congress and state legislature — vote for their party’s presidential candidate. Donald Trump was a polarizing candidate. Election observers have wondered if Trump drew less support from Republican-leaning voters compared to the support his opponent, Joe Biden, drew from Democratic-leaning voters. Some referred to these group of voters as “Never Trump Republicans.
The dataset used in this analysis only included the federal contests and state legislature contests. They classified voters as “Down-ballot Democrat” or “Down-ballot Republican” based on whether they consistently voted for that party in all non-presidential contests included in the dataset. We can notice that compared with Moore’s analysis, which classified voters as R and D voters based on a larger number of contests, but also many contests that are only lightly partisan, in that they do not have the strategic control dimension. Thus, I think we can argue that the criteria used in Kuriwaki’s analysis as a bit more critical because the voter must have voted R or D in all of the down-ballot contests.
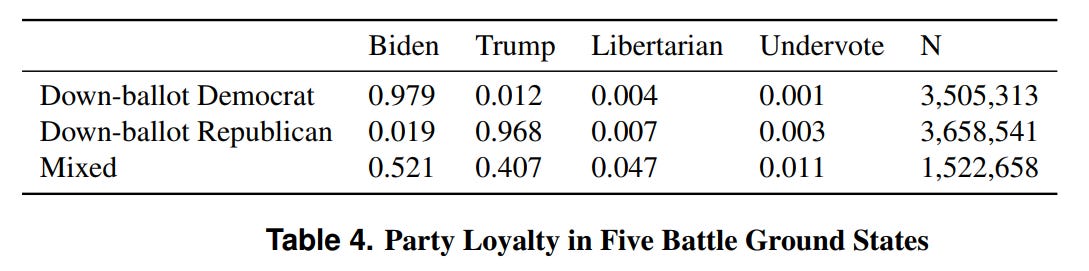
The table above is the result of the analysis by Kuriwaki’s group. Thus, of solid Democratic voters, 97.9% voted for Biden, whereas of solid Republican voters, 96.8% voted for Trump, and 1.2% of D voters and 1.9% of R voters voted for the opposing candidate.
Thus, we can see that this differs from Moore’s result, where he found 4% of R-voters voting for Biden instead of only 1.9%. This might be attributed to a more lenient assignment of solid-R voter in the case of Moore’s analysis.
Nevada, 2024
Now, let’s turn to Nevada in the 2024 election. These results are still coming in. And in this case, we do not have the luxury of having the CVR data, at least not yet. But, we want to be able to use this measure to detect issues very early in the election, and so we need to have a technique that can use aggregated values. In our letter to the DOJ, we included this chart, which speaks to the issue in a very simple and direct way.
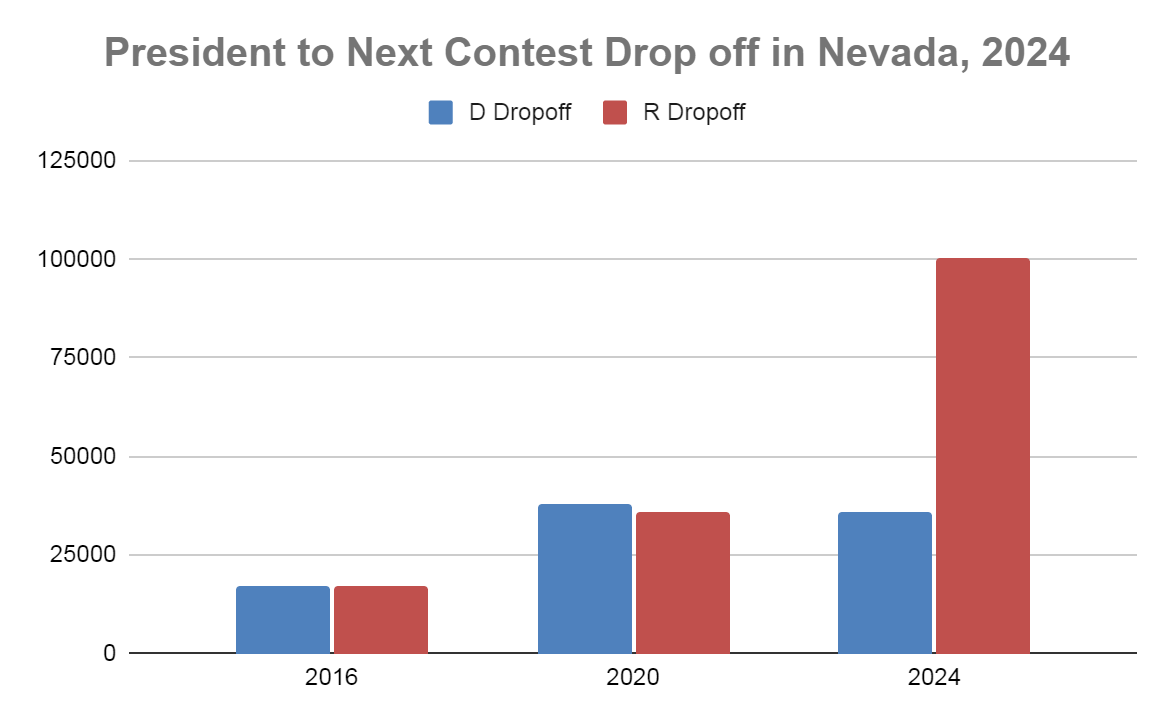
This chart presents the party-line drop off between the presidential contest and the next contest down based on aggregated data (not individual ballots). For comparison to the presidential contest in 2016 and 2024, there was a Senate contest, so we can easily use those in those years. But in 2020, there was no Senate contest. In that case, we used the four congressional seats in combination.
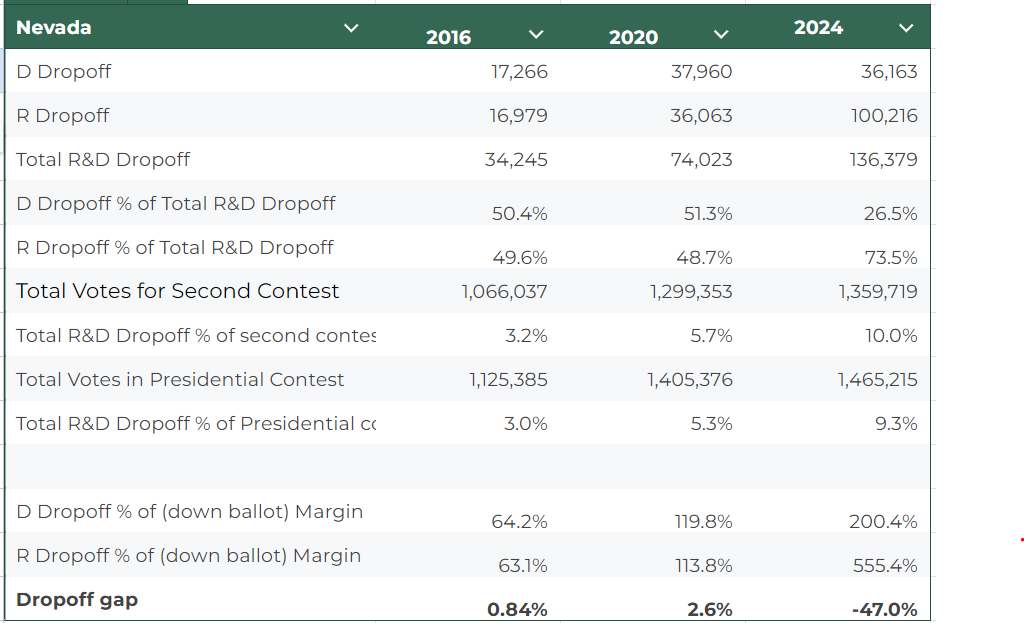
It’s interesting to note that in 2016 and 2020, the partisan drop off was about evenly split between the parties. That is, almost the same number of voters did did not vote along party lines for the second contest. That is a very big contrast with 2024, where the D-party drop off was about the same as it was in 2020, but the R-Party drop off was much larger.
“None of these” option, Other Candidates, Blanks
Interestingly, for the presidential contest and the senate contests, there was also an additional option “None of these” which you can select if you want to not vote at all in the contest, but not leave it blank, which eliminates the idea that someone can fill in your blank ballot however they choose, if they come across your ballot and happen to have a pen handy. There are also other candidates on the ballot, a write-in line, and it might even be left blank.
Certainly, if a voter votes for “None of these” it is not “roll off” and it does not qualify as a “bullet ballot” if say Trump were voted in the top contest and the Senate contest, the voters voted for “None of these.” But it does qualify as “partisan drop off” because the voter decided to not vote for the important Senate seat. Also, the US House seats do not have “None of these” but they do have write-ins and other options, which are similar. Therefore, we treat all cases of not voting for the Senate party line the same, as a partisan drop off.
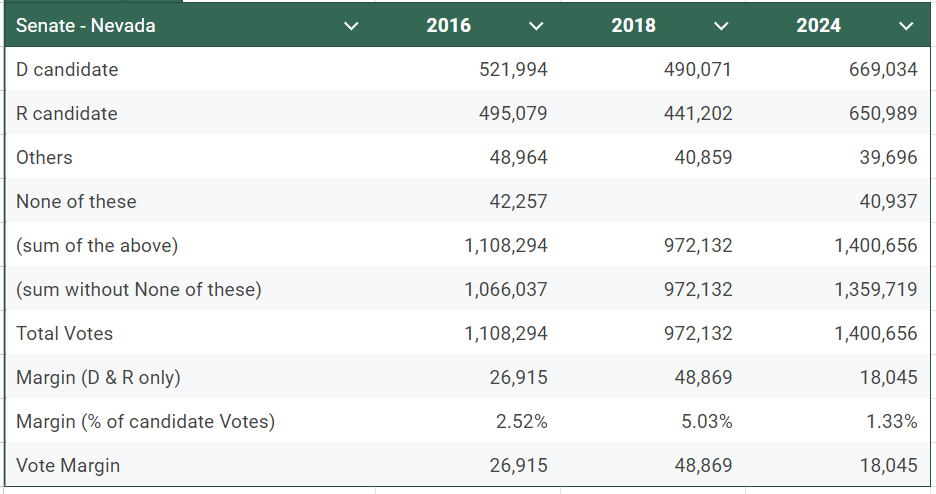
Let’s take a look at the Senate contest shown above. Here, we included also the contest in 2018, which has much lower turnout (given that it is a non-presidential election year) but still is helpful for comparison. In all years, the D-party candidate won this contest and it was always contested, and it was close. It was even closer in 2024 than ever, meaning that the strategic partisan effect would be very strong, especially since it was critical for the GOP to gain control of the Senate.
What we do not see is any drastic change in the character of this contest. It is a little bit closer than it was in the past, but it still appears to be a hotly contested contest, and therefore any solid-R voter would likely vote for the R-party candidate. This is why we think this is a good comparison contest.
President
Let’s look at the presidential contest. Please note the 2024 figures are preliminary.
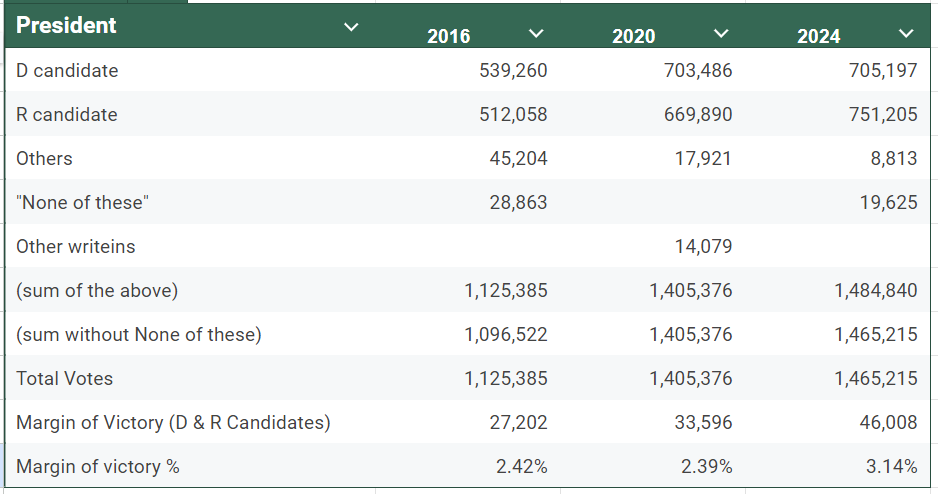
In both 2016 and 2020, the D-party candidate won this contest, both times against Trump. In 2024, the state flipped and selected Trump. The D-party candidate did not pick up many additional votes, whereas Trump gained an almost unbelievable 81,315 votes. We can see that fewer voters were voting for “None of these” (down 9,238 votes, comparing with 2016), other write-ins were down 14,079, and Others were down 9,108 (from 2020) and down 36,391. Assuming the extreme case, that all those other categories voted for Trump, that is 59,708. We are still about 21,000 votes off from the total Trump vote.
Now, is it plausible that the GOP was able to mount a very good ground game to round up the 80K votes they successfully moved to their side of the ledger? Yes, I think so, but still is showing that at least this points out that Nevada deserves more scrutiny, including recounts if possible.
Please support our letter to the DOJ to perform further review in this election!
Next Post: Inconclusive Evidence of Malfeasance in NV 2024 Election
Previous Post: Letter to DOJ: Investigate the 2024 Election!
All Posts: https://substack.com/@raylutz/posts
Kuriwaki, S., Reece, M. et al. Cast vote records: A database of ballots from the 2020 U.S. Election, Harvard Dataverse, 10.7910/DVN/PQQ3KV (2024) — https://dataverse.harvard.edu/dataset.xhtml?persistentId=doi:10.7910/DVN/PQQ3KV

