10 Charts That Capture How the World Is Changing
From Employee Productivity to Gen Z Homeownership, AI Web Scraping to Spotify Payouts

Weekly writing about how technology and people intersect. By day, I’m building Daybreak to partner with early-stage founders. By night, I’m writing Digital Native about market trends and startup opportunities.
If you haven’t subscribed, join 65,000+ weekly readers by subscribing here:
10 Charts That Capture How the World Is Changing
It’s been three months since our last “10 Charts” series. That edition—Part I here and Part II here—covered everything from prediction markets to space launches to Shopify metrics.
I like the “10 Charts” series because I’m a visual learner and charts help me process information. Charts also happen to be an efficient way to show how the world’s changing, across a wide range of subjects.
I promised to do this series every quarter or so, so we’re due for a fresh set. Lately we’ve been splitting the 10 charts into a Part I and a Part II, but this week let’s be reallyyy wild and hit all 10 in one go.
Revenue / Employee
Online vs. Offline Commerce
Market Update: Profitability vs. Growth
Secondaries and VC Distributions
New York’s Tech Hiring Spree
AI Web Traffic + Clickthrough
The Power Law of Spotify and YouTube
Guinness’s Viral Boost
DoorDash Dominance
Gen Z Homeownership Rates
Let’s dive in.
1️⃣ Revenue / Employee
I found this chart very interesting: check out how much revenue AI companies are doing per employee. Midjourney rakes in $4.1M per employee, Anysphere (the company behind Cursor) brings in $3.3M, and even OpenAI—with 2,500 employees—is averaging $1.5M per worker.
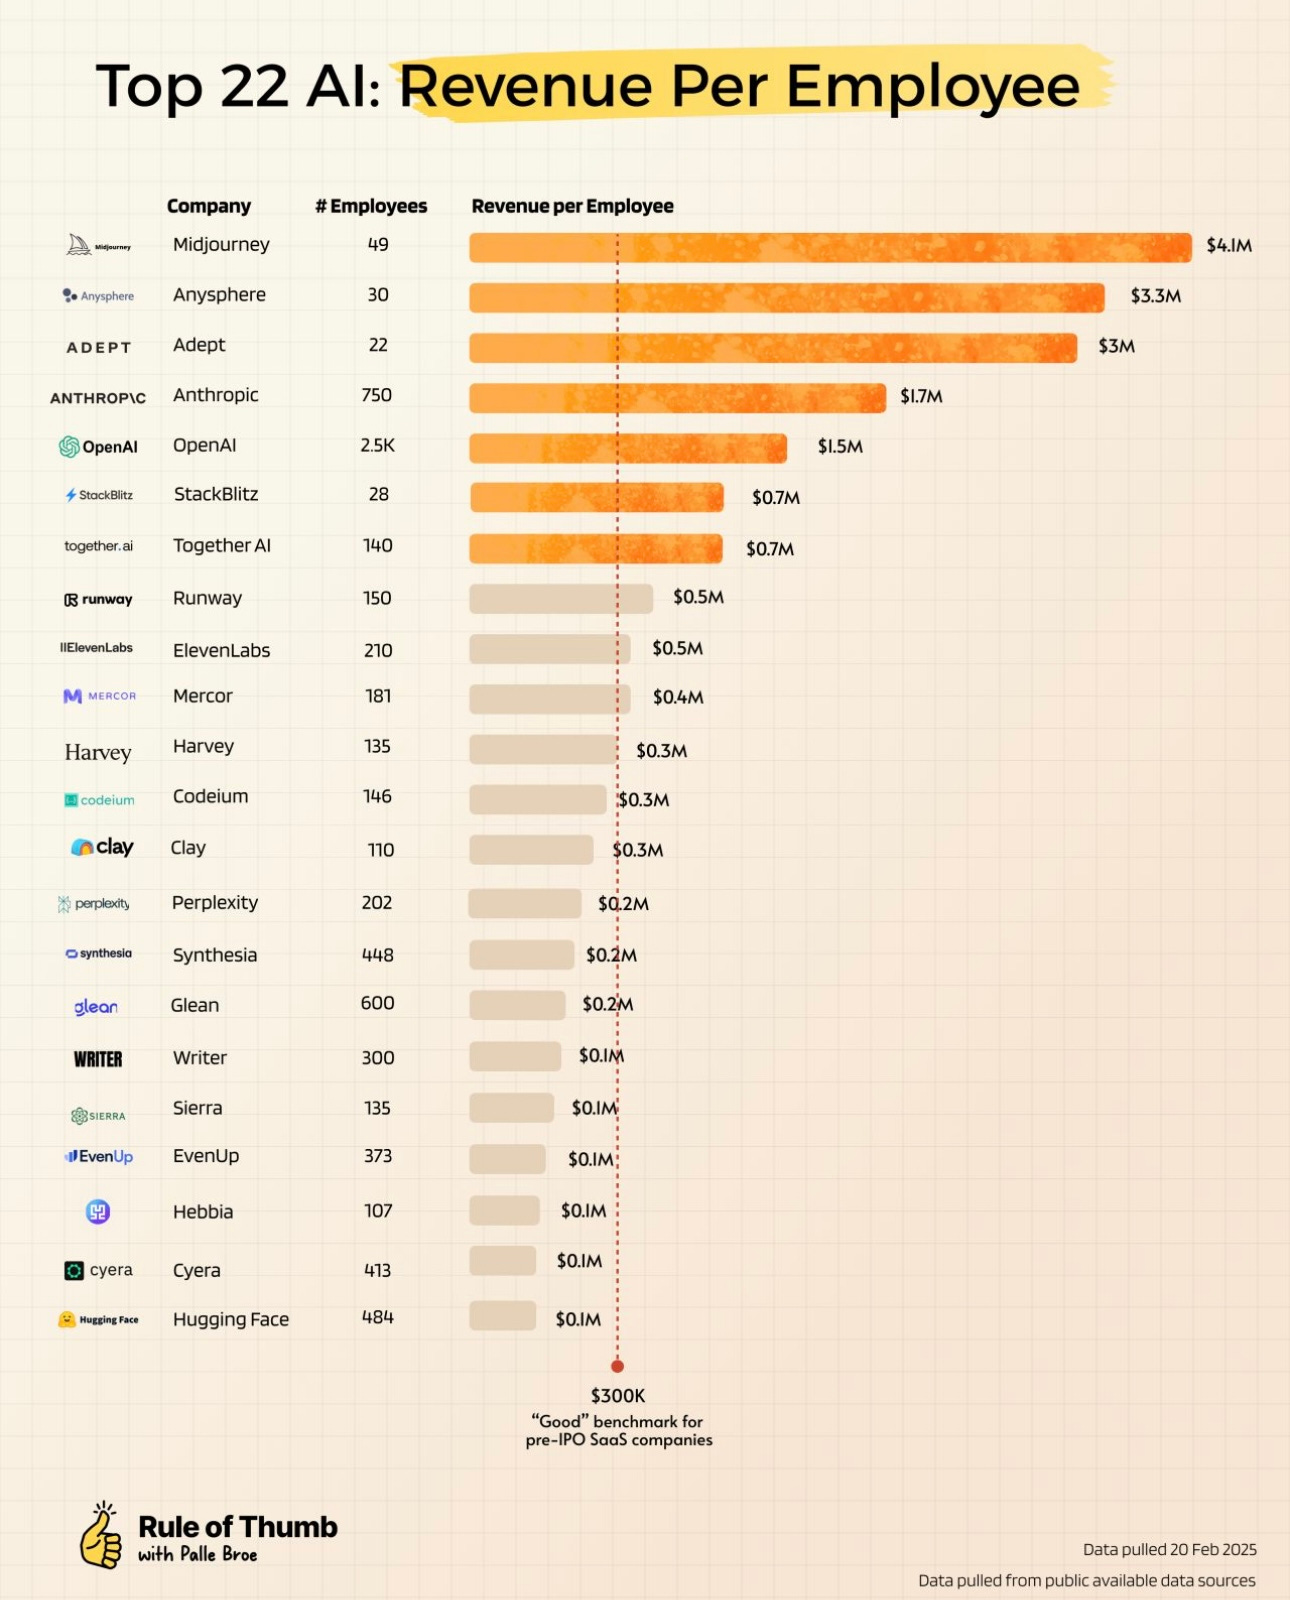
Yesterday Google announced its intent to buy Wiz for $32B. By my math, Wiz has ~1,200 employees and around $1B in top-line, good for ~$83K per worker. Not exactly on par with the top names above, but pretty solid.
These stats embody the moment. With AI tools that turbocharge worker productivity, it’s now possible to get to $5M, $10M, $100M ARR with only a handful of employees. People have been predicting the first 1-person $1B business for years now, and while that’s probably a stretch, we might not be far off.
How does this trickle into venture capital? We’ll see more companies raise a Pre-Seed or Seed round—maybe even just a friends & family round—and then grow rapidly yet profitably, never again taking outside capital. Call this the ‘Lean Startup 2.0’ era.
2️⃣ Online vs. Offline Commerce
A lot of us miss the serendipity of offline shopping. It’s fun to wander through a cute shop and discover new things. Yet clouded in our nostalgia, we forget that most offline shopping is…kind of awful?
Here’s a chart that shows the percentage of online assortment that’s found in store:
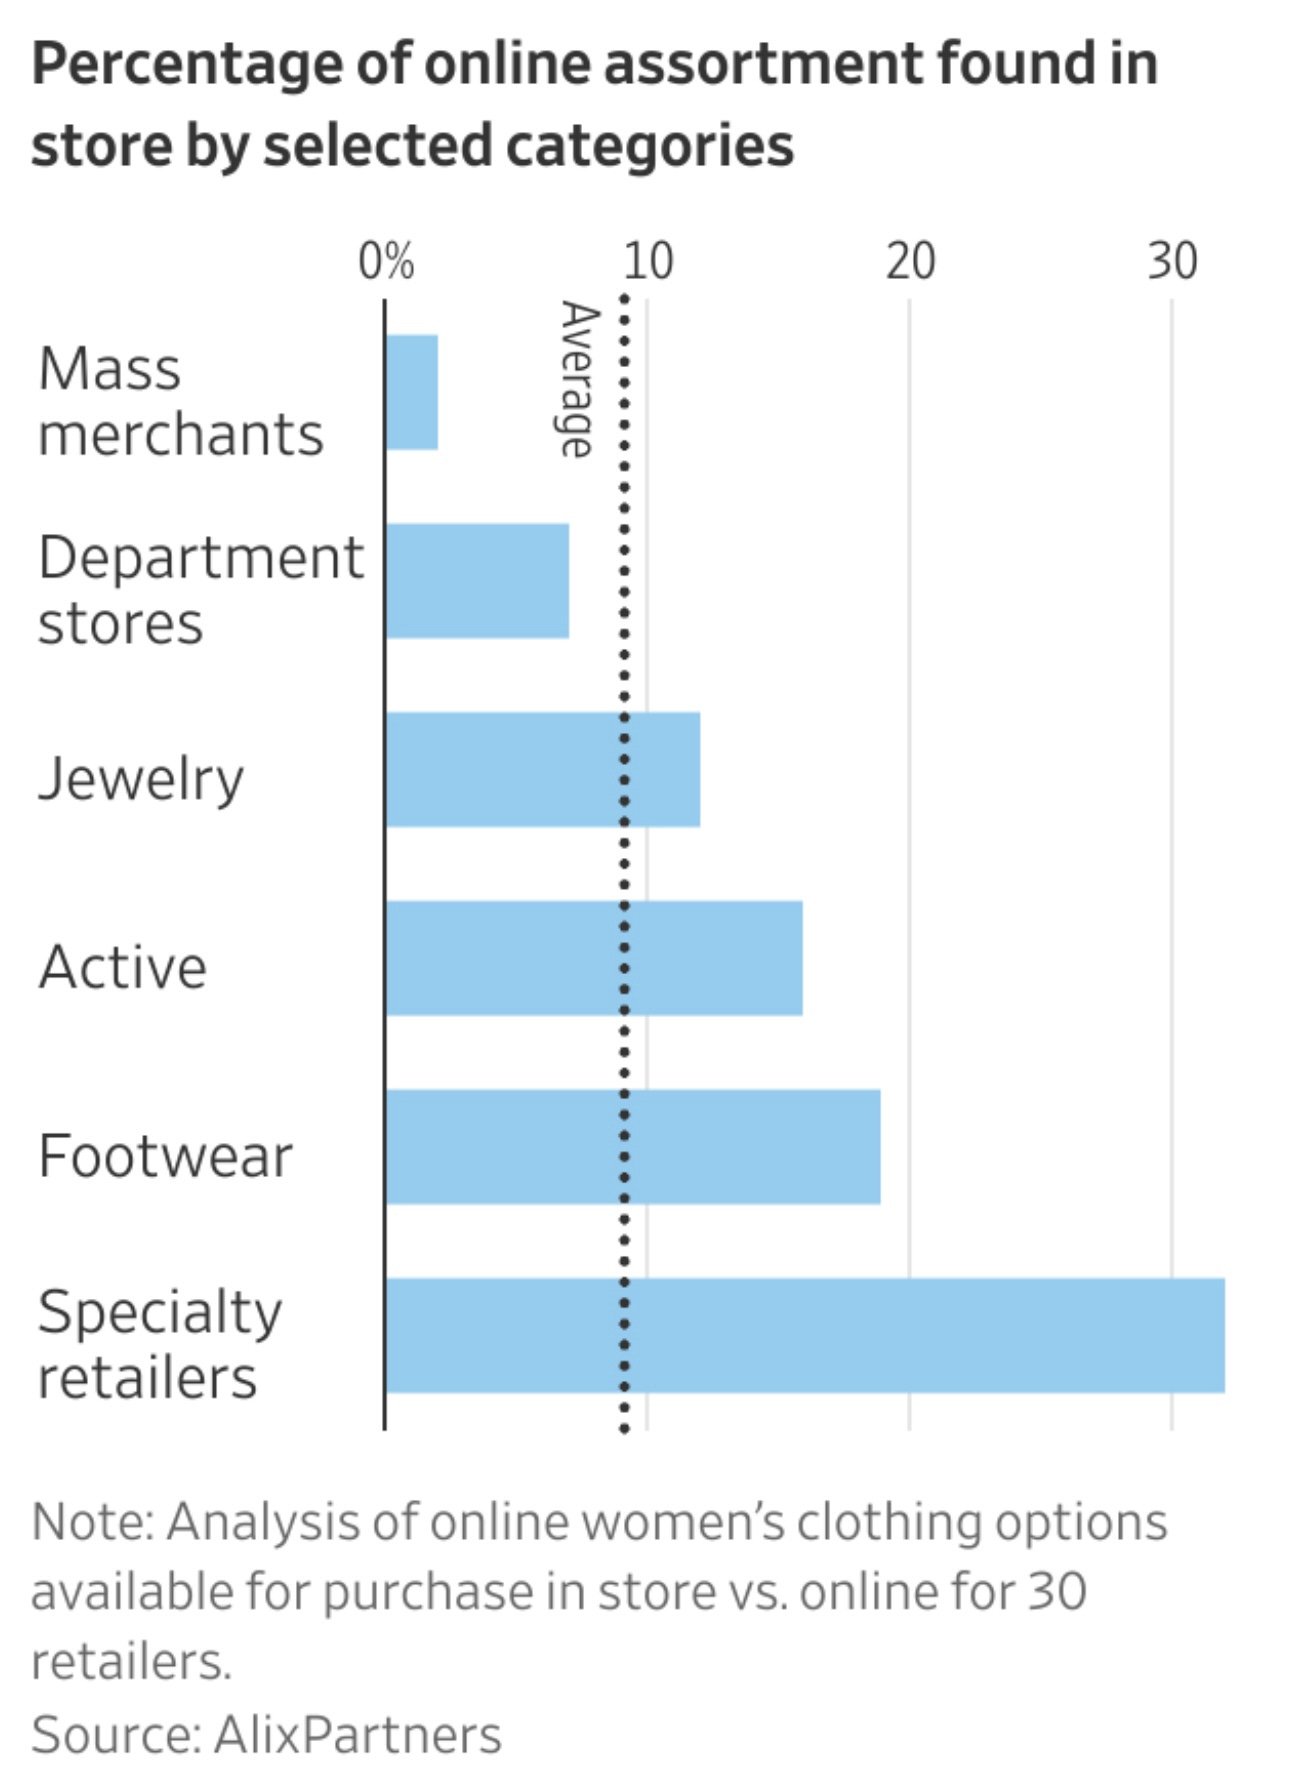
Yikes. Not great. If you’re shopping at Nordstrom, you’ll see <10% of the catalog you’d find on Nordstrom.com.
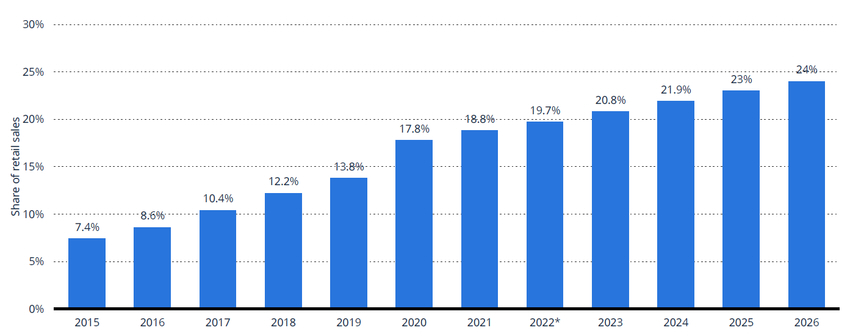
E-commerce feels saturated, yet we’re still only around ~20% of retail penetration:
Brick-and-mortar, meanwhile, is in a rough spot. This week Forever 21 filed for Chapter 11 bankruptcy. The retailer’s website and US stores will remain open for now, with plans to host liquidation sales down the road. A Millennial stalwart will be no more.
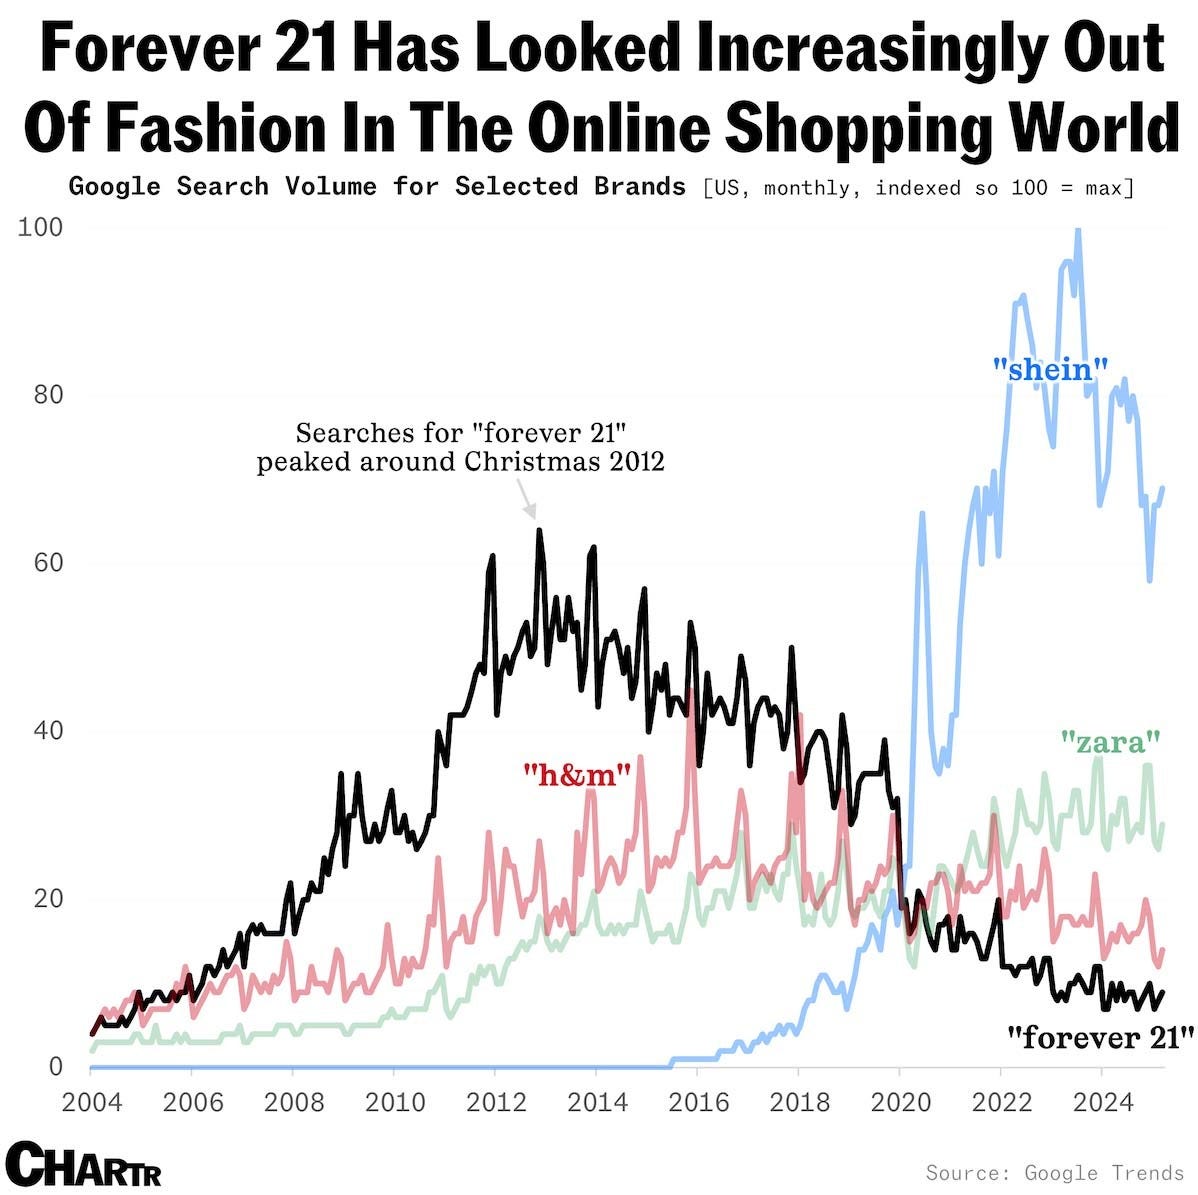
This comes at a time when shoppers are turning to digitally-native sites (e.g., SHEIN) or to retailers who have navigated an omnichannel world especially well (e.g., Zara).
Commerce can feel stale, but there’s still a lot of room for innovation, particularly with AI driving personalization and search. The vast online catalogs alluded to above—the catalogs far larger than store merchandise—will provide rich datasets that power AI-native shopping experiences.
3️⃣ Market Update: Profitability vs. Growth
Redpoint came out with a good “State of the Union” for the market last week. Here are some of my favorite charts and their takeaways.
In our 24 Predictions for 2024, we wrote:
2024 will bring a renewed focus on unit economics (remember those?) and a continued market focus on profitability. Achieving profitability can have dramatic effects: Udemy, a company with $700M+ in revenue, saw its stock jump +38% in one day after reporting profitable earnings. Netflix was the worst-performing stock in the S&P 500 last year, shedding 75% of its market cap, but it’s up +50% this year after turning in a few highly-profitable quarters. Many SaaS companies have stopped investing heavily in growth and are instead inching their way to cash flow generation.
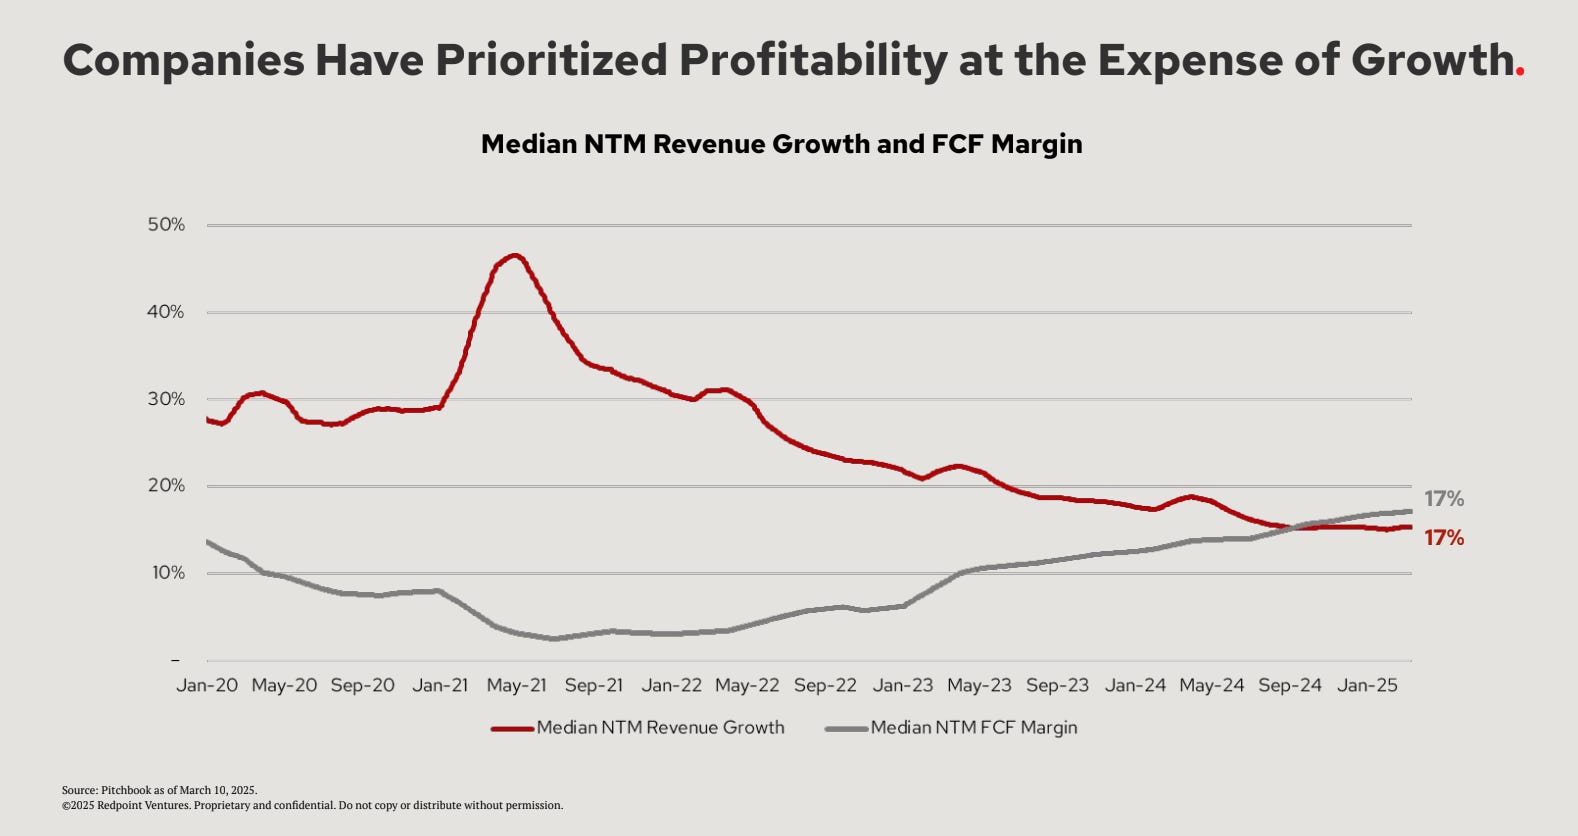
We can now see the prioritization of profitability over growth in earnings releases. This chart shows how companies have improved free cash flow margins while slowing revenue growth. Back in 2021, meanwhile, top-line growth was on a tear while FCF margins shrank. It’s cool again to be profitable.
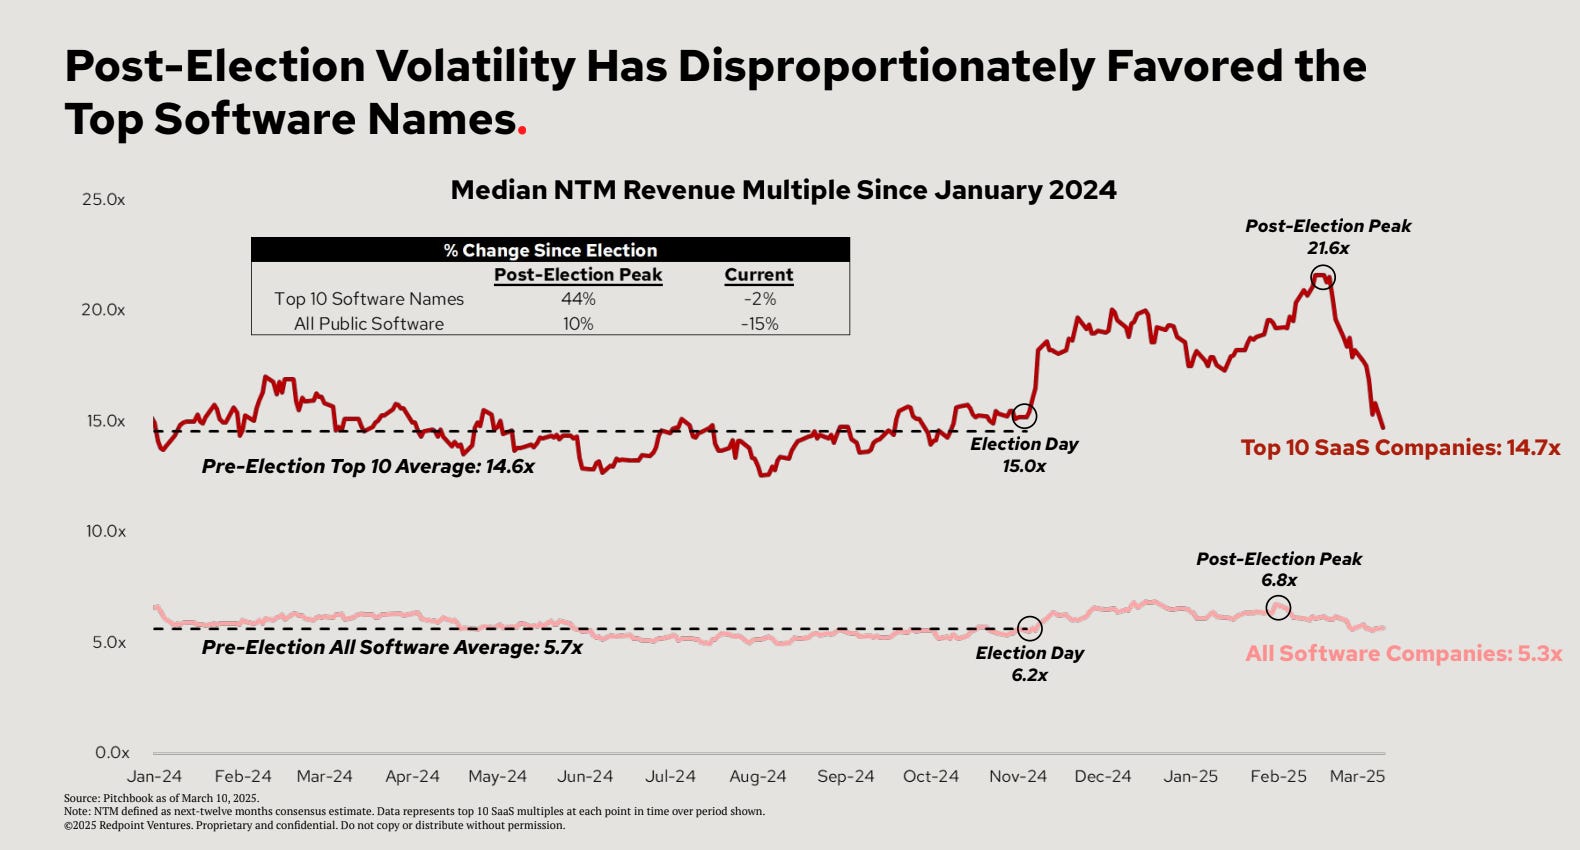
We also see a splitting in software: best-in-class software companies trade at much higher multiples—14.7x for top 10 names vs. a 5.3x average. The market is giving a premium to “great” companies vs. “good” ones.
I also liked this graphic, which show how much faster it’s becoming to grow into a $50B company. SAP took 29 years and Microsoft took 20. OpenAI, meanwhile, took nine while Anthropic took four. Wiz, mentioned earlier, is just five years old yet is getting snapped up for $32B.
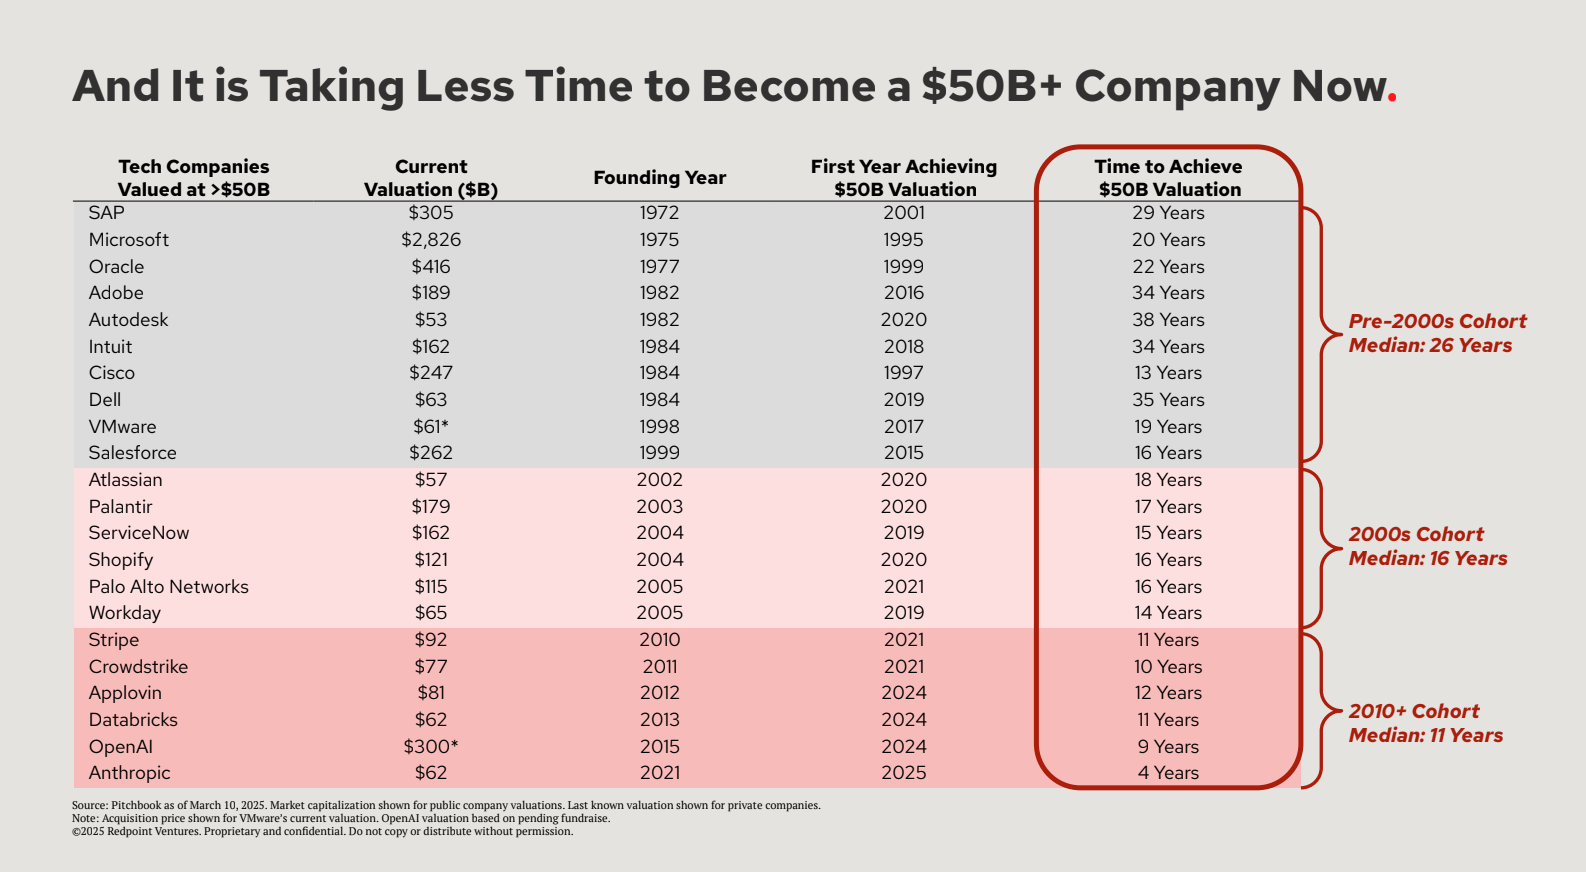
This goes hand-in-hand with the earlier chart on revenue per employee. It’s becoming possible to achieve (1) a lot more, (2) with a lot less, (3) a lot faster.
Bonus: DeepSeek
One bonus chart as we’re talking about the markets. Check out how DeepSeek boosted Chinese tech stocks:
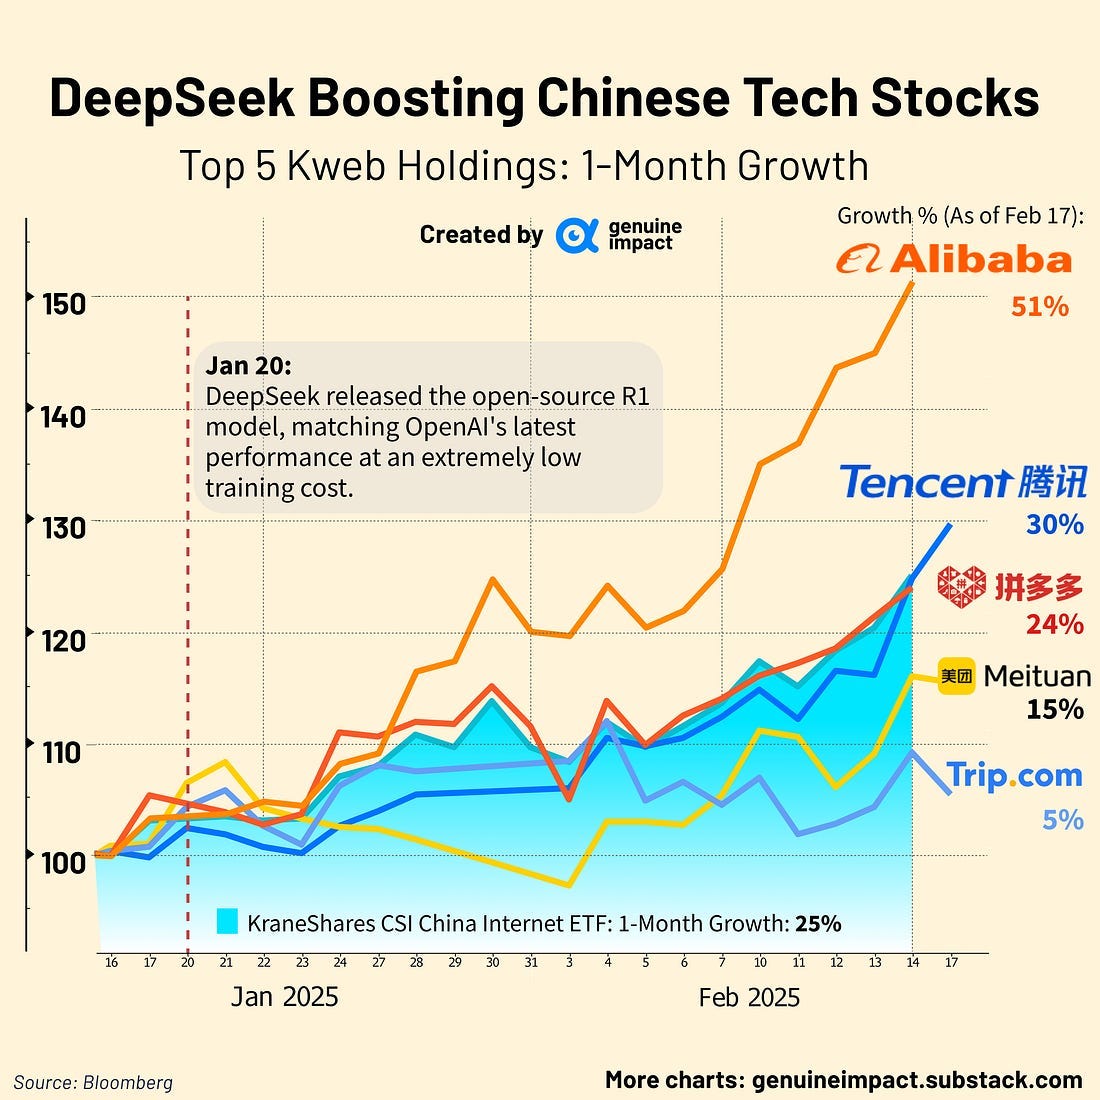
We’re seeing the US vs. China battle heat up, and not just in AI. BYD, China’s electric vehicle maker and Tesla’s chief rival, yesterday announced that its new charging technology can “fill up” cars in five minutes. This makes an EV charge comparable to visiting a gas station, rather than a tremendous nuisance (charging a Tesla typically takes a few hours or even overnight). This is another bellwether of US vs. China competition—the 2020s are bringing the 21st century equivalent of the Soviet-US ‘Space Race’ of the 50s and 60s.
4️⃣ Secondaries and VC Distributions
While we’re talking about the market, I also liked PitchBook’s recent presentation on Q1 2025. Some highlights here:
This chart shows the top 15 companies driving secondary market volumes. These are big numbers—it’s becoming a lot more common for employees and early investors to get liquidity through secondaries vs. through a traditional exit.
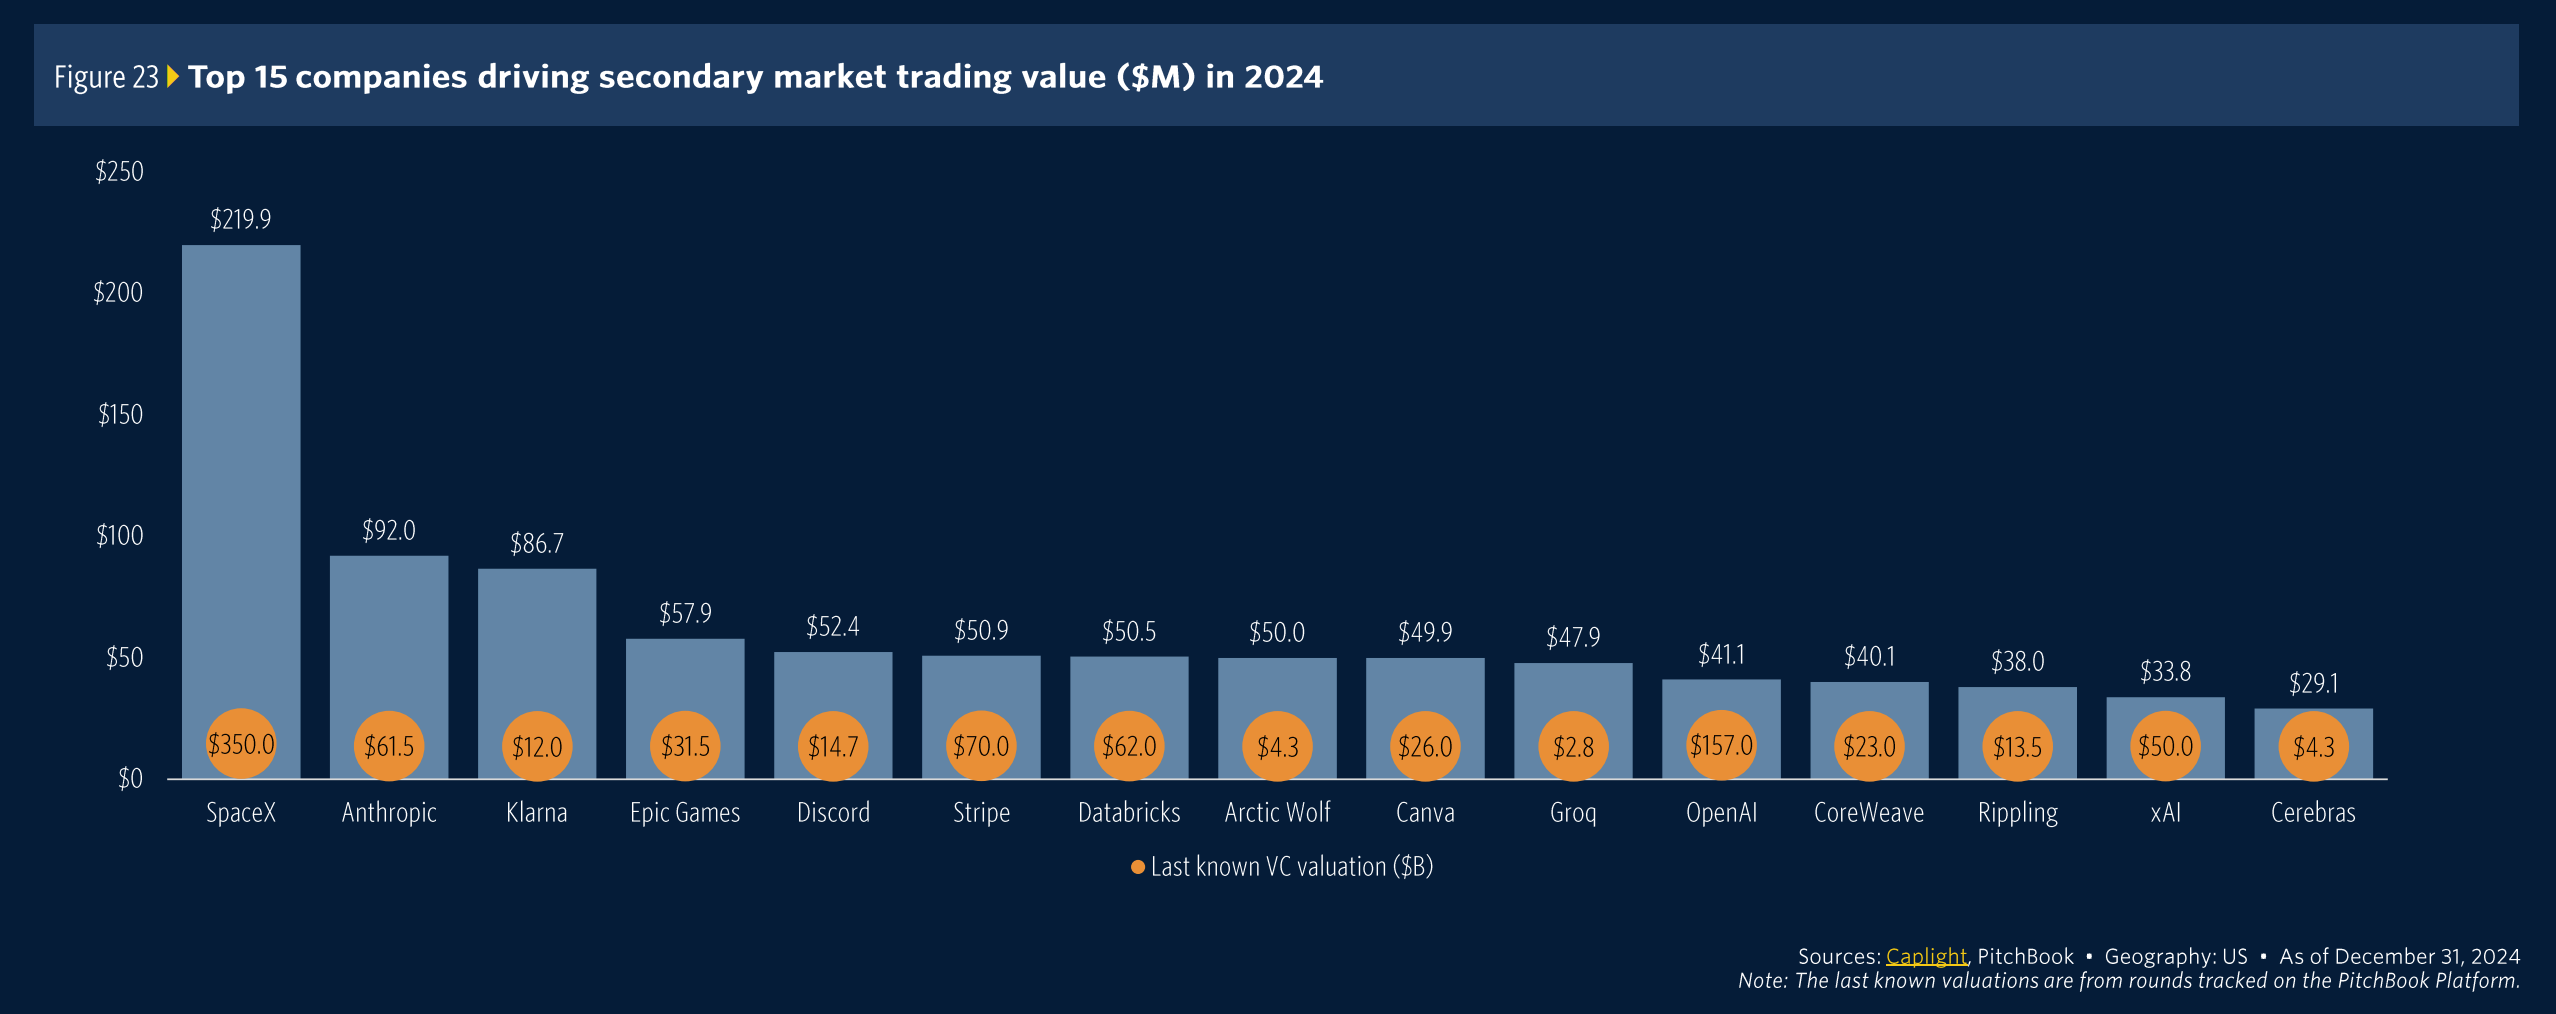
This continues a trend we wrote about last year. A prior chart we shared:
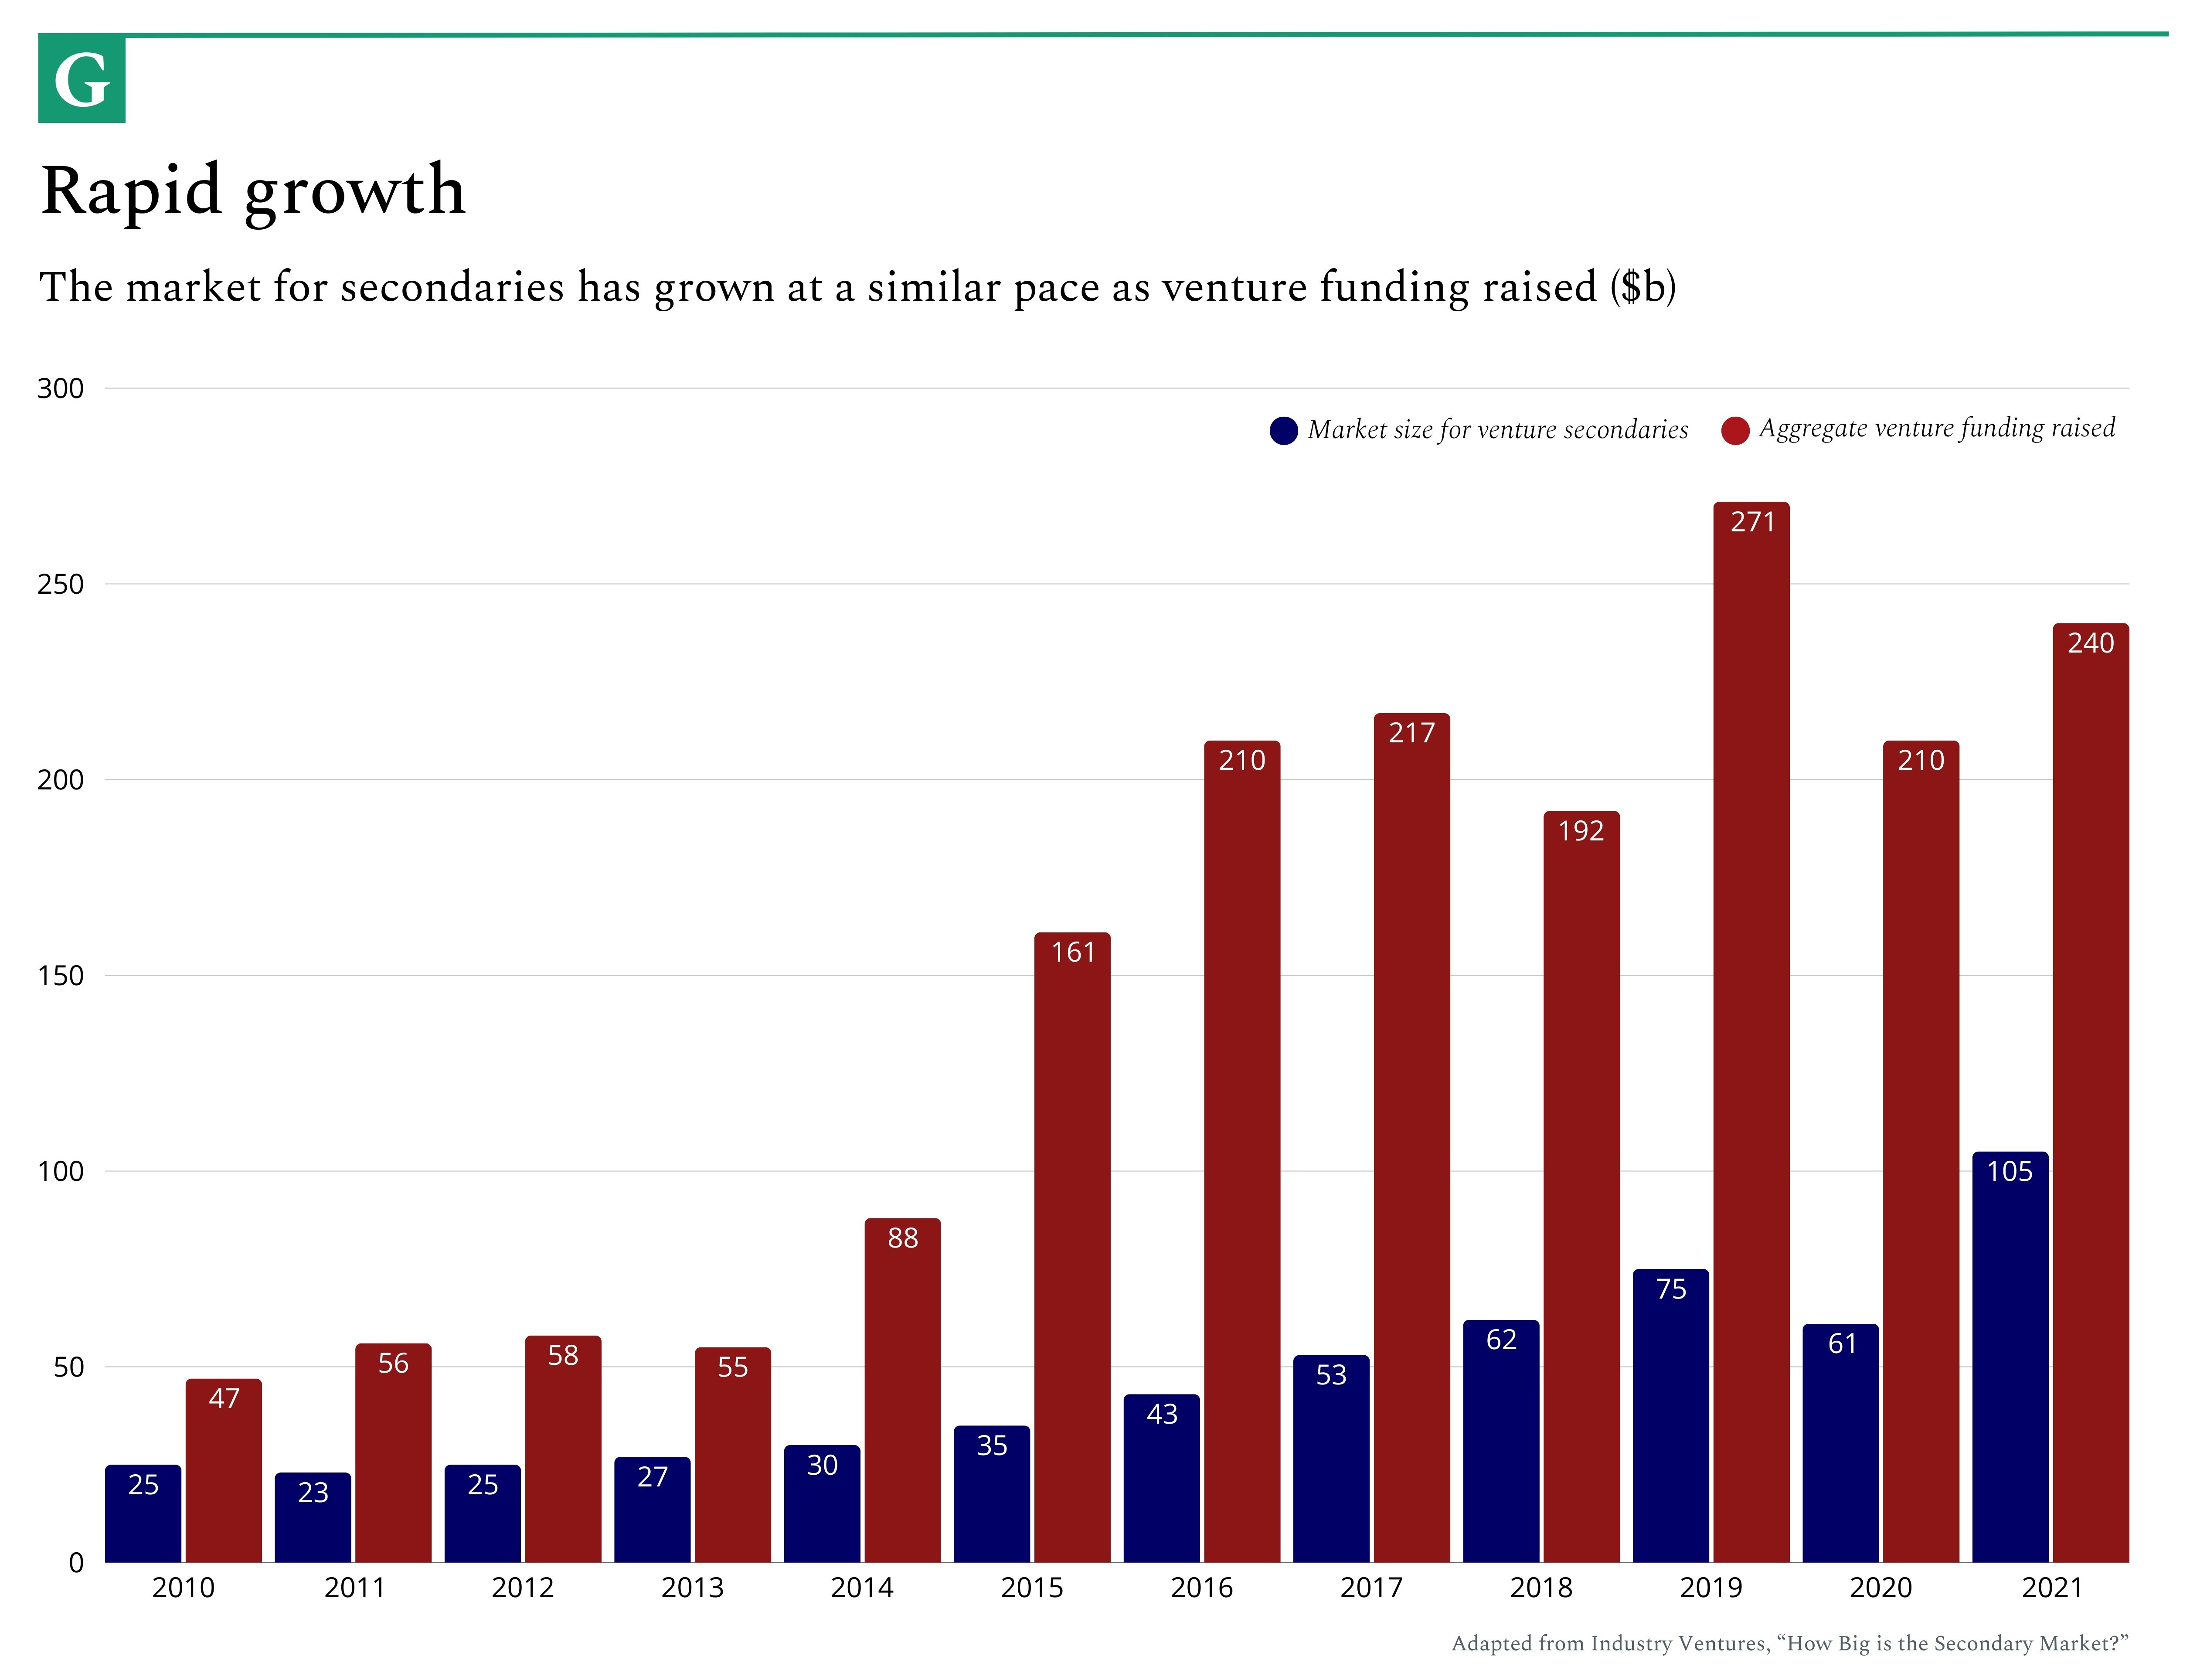
I have a few friends raising secondary-focused funds, and I think this is a trend we’ll see more of.
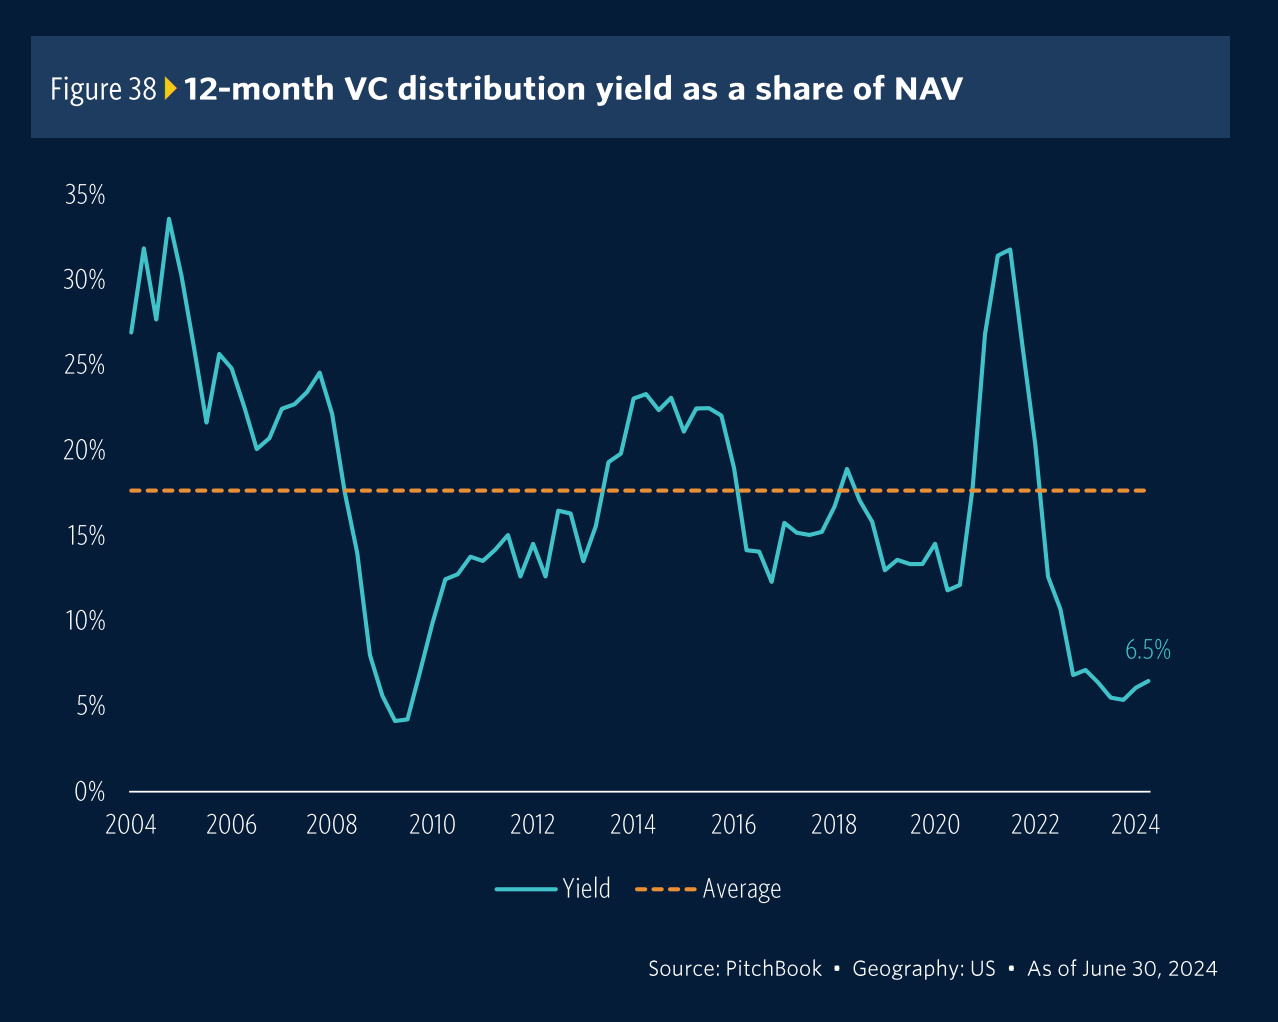
One more chart from PitchBook that goes hand-in-hand here: the below chart shows VC distribution yield as a share of net asset value. We’re at ~6% compared to ~30% a few years back. This both reinforces the point we made last week when announcing Daybreak Fund I—that it’s a tough time to raise a fund because LPs aren’t getting distributions back—while also providing color for the secondaries chart above.
5️⃣ New York’s Tech Hiring Spree
As a New Yorker, I was happy to see this chart showing tech talent gains / losses across major US metro areas:

The New York data checks out with what I’ve seen and felt. The San Francisco net loss is more surprising, as the Bay feels “back” after a post-COVID slump.
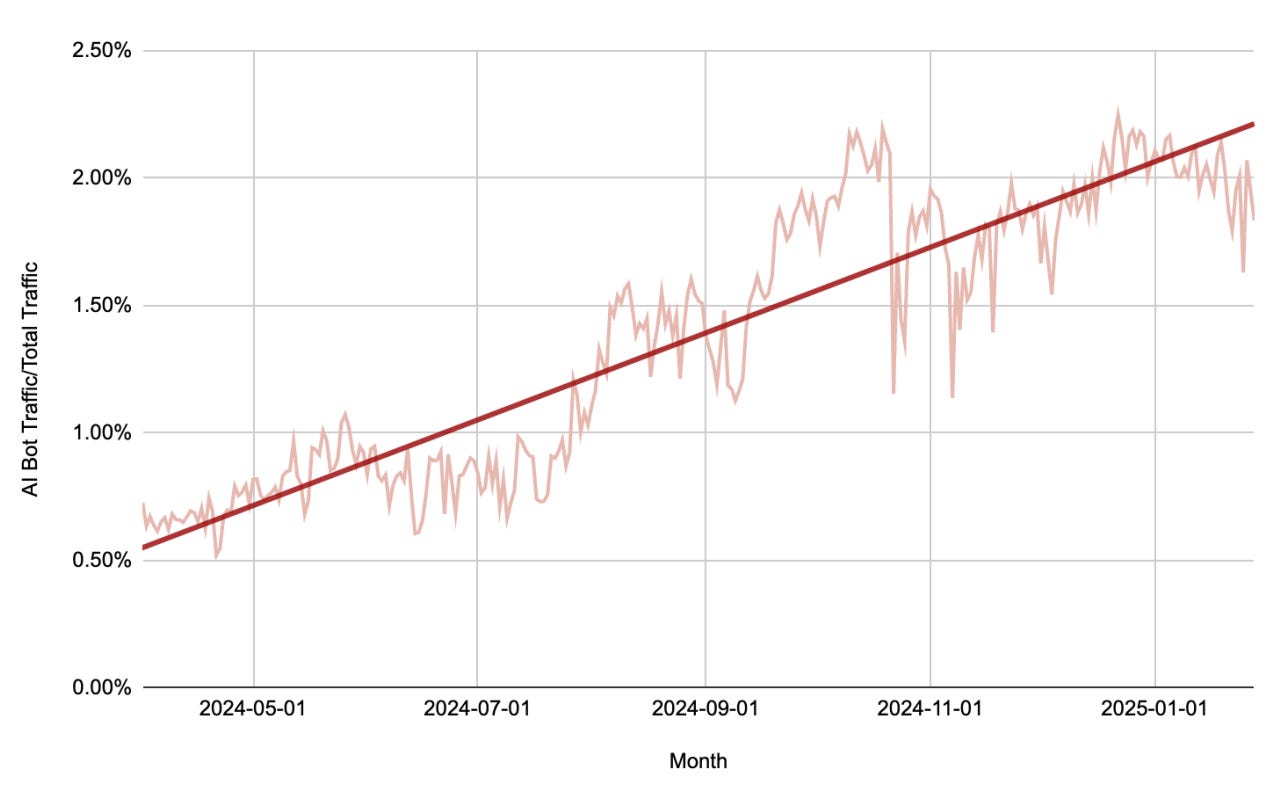
6️⃣ AI Web Traffic + Clickthrough
TollBit put out some interesting data on how AI bots scrape web content. Scrapes have been growing 100% quarter-over-quarter for the past year, while scrapes per page have been growing 200%.
Something else that’s interesting but not surprising: people engage a lot less with AI chatbots than with Google Search. Top 10 Google results average ~9% clickthrough, while an AI chatbot is 96% (!) less.
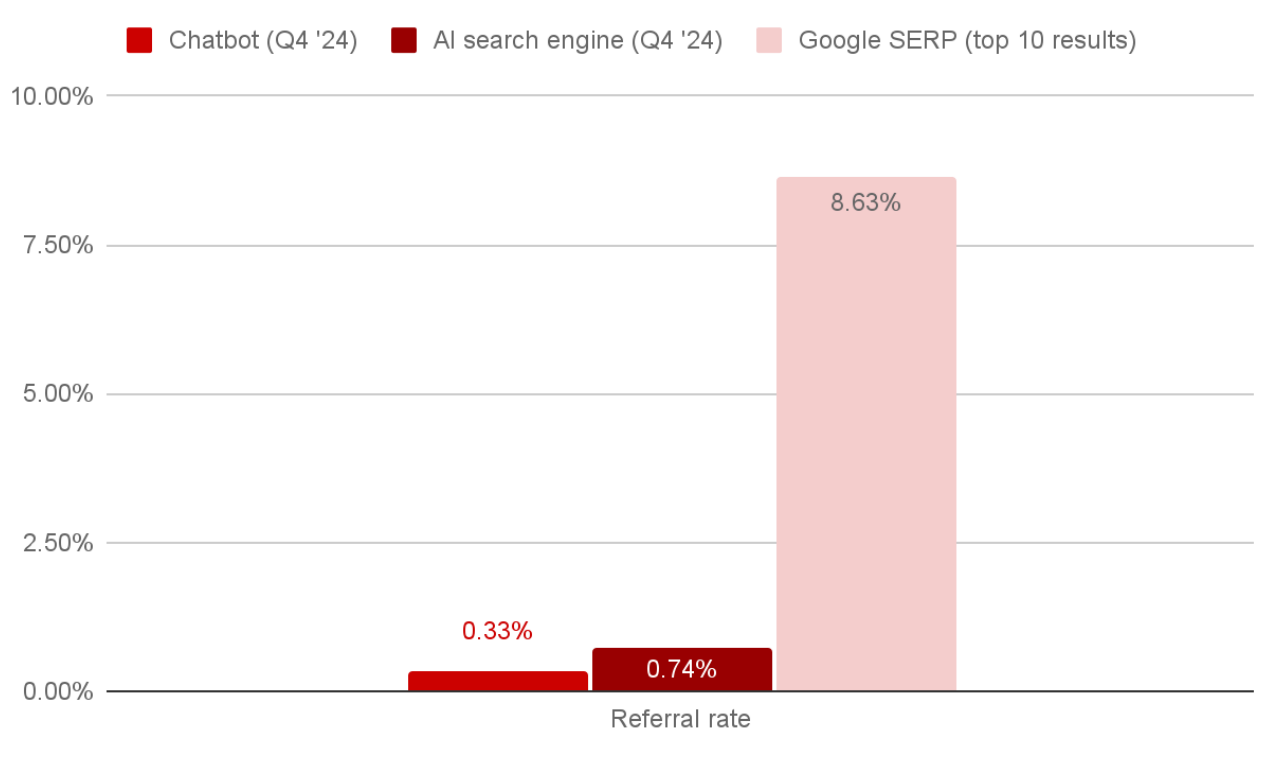
Last month we wrote about this in How AI Changes Customer Discovery, and you can see why businesses reliant on clicks (not to mention search giants like Google) are worried and working hard to figure out how to compete in a changing environment.
7️⃣ The Power Law of Spotify & YouTube
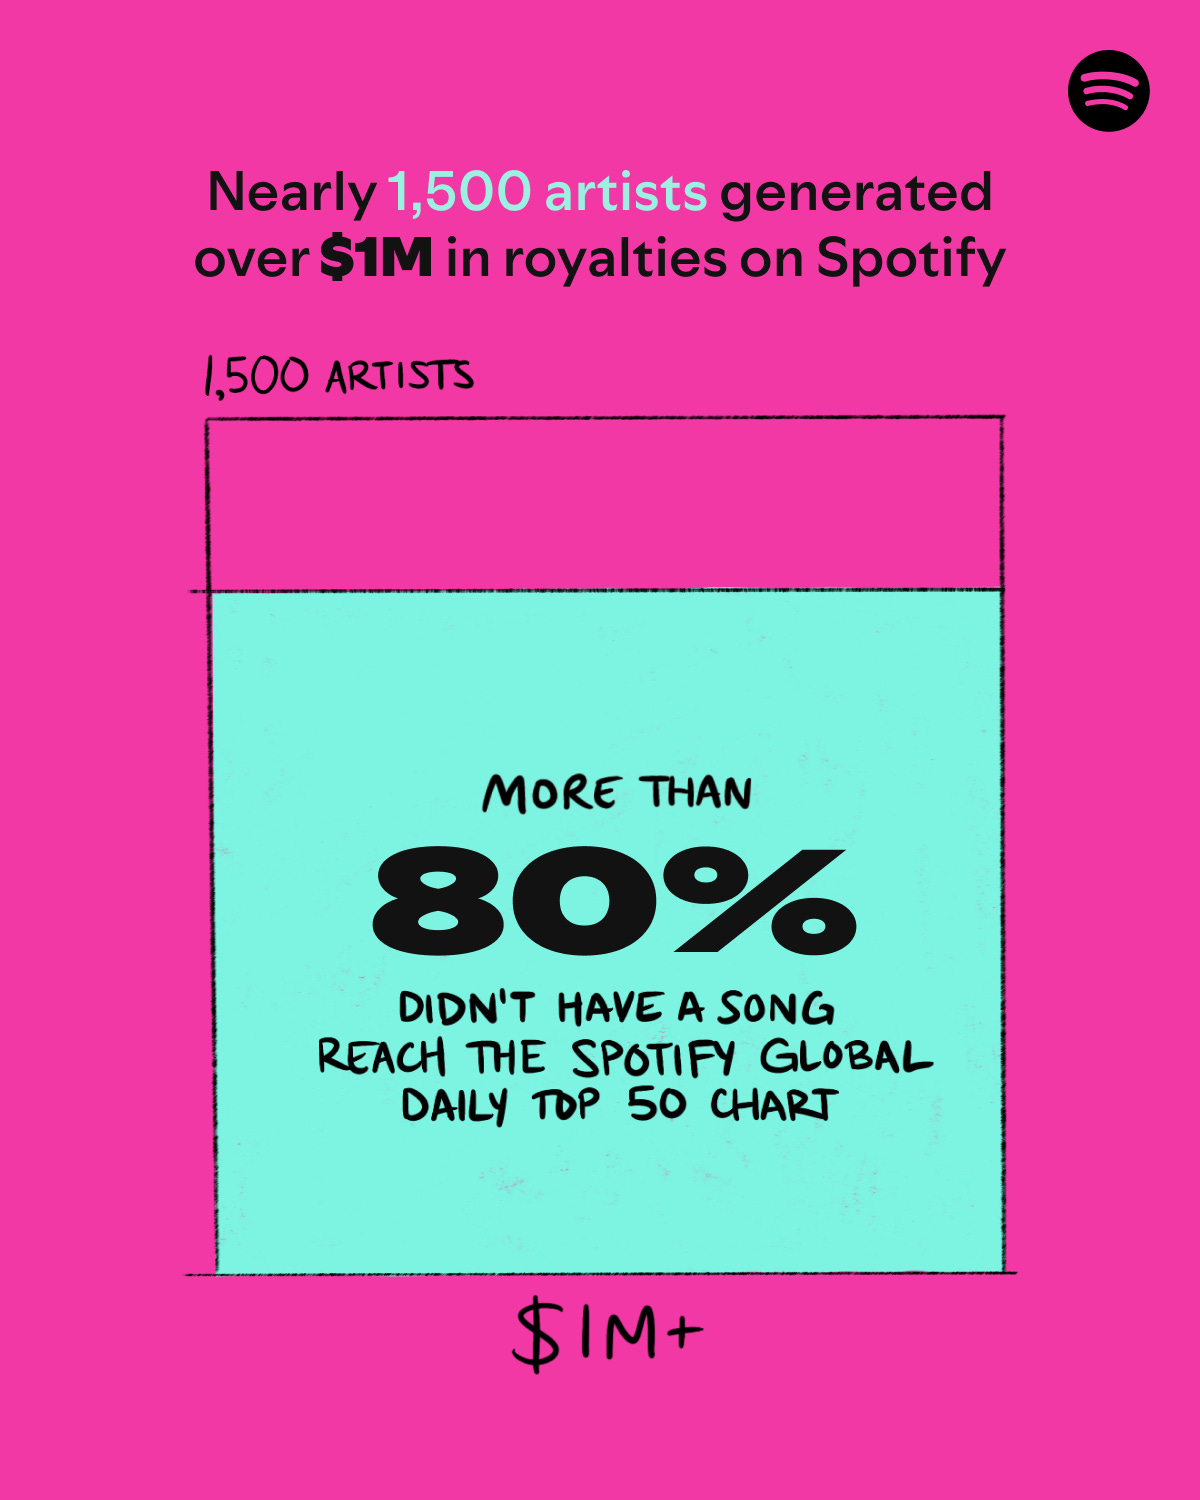
Spotify released a report this week on its “cultural and financial impact” in 2025. The company worked hard to highlight one key figure: 1,500 artists made over $1M in royalties on Spotify. About 10,000, meanwhile, make at least $130,000.
Of course, artists don’t get to keep all this money. They’re splitting that a bunch of different ways. To revisit one of the first charts in Digital Native (from a simpler time when Spotify cost $9.99 a month)—
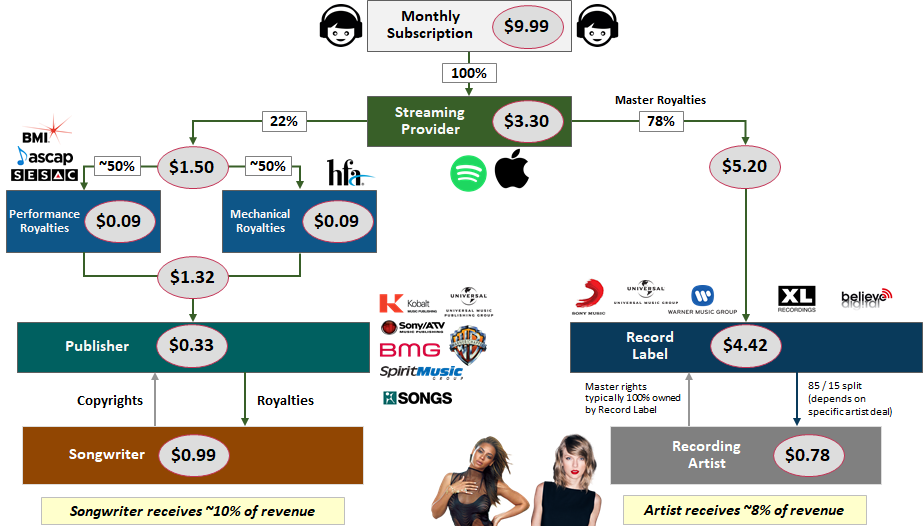
Clearly, Spotify is eager for artists—and the general public—to have a specific takeaway: a lot of people are making a lot of money on Spotify, and Spotify is good for the music industry. They’re not wrong: music streaming, in which Spotify dominates, has been a boon for the industry, taking it to new heights:

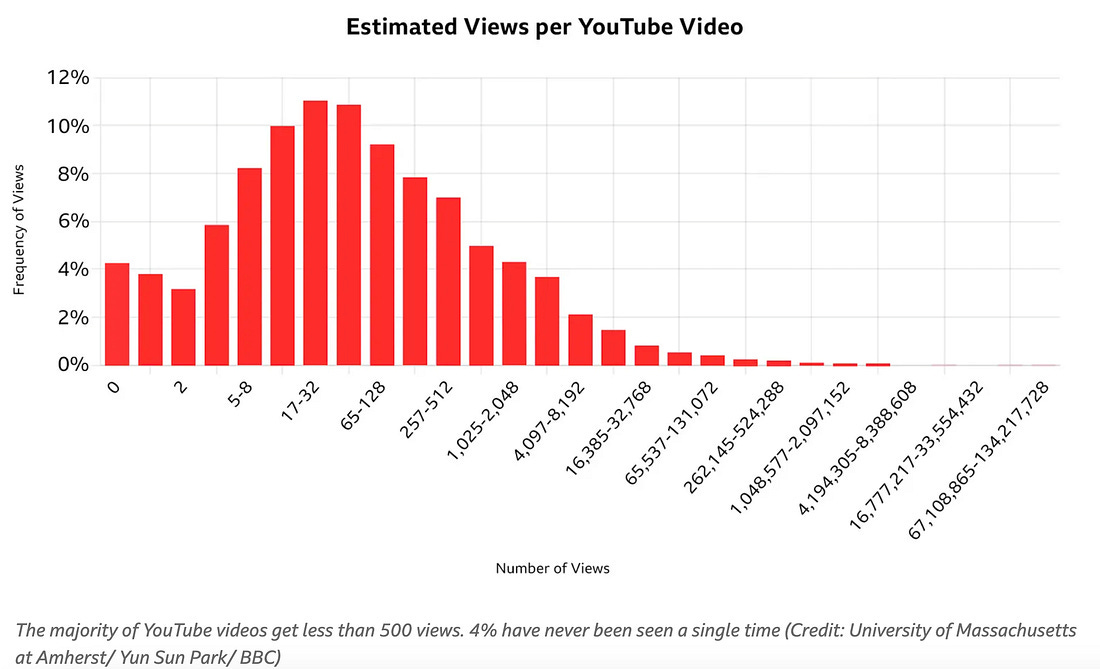
But the stats also highlight a thorny problem not specific to music: in any creative realm, there exists a power law in which a handful of creators guzzle up the lion’s share of the economics.
I recently came across this chart showing the number of YouTube videos with various levels of views, which makes a similar point: the average YouTube video has under 100 views; 4% of YouTube videos don’t have a single view.
What interests (and concerns) me here: how much more fragmented media will become with AI, and how much more dramatic the power law will be. There will be a lot more content out there, but it’ll become harder to stand out and earn a living from what you make.
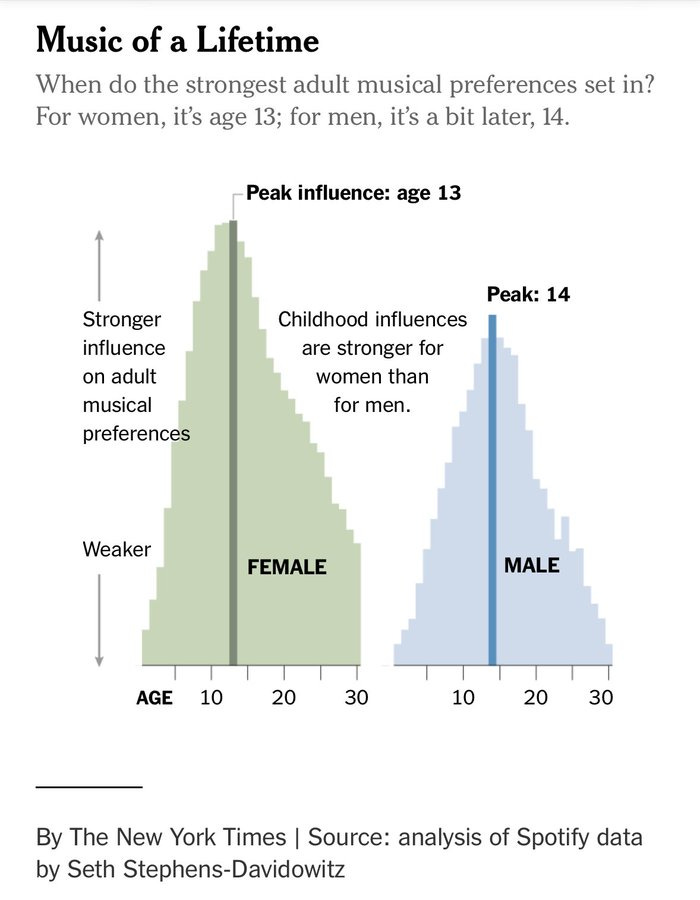
By the way—one more fun chart on music. Here’s a cool chart that shows that adult music preferences are shaped by the music you’re listening to as a teenager. No wonder I’m a sucker for anything that sounds like Beyoncé, Coldplay, or Pink.
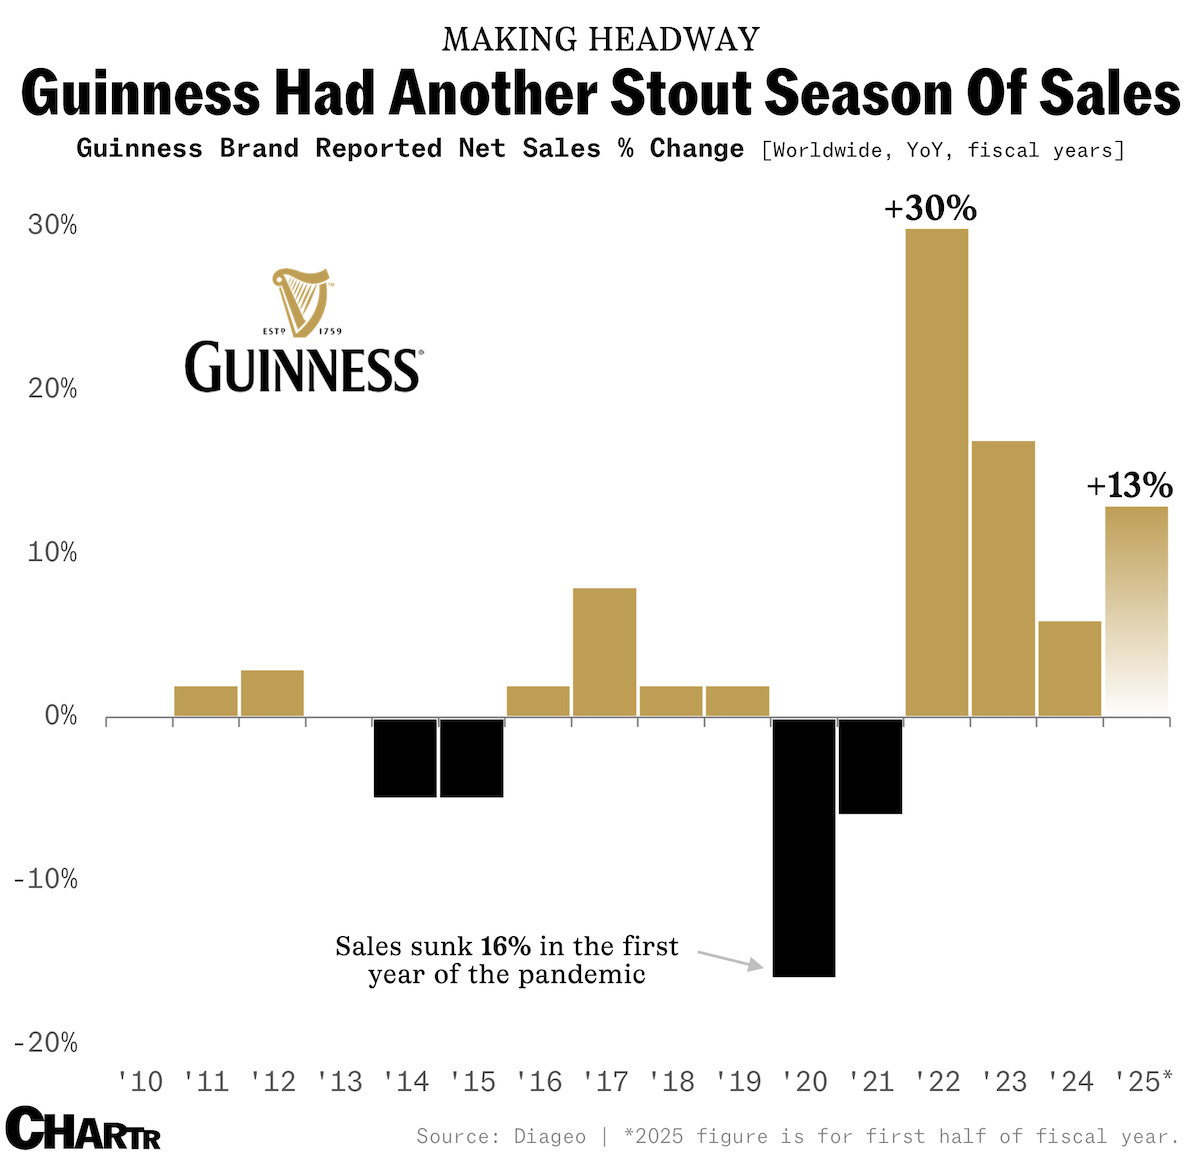
8️⃣ Guinness’s Viral Boost 🍻
Guinness—an Irish beer brand that’s been around since 1759—is experiencing a nice sales uplift. Revenue has seen double-digital growth for eight consecutive halves, pretty impressive for a business that’s older than America.
What gives? A TikTok trend, naturally. “Splitting the G” is a TikTok challenge that entails drinking just enough so that the dark portion of the beer and the foam on top evenly split the word Guinness on the glass. Example:

The success of “Splitting the G” harkens back to a 2023 piece, Viral Growth: How to Keep Lightning in a Bottle. Capitalizing on a viral moment—and keeping the momentum—is an art form.
Of course, Guinness’s success isn’t all TikTok virality. The beer brand also has nice long-term tailwinds: Diageo says that the number of female Guinness drinkers is up 50% year-over-year, and The Economist says that Guinness’s taste aligns with modern palates because of its “smoky tang.”
As more consumers shift away from alcohol, Guinness 0.0%—the beer maker’s non-alcoholic brand—more than doubled sales in Europe last year, and now makes up ~3% of Guinness’s global volumes.
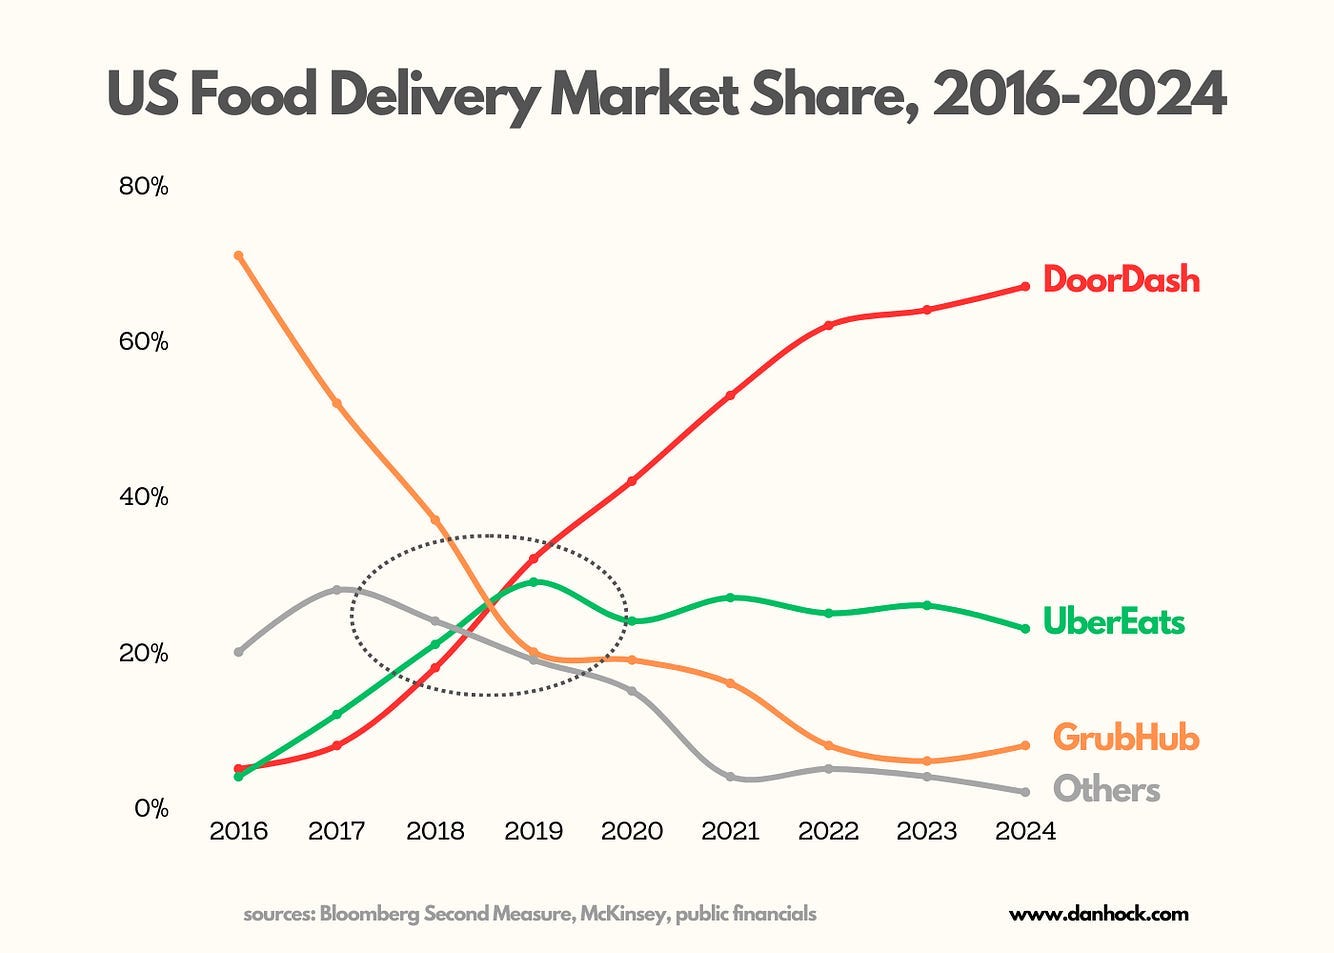
9️⃣ DoorDash Dominance
Few charts show more impressive market dominance—in a ruthlessly competitive space, no less—than this chart of DoorDash market share:
Super impressive. Dan Hockenmaier has a good breakdown of what happened. He focuses on three key decisions that DoorDash made:
Recognizing that owning delivery was the key to unlocking supply. Since most restaurants can’t support the economics of running their own delivery fleet, the Grubhub model of just routing orders to restaurants was set up to fail. As Dan notes, only DoorDash launched with the business model everyone now uses. Uber Eats started by loading cars with fresh meals at scale, while Postmates started with packages, not food.
The second big decision was to start in the suburbs. Everyone else went to city centers, which had better network density and better driver utilization. But in the suburbs, customers were more affluent and average order values were higher, improving the unit economics. The suburbs were also whitespace while urban centers were saturated.
The third decision was to go broad on restaurant selection. Wider selection was more important than delivery speed or price.
Dan’s piece goes into more depth and is a nice refresher of a masterclass in business execution. This is one of the more compelling case studies from the last decade. A category that has countless dead bodies, and that was fiercely competitive, now has a clear leader (one that only emerged around the pandemic, by the way) with 75% market share and a $77B market cap.
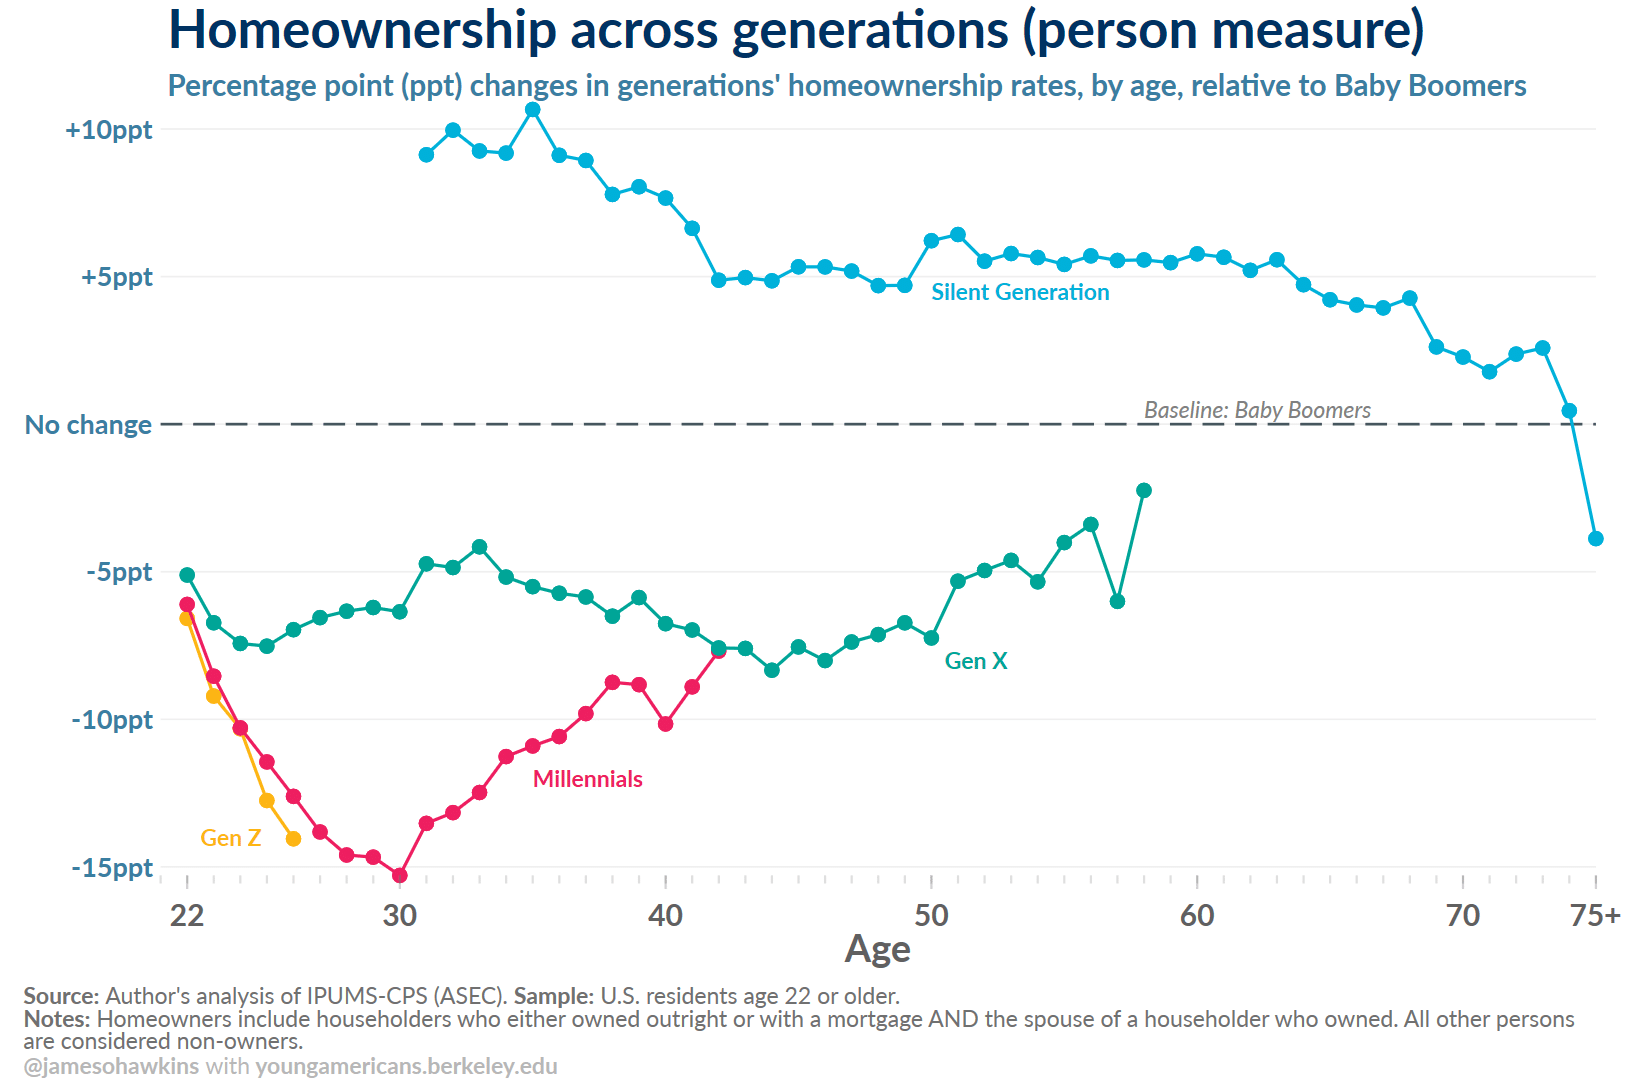
🔟 Gen Z Homeownership Rates
Baby Boomers are just ~20% of the US population, but own 38% of homes. They own 50%+ of three- to four-bedroom homes.
Homeownership rates for Gen Z, meanwhile, are even lower than Millennials at the same ages. In 2025, the average Gen Z needs to work 14 years to afford a down payment for a home, about 2x as long as Boomers back in the day.
As Kyla Scanlon puts it, “This isn’t frugality failure, it’s a system where 72.9% of wealth sits with those over 55.”
This is clearly the major trend in US economics, with trickle effects into politics (see: Trump). Another view of the same trend, shared in a prior Digital Native:

You can learn a lot about the 21st Century United States by studying this chart.
See you next week 👋
Thanks for reading! Subscribe here to receive Digital Native in your inbox each week: