


The Cross-Currents Shaping Crypto Markets
Exploring the macro and crypto forces driving current market dynamics

Get the best data-driven crypto insights and analysis every week:
The Cross-Currents Shaping Crypto Markets
By: Tanay Ved
Key Takeaways:
Crypto markets have been weighed down by macroeconomic headwinds and industry-specific challenges, resulting in renewed volatility.
Bitcoin remains largely uncorrelated to traditional assets like Gold and the S&P 500, underscoring its unique positioning in the current macro environment.
Bitcoin’s dominance continues to rise, reinforcing a market structure increasingly driven by institutional capital while retail participation remains subdued.
Market conditions remain uncertain, but improving macro dynamics, regulatory clarity, and shifting capital flows could create a strong foundation for long-term market growth.
Introduction
Hit by waves of volatility and uncertainty, the digital asset market finds itself caught in the crosscurrents of macro-economic pressures and crypto-specific forces. Just weeks ago, BTC was consolidating near $100K, with market participants optimistic about another phase of growth under a more supportive administration and structural catalysts. Now, as BTC hovers around $80K, sentiment has visibly shifted. Speculative activity has cooled, events like Bybit’s hack have added to the unease and risk appetite has weakened amid economic uncertainty. Yet, positive developments continue unabated, including the establishment of a US Strategic Bitcoin Reserve and a constructive shift in the regulatory approach towards the industry.
In this issue of Coin Metrics’ State of the Network, we assess the drivers behind recent weakness in crypto markets and where we stand in the broader market cycle, examining both macroeconomic and crypto-specific forces shaping the road ahead.
Macro Takes the Wheel
The broader stock market and crypto-assets alike have experienced a turbulent few months, erasing their post-election gains. The primary driver of this volatility has been intensifying macroeconomic pressures, in the form of Trump’s aggressive trade policies, retaliatory measures from major US trading partners and escalating geopolitical tensions—all of which have created an environment of uncertainty, weighing on inflation expectations and economic growth.
Despite seemingly positive developments, including the establishment of a Bitcoin Strategic Reserve ahead of the inaugural White House Crypto Summit, the SEC dropping high-profile lawsuits and growing institutional momentum, macroeconomic headwinds and recent industry-specific challenges have kept digital asset markets under pressure.
Source: Coin Metrics Formula Builder
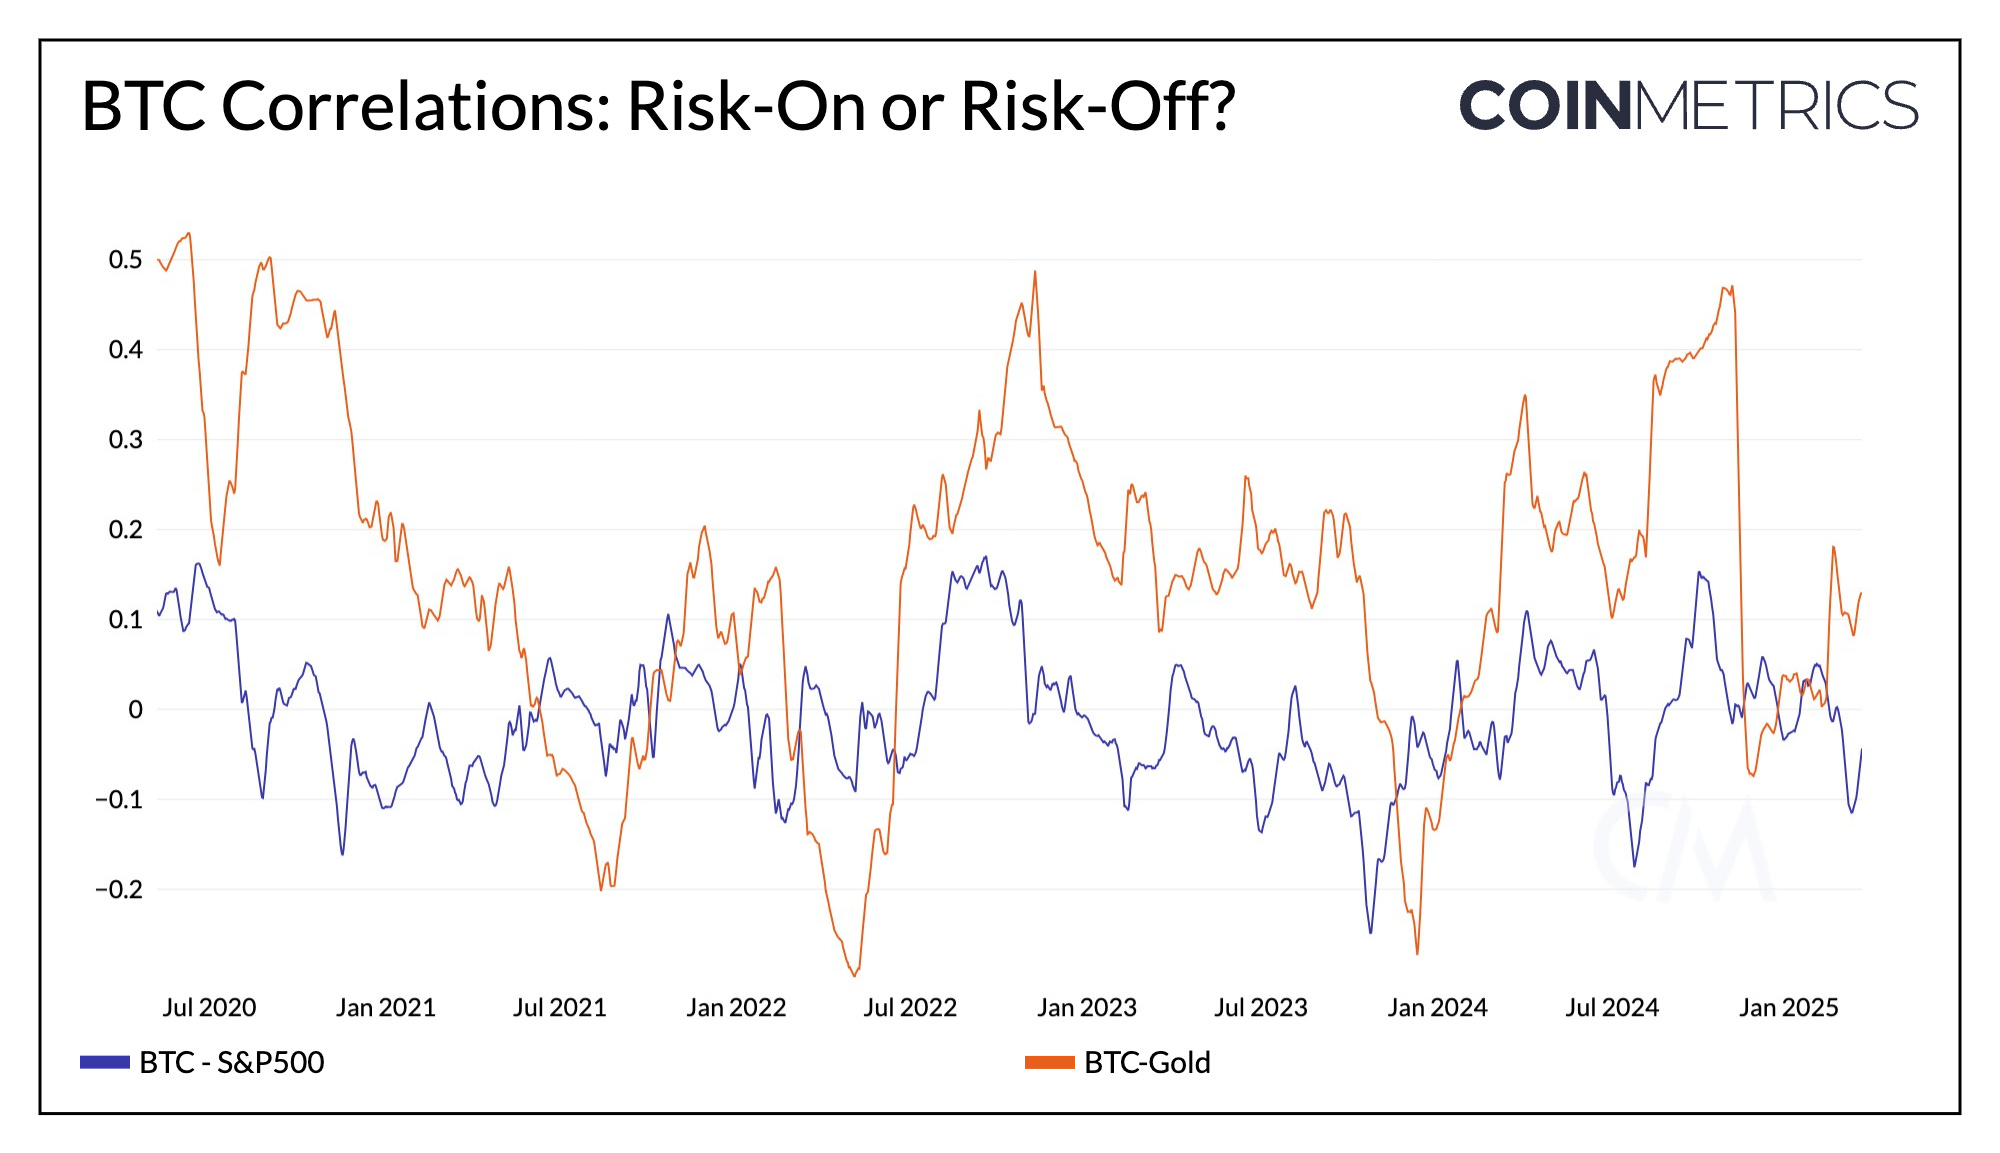
In the current uncertain market environment, gold has surged beyond $3000 as investors flock to the premier safe-haven asset. Meanwhile, the S&P 500 and Nasdaq Composite have declined 3.8% and 8.2% year-to-date, respectively, as risk appetite fades. Bitcoin, however, seems caught between these two forces. While often viewed as “digital gold” and a hedge against inflation or market instability, BTC is yet to establish a meaningful correlation with Gold. Instead, its 90D correlation with both the S&P 500 and Gold remains weak (~0), suggesting its uncorrelated nature and ambiguous role in the current market regime.
Crypto’s Internal Forces
Is Retail in the Room?
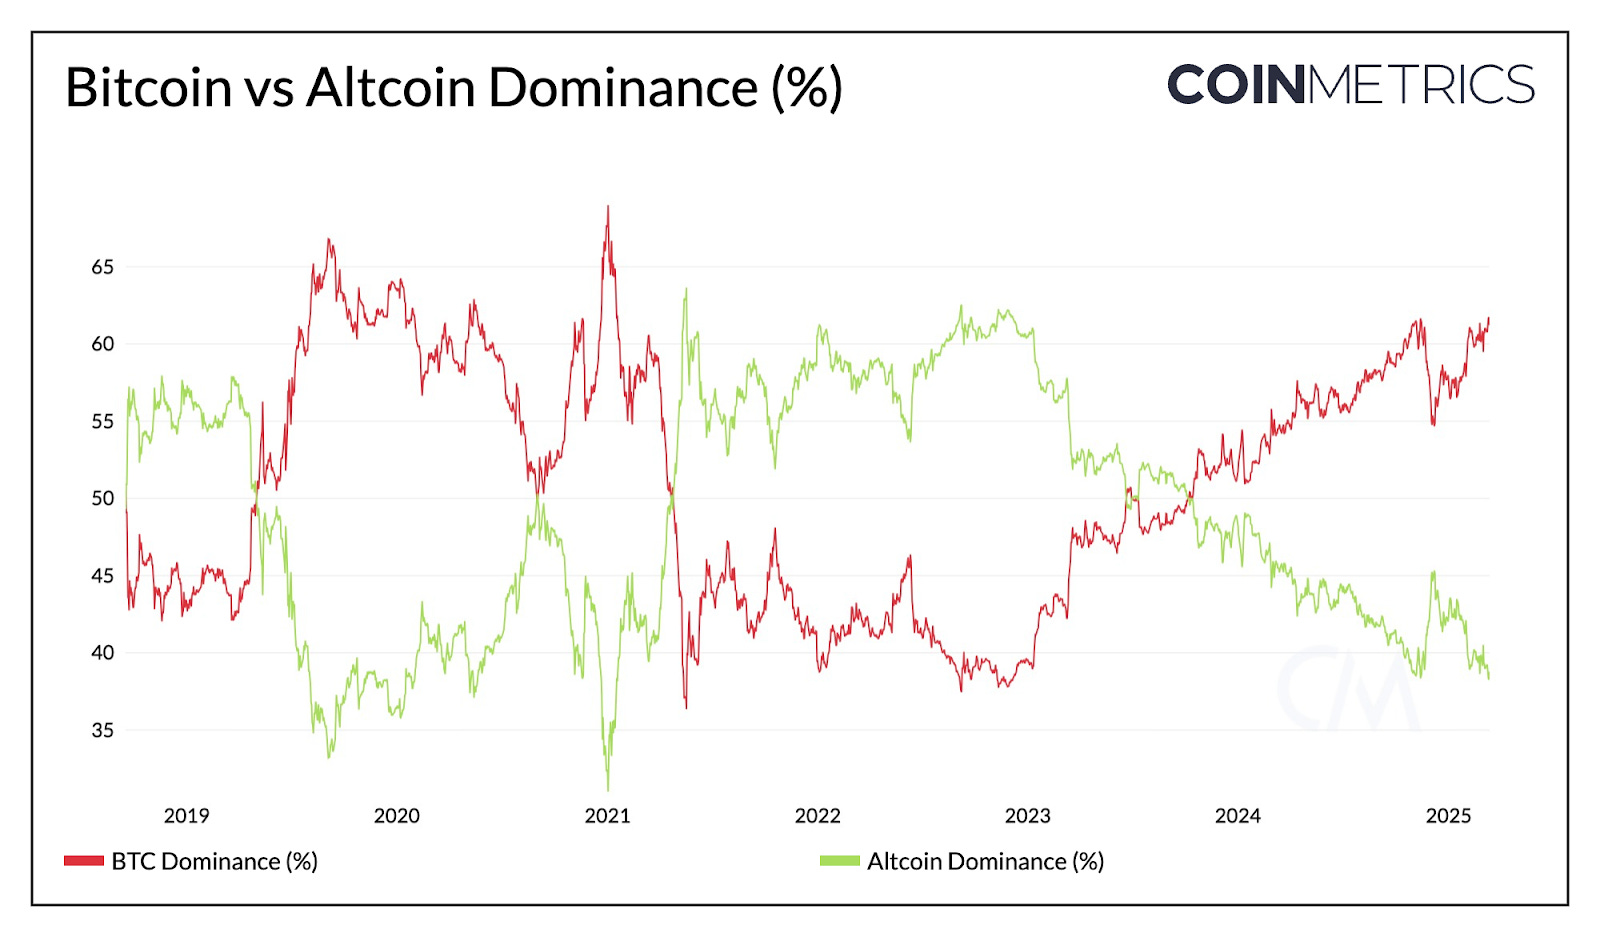
Despite the larger macro forces at play, dynamics intrinsic to crypto-assets continue to shape the market in unique ways. In typical fashion, Bitcoin (BTC) remains the primary market driver and a barometer for market-wide risk appetite. Bitcoin dominance, measuring its market cap relative to the total crypto market, has steadily climbed from 37% in November 2022 to 61% today. While this is characteristic of past cycles, structural shifts like the introduction of spot Bitcoin ETFs and demand from corporate holders like Micro(Strategy) have amplified this Bitcoin-driven market structure.
Source: Coin Metrics Network Data Pro
In contrast, altcoin dominance has trended towards 39%. While historically, a decline in bitcoin dominance has preceded capital rotation into altcoins, signaling the onset of “altcoin season”, a reversal in the current trend remains elusive. This extended weakness in altcoins likely reflects the widening divide between institutional and retail sentiment, also evident in spot trading volumes. While altcoins at large have struggled to keep pace, memecoins emerged as the preferred vehicle for retail speculation. However, a recent cooldown in the sector has further dampened retail sentiment.
Source: Coin Metrics Reference Rates
ETH’s Underperformance & Altcoin Divergence
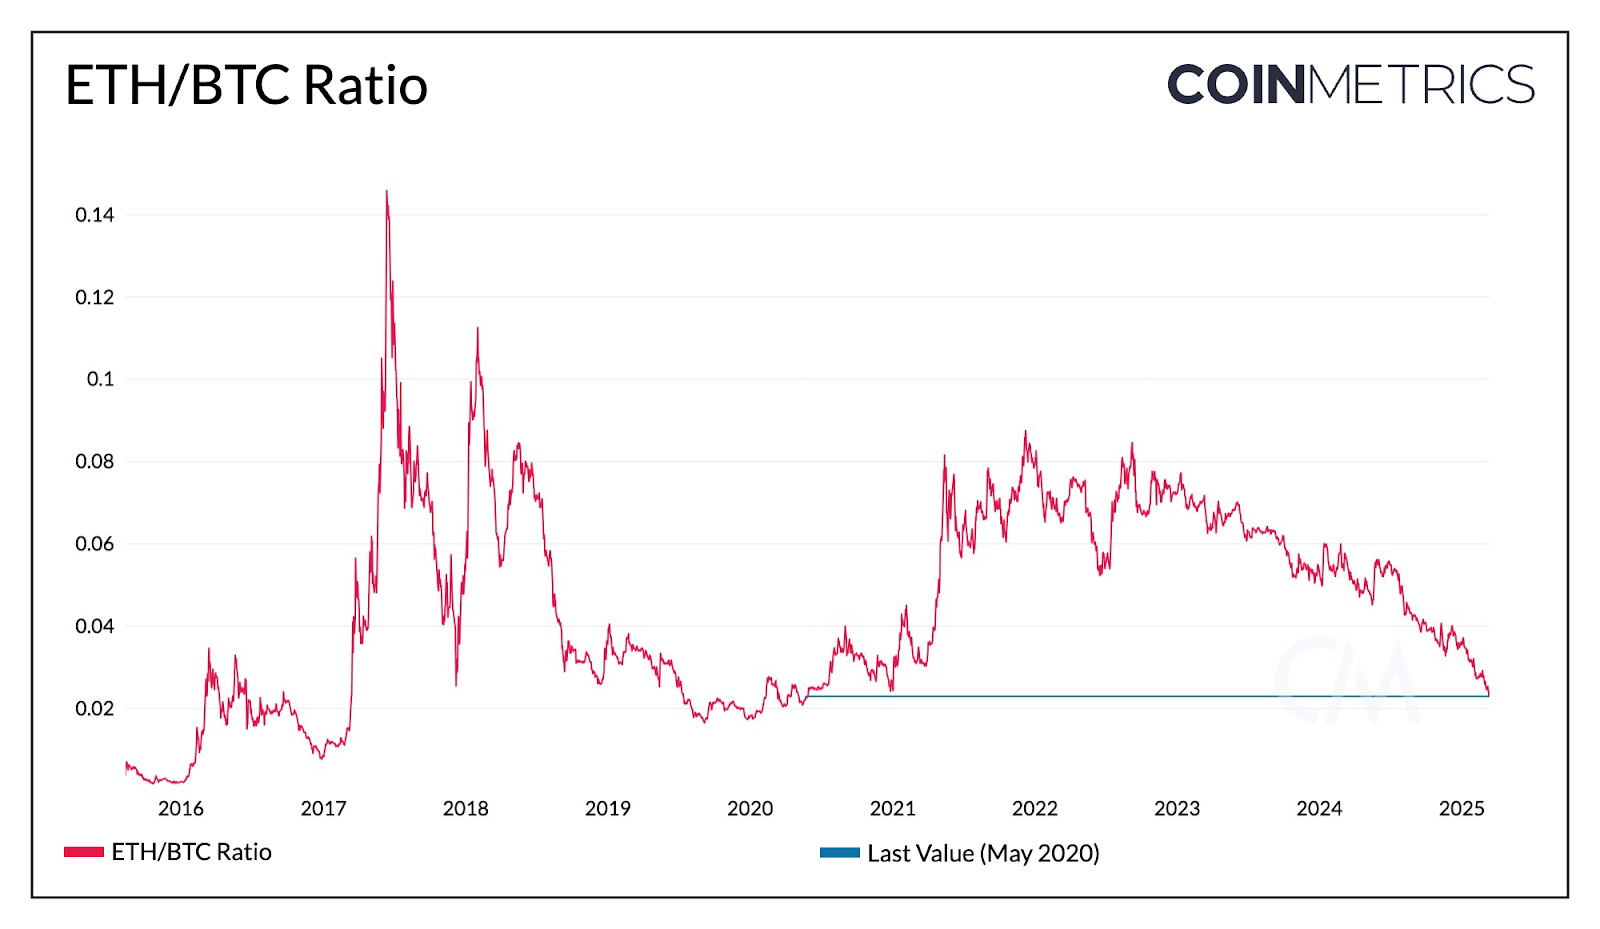
Another factor at play is the continued underperformance of Ethereum (ETH) relative to Bitcoin (BTC). Historically, shifts in ETH/BTC have been correlated to movements in altcoin dominance, increasing when ETH/BTC weakness reversed in 2017, 2018 and 2021. Currently at 0.022, the ETH/BTC ratio is at levels last seen in May 2020.
While this underperformance can be attributed to Ethereum’s own challenges, such as reduced Layer-1 activity, value accrual from L2s and competition from alternative L1s, it has also weighed on broader altcoin sentiment. A reversal in ETH/BTC, alongside an improving macro outlook and greater regulatory clarity, could serve as a potential catalyst for altcoins, particularly those with more established fundamentals and clearer investment theses in sectors positioned for structural growth.
Volatility Rises, Leverage Resets
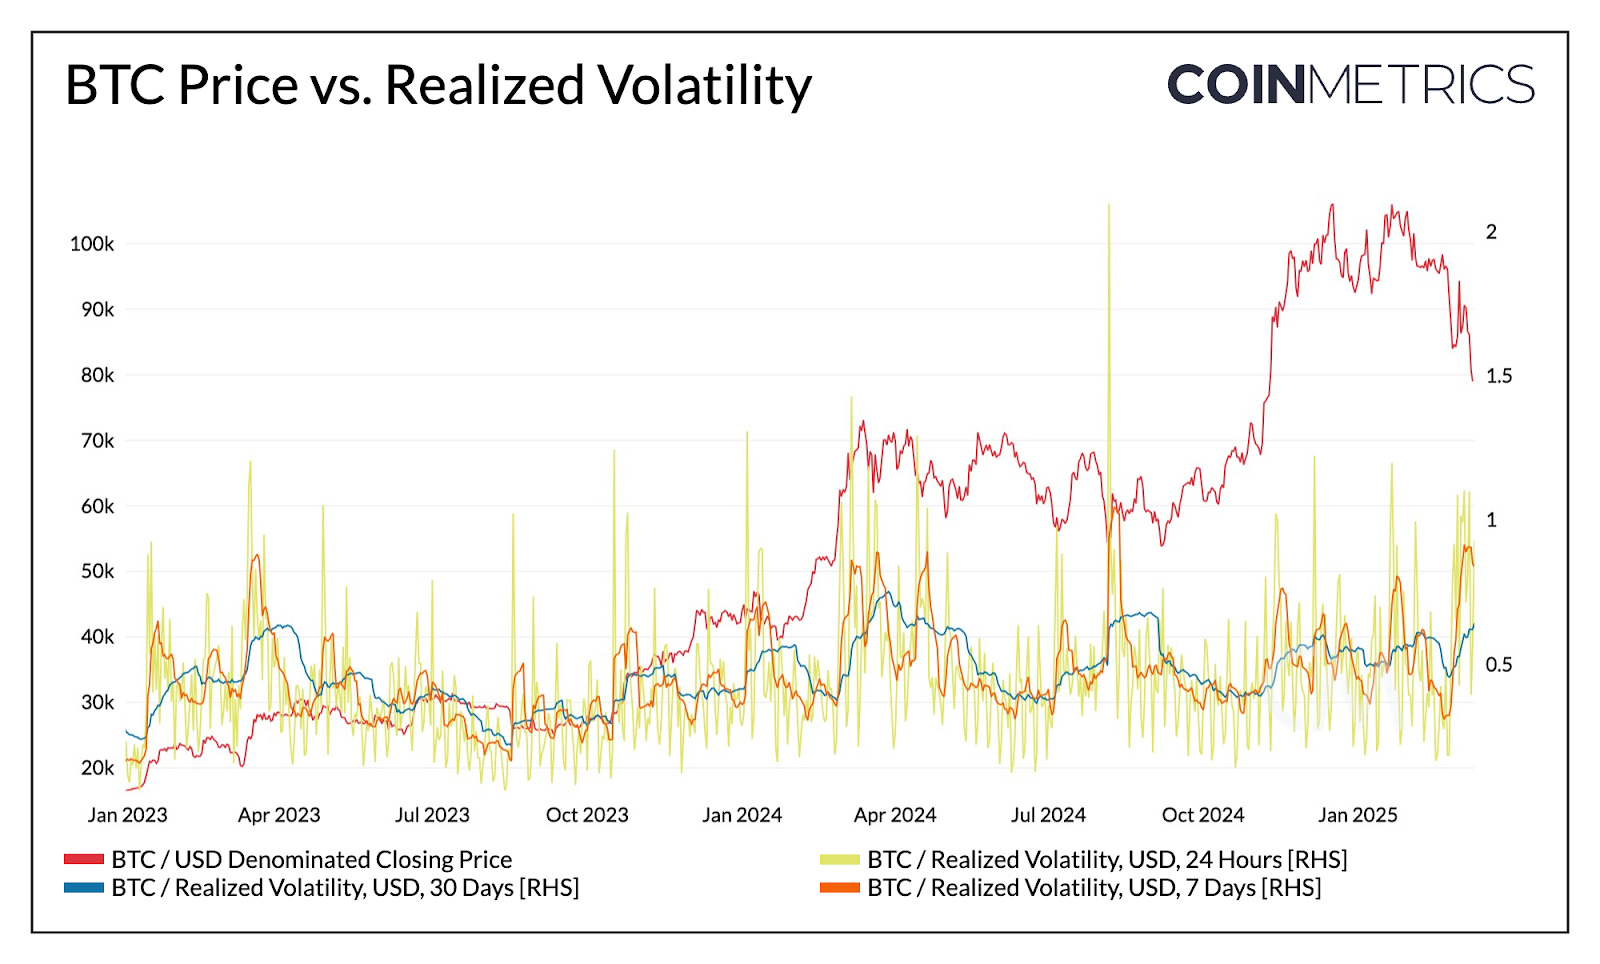
A characteristic trait of Bitcoin (BTC) is its volatility. While BTC’s volatility has dampened over time, it is still prone to large drawdowns and swings in price. Most recently, we can see daily volatility on the rise, with BTC’s 7-day realized volatility reaching 0.9 amid a ~25% drawdown.
Source: Coin Metrics Market Data Pro
This volatility has spurred a wave of liquidations in spot and derivative markets of late. However, Bitcoins futures market suggests a healthier positioning compared to a few months ago. Futures open interest has dropped to levels seen before the November elections, indicating that excess leverage has been flushed out. Futures open interest relative to its market cap has also declined, suggesting that speculative positioning has reset. This provides a more stable foundation for the next leg of growth.
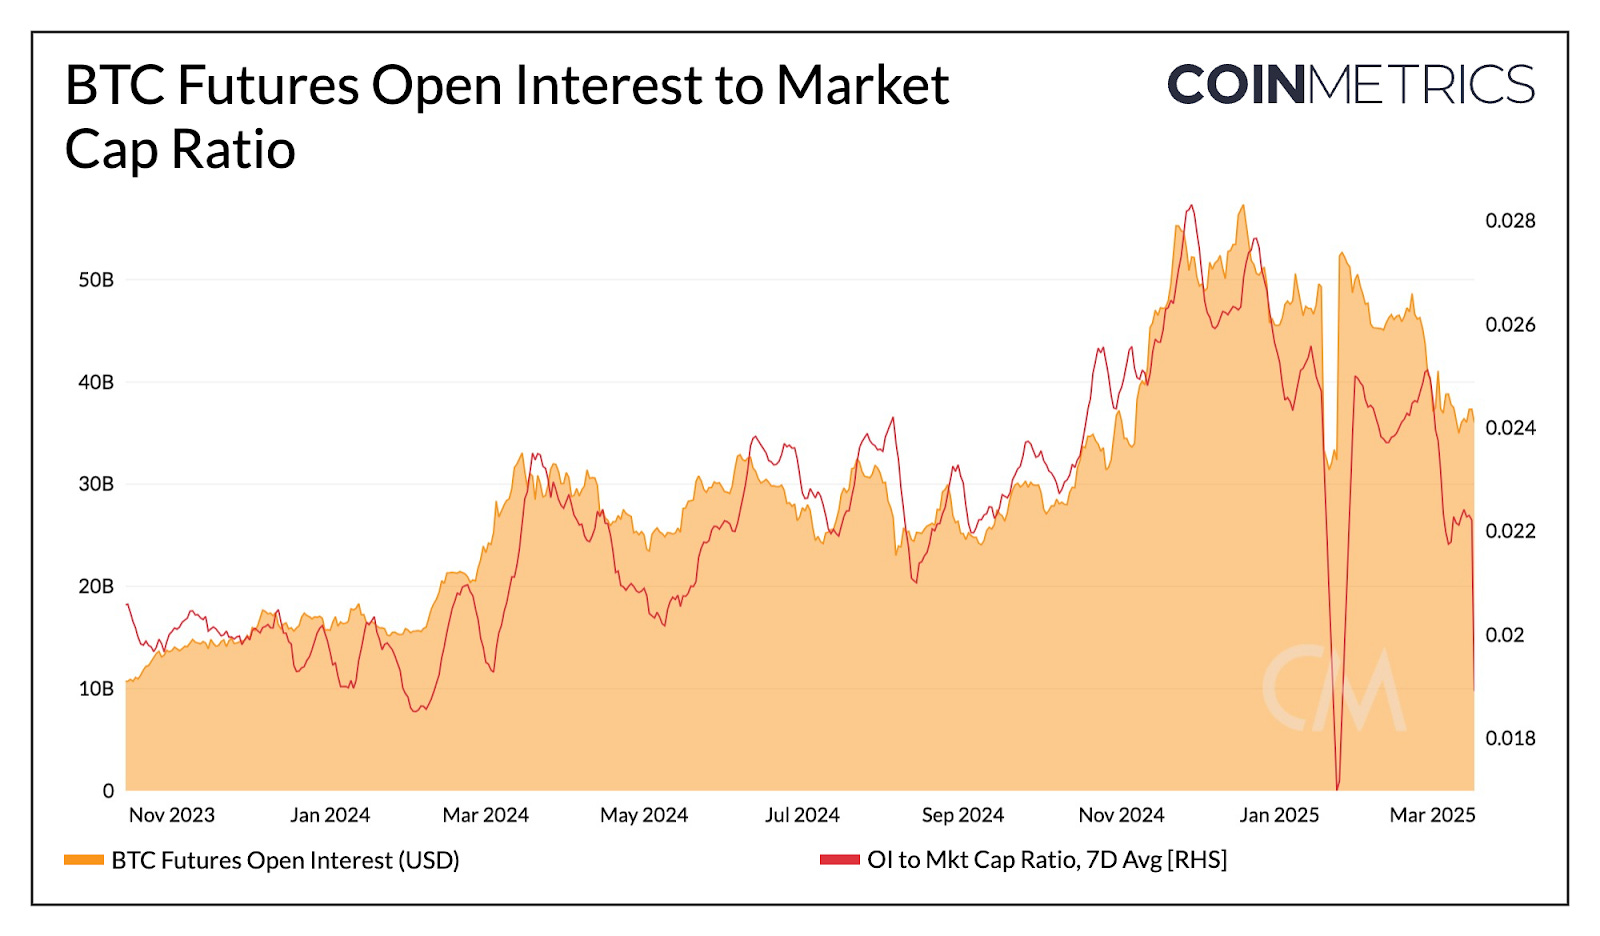
Source: Coin Metrics Market Data Pro
Where Are We in the Cycle & What's Next?
Given the current environment, where do we stand relative to prior “cycles”? Among other metrics, Bitcoin’s MVRV ratio, measuring the ratio of Bitcoin’s market value to its realized value (aggregate value of the price at which coins last moved on-chain), can serve as a useful indicator of cycle positioning. Historically a high ratio (>3.5) has signaled an overheated market, whereas a low ratio (1) indicates attractive accumulation zones.
Currently, Bitcoin’s MVRV ratio sits at 1.9, peaking near 2.65 earlier this year. This places it above the bear market lows but below the euphoria of past cycle peaks, suggesting that we’re in a mid-cycle reset. While historical trends provide a useful framework, structural shifts such as ETF driven demand, evolving investor profiles and regulatory clarity, all of which didn’t exist previously, could reshape how this cycle unfolds and how we interpret it relative to past ones.
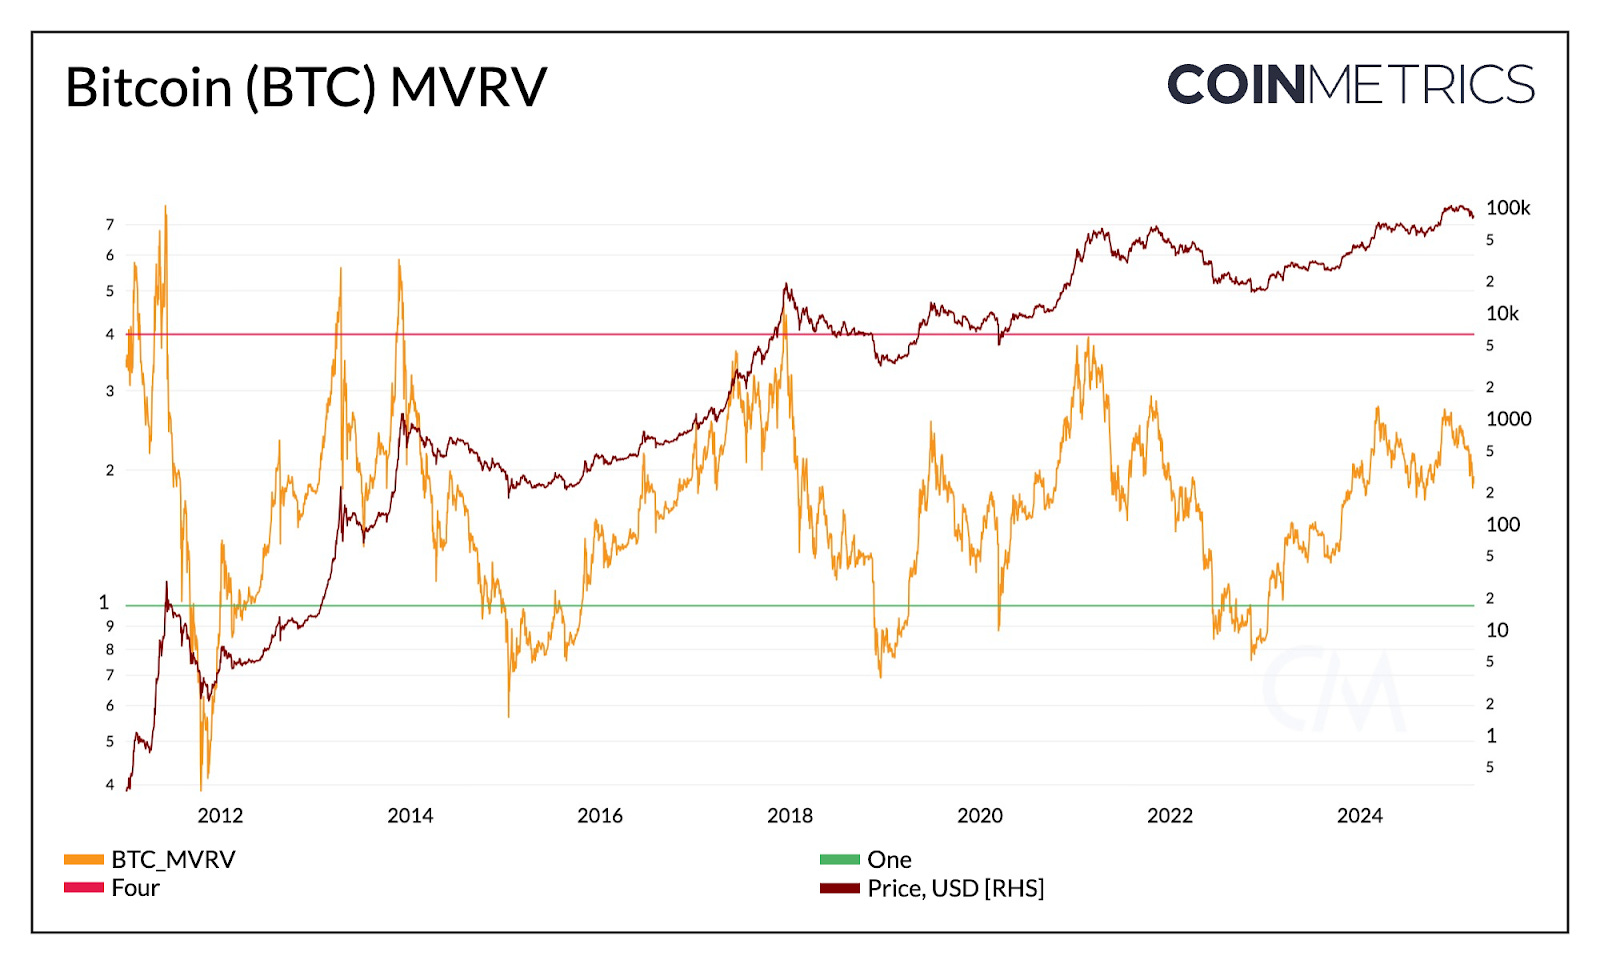
Source: Coin Metrics Network Data
Looking ahead, the medium to long-term outlook remains positive. Expectations of a supportive administration and SEC are coming to fruition. Regulatory clarity in areas like custody and bank participation, stablecoins and tokenization of real world assets (RWAs), among many others, could unlock a significant wave of adoption. While the macroeconomic landscape remains uncertain, the foundation is in place, and as structural shifts take hold, the onset of rate cuts and renewed liquidity could help drive the next phase of market growth.
Network Data Insights
Summary Highlights
Solana SIMD-0096 went live on February 12th, redirecting 100% of priority fees to validators. This alters the the previous split, where 50% was burned and 50% was collected by validators. Before the update, 16,000 SOL was burned on average per day, now reducing to ~960. Additionally, SIMD-0123, which introduces on-chain revenue-sharing between validators and stakers, passed with 75% approval, enhancing staking incentives and transparency.
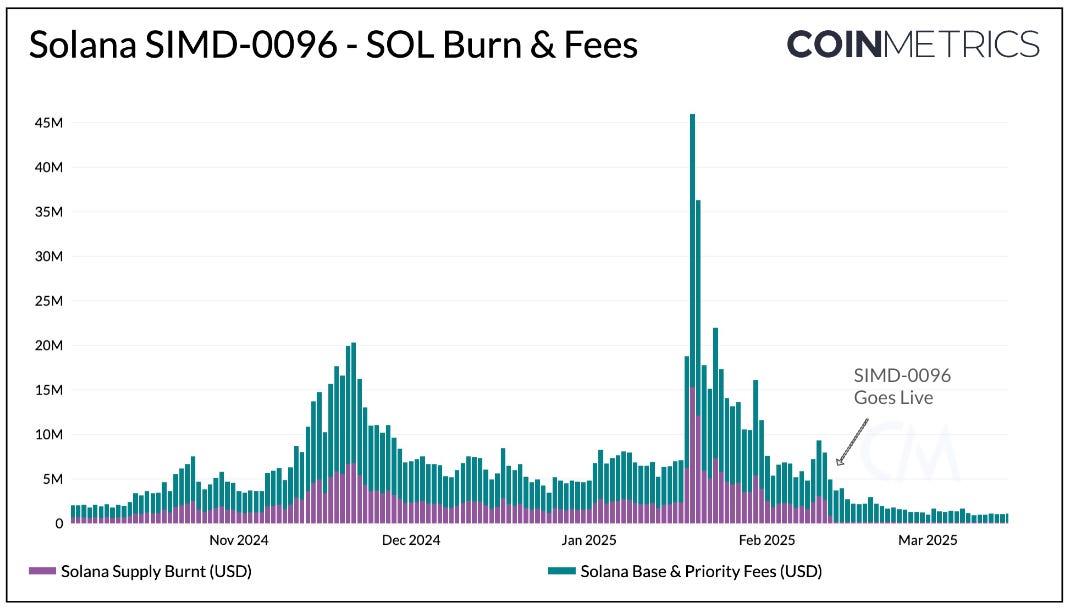
Source: Coin Metrics Network Data Pro
This week, Solana’s proposal to implement a dynamic SOL issuance model based on staking participation (SIMD-228) failed to pass. This keeps the current fixed inflation schedule intact, decreasing annually from ~4.6% to 1.5% over time. For more on Solana, check out our Analyst Spotlight Solana Overview report.
Coin Metrics Updates
Follow Coin Metrics’ State of the Market newsletter which contextualizes the week’s crypto market movements with concise commentary, rich visuals, and timely data.
As always, if you have any feedback or requests please let us know here.
Subscribe and Past Issues
Coin Metrics’ State of the Network, is an unbiased, weekly view of the crypto market informed by our own network (on-chain) and market data.
If you'd like to get State of the Network in your inbox, please subscribe here. You can see previous issues of State of the Network here.


