The app for independent voices
Evergreen note: “Analytics” are not mere numbers. They’re models: ways of bridging practical (what happens on ice) and theoretical knowledge (what will or can happen based on prior events). They help define the conditions of performance over a period of time rather than glimpsing raw plus-minus. The climate versus the weather; defining the signatory rather than just the signature. These are not meant to be a right or wrong way to look at a hockey game; they’re meant to be useful in understanding the conditions of hockey itself.
The Stat: Goals Above Replacement (GAR).
The question Goals Above Replacement attempts to answer: What is the single value of any given player’s impact on goals — either their generation or suppression of — compared to a replacement level player, and by extension, the rest of the league?
How it answers that question: It's important to remember that every stat answers a different question. sG is different from xG, which is different from RAPM, and so forth. The concept of 'replacement' level within GAR (and by extension WAR and SPAR, which we'll get to) is important, because GAR wants to be a single-value stat. It wants to “deal in absolutes” because the absolutes we do have aren’t enough. In this case, we want to know the total goal SURPLUS of a player. I don’t care about the player who’s a plus 10. I care about the player who adds 10. So that’s the essence of GAR.
So why replacement level? To understand this, we need to understand why we don't give a s*$t about averages. Let me demonstrate! For the 2023-2024 season, Dallas scored 242 goals among its 16 skaters. An "average" goal scorer on this Dallas team would have scored 15 goals. But is there anything average about scoring 15 goals? Of course not. Hence the concept of replacement-level. Instead of comparing various metrics to an artificial average, GAR compares various metrics to the average production of a specific cohort: in this case, the average contributions of a healthy scratch 13th forward, or 7th defensemen making league minimum.
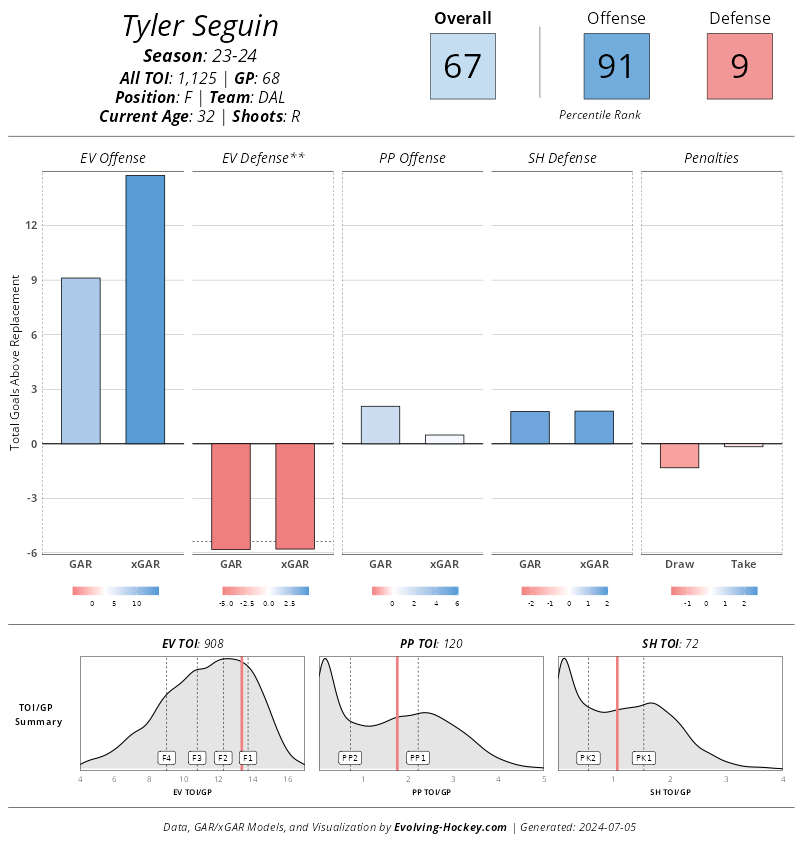
"What metrics?" Glad you asked. GAR models weigh the following variables against how much higher, or lower, a player will perform over that replacement level performer.
Even Strength Offense
Even Strength Defense
Power Play Offense
Short Handed Defense
Penalties Taken
Penalties Drawn
There is a black box element — as you would expect from a single-value stat — which is that these numbers are determined by what’s called regression analysis; a kind of way of sorting through the insane amount of data that hockey offers. There’s a really good explainer of regression analysis in the Sources list at the end. The purpose of this regression analysis is to establish which of the above elements link more closely with their bottom line value. It’s easy to see how traditional analysis would fail certain players. Devin Shore, for example, was 7th in scoring for Dallas in the 2017-2017 season, but was 9th among their forwards, and 13th overall in xGAR. For this year’s Stars, Joe Pavelski was second in scoring, but ranked 14th in xGAR. Granted, there’s a discussion within that (I’m not saying Pavelski was Dallas’ 14th best player), but ultimately this data is about categorizing the data of players, and resolving contradictions.
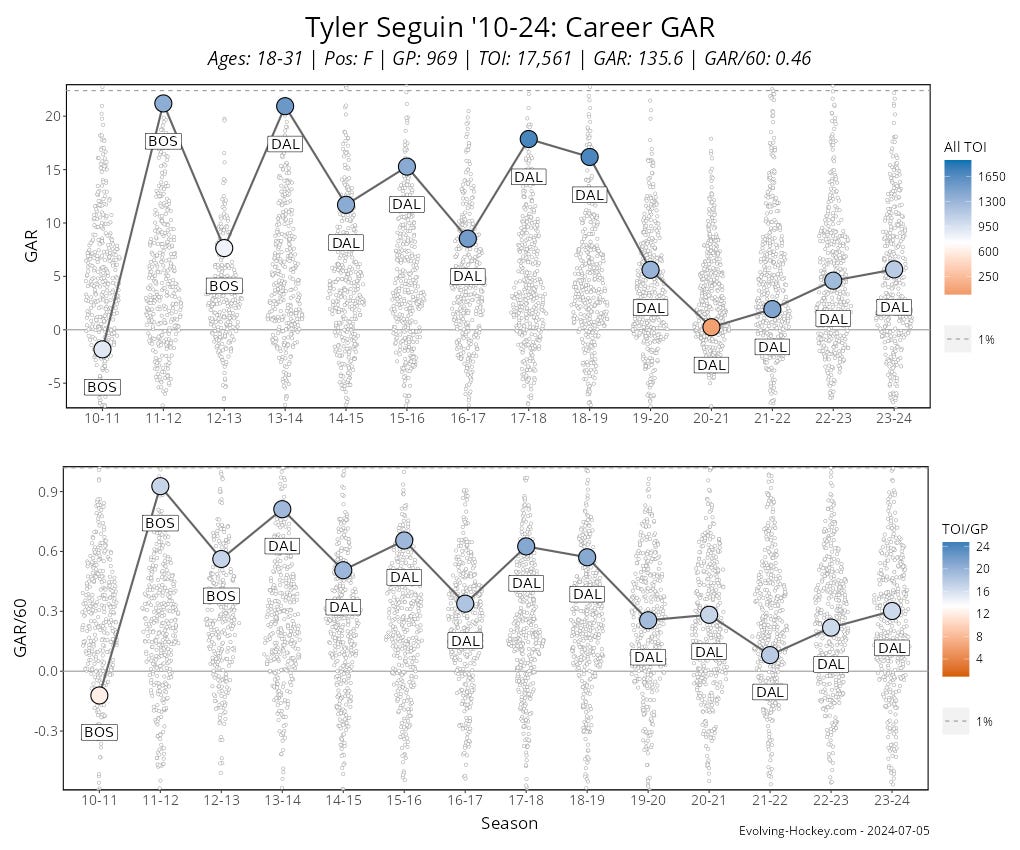
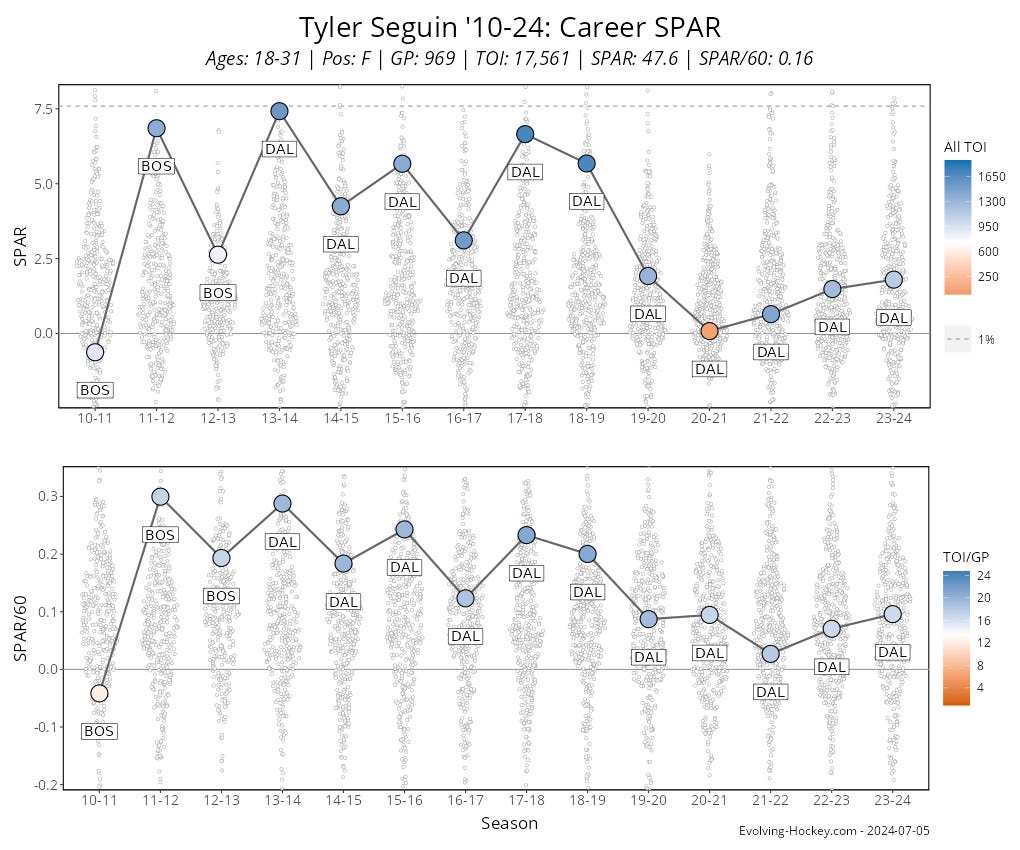
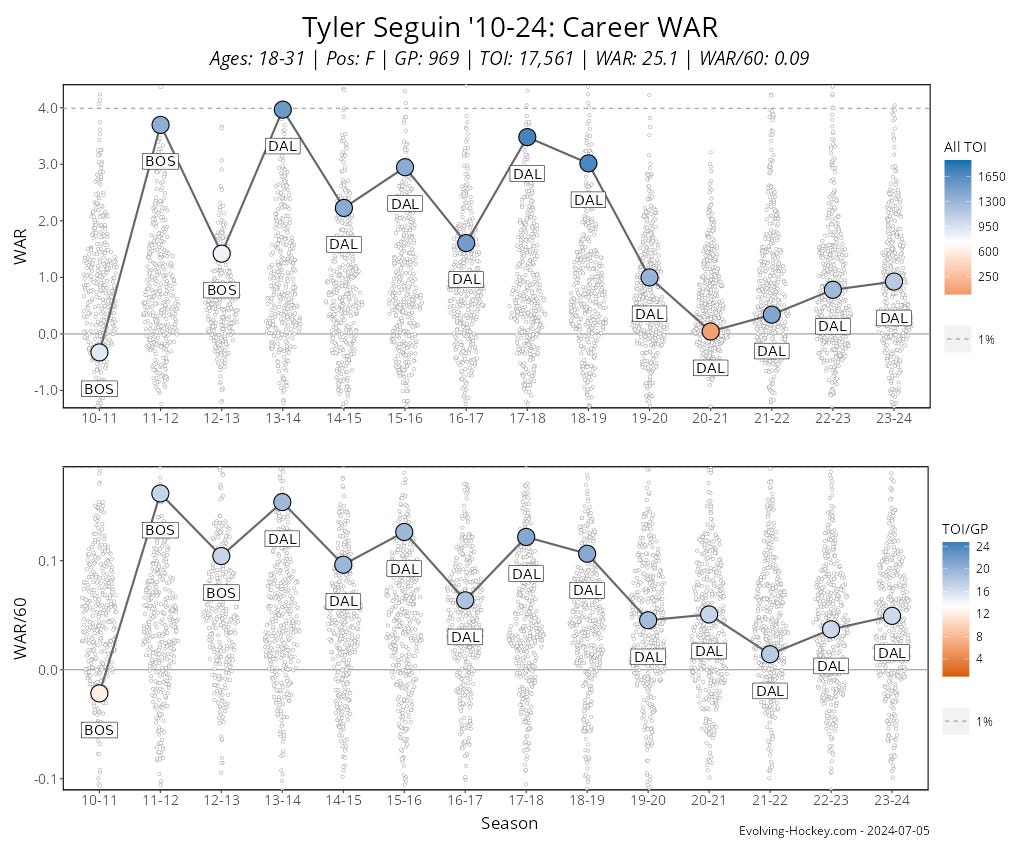
The math for GAR can be sorted in three different ways: goals, wins (WAR), and standing points (SPAR). For casual fans, SPAR might be more intuitive despite people hearing about it the least. “How many points in the standings did the team gain or lose by having Player X in the lineup?”
Attached are various GAR charts for Tyler Seguin, shown in goals, wins, standing points, and percentile.
Sources/Further Reading


