Powering the Holiday Symbols: Energy and Emissions of Christmas Trees, Hanukkah Menorahs, and Kwanzaa Kinaras

The holiday season has a handful of hallmark indicators that announce its arrival– the immediate overtaking of popular radio, jack frost forcing you to bust the heavy jackets out from the back of the closet, and the increased crowds at malls everywhere. But if those harbingers of the upcoming festivities elude you, the season has one surefire signal that pops up everywhere to grab your attention– the decorations!
Specifically, as soon as Thanksgiving is over, youwould have to live under a rock not to notice the twinkling lights adorning storefronts, lamp posts, and porches across the country. Whether they’re for Christmas, Hanukkah, or Kwanzaa, lighting is an important part of the holiday season. That got me to pondering, naturally, about the relative energy use of lights and candles for each of these three holidays and their signature decorative centerpieces– the Christmas tree, the Hanukkah Menorah, and the Kwanzaa Kinara. I was interested not only in the question of how the energy use required by these three decorations compare with each other, but also what is the most efficient way to light each of them for the energy-conscious celebrator? Also, how do these three symbols of their respective holidays stack up in terms of carbon dioxide (CO2) emissions?
If these questions have been nagging you since you first spotted Christmas decorations for sale at Target in October (and I know they have), then you’re in luck. Keep reading for some estimates, assumptions, back-of-the-envelope math, and analysis and conclusions!
Preemptive notes
As had to be recognized in the other holiday posts (Most Climate Friendly Way to Light Your Jack-O’-Lantern and Talking Turkey: Thanksgiving Dinner Energy Use and Carbon Dioxide Emissions), these calculations are based on some liberal assumptions and over generalizations that are traced to readily available information. There will obviously be differences in the final calculations depending on a variety of factors– number of lights, how long the lights and candles are left on and lit, and numerous other variables that differ from household to household. While each assumption will have a citation to where it originated, rest assured that the final answers will still only be general back-of-the-envelope estimates. If one of the numbers or assumptions looks off, please comment below and discuss! Otherwise, just recognize that the goal is to find these rough estimates based on available information and general conclusions that are in the right order of magnitude for the sake of comparison, discussion, and general insight.
Also, it goes without saying that there are many more uses of energy associated with the holidays that are not being accounted for here– especially if you factor in outdoor Christmas lighting (e.g., were you to go as crazy with the outdoor illumination as Clark Griswold, you would be staring at an additional 27.7 kilowatts of additional power usage). This article is ignoring those other uses and is just interested in answering to the average energy use of Christmas trees, Menorahs, and Kinaras, including the range for both the less-efficient and more-efficient options among those three.
Christmas tree and lights
Basic assumptions
To break down the energy and carbon costs of lighting your Christmas tree, a number of very simplified assumptions need to be made about the average Christmas tree and its use. Again, keep in mind that these figures can vary greatly depending on the choices made by the individual household, but we’ll use the following assumptions:
The average height, or most popular height, of a Christmas tree is 7 feet;
Based on the recommendations from Lowes that a 6 to 7 foot tall tree should use 400 to 700 bulbs and from 1000Bulbs.com to use 100 to 200 bulbs per foot of tree (depending on the brightness desired), we’ll assume a standard 100 bulbs per foot of tree for a total of 700 bulbs;
There is no standard number here, but for the sake of calculation we will assume that the Christmas tree lights are on for 5 hours every night, as estimated by Christmas Lights Etc.; and
Much discussion exists out there for how many days a Christmas tree should be up in a house, with some sources estimating the average tree gets put up the first week in December and taken down sometime between Christmas and the New Year. Another traditional time to put up your tree is the first day of Advent, which this year falls on December 3 (coinciding with the first weekend of December). For 2017, we’ll assume families put up their tree on Sunday December 3 (first weekend of December, first day of Advent) and take them down the first weekend after Christmas– Saturday December 30– for a total of 27 nights the tree will be decorated (obviously this is a key variable that can change based on household habits).
Energy use of Christmas lights
For the Christmas lights used, let’s examine two options using traditional incandescent lights and one using more efficient LEDs. The actual wattage of these options will also vary depending on the specific light chosen, but for the sake of calculation we’ll use the following:
As our starting point, we’ll use the top hit on Amazon.com for incandescent Christmas lights. This package comes with 25 bulbs at a power of 7 Watts (W), meaning these lights use 0.280 W/bulb;
We’ll also look at the mini incandescent lights that are more common for interior use on Christmas trees, again selecting the top hit of Amazon.com to serve as our proxy for average and popular wattage. This package comes with 50 bulbs at a power of 20.4 W, or 0.408 W/bulb;
Lastly, we’ll look at the efficient LED Christmas lights that an energy-conscious consumer might choose. Going back to Amazon.com to find the most popular basic LED Christmas light (ignoring those with additional energy-using functionalities like timers and light effects), we find this package that comes with 100 bulbs at 4.8 W for 0.048 W/bulb;
For each of these three types of lights, we can use the same basic formula to calculate the total energy use of the Christmas lights over the course of the holiday season:

Referencing our above assumptions, we plug in the number of bulbs as 700, the hours lit per day as 5, and the days lit as 27. Combining those numbers with the Watts/bulb of the three types of lights previously calculated gives the following energy uses:
Large incandescent lights: 26,460 Watt-hours (Wh), or 26.4 kilowatt-hours (kWh);
Mini incandescent lights: 38,566 Wh, or 38.56 kWh; and
LED lights: 4,536 Wh, or 4.54 kWh.
Carbon emissions of Christmas lights
As described in the post about the energy use and CO2 emissions associated with cooking your Thanksgiving turkey, Department of Energy data indicates that 1.096 pounds (or about 0.497 kilograms (kg)) of CO2 are released for every kWh of electricity produced in the United States (on average, this figure varies based on where consumers live and their power providers’ energy mix). Multiplying each of those figures the energy use of each of the light types by 0.497 kg of CO2/kWh gives the following CO2 emissions from lighting the Christmas tree:
Large incandescent lights: 13.15 kg of CO2;
Mini incandescent lights: 19.17 kg of CO2; and
LED lights: 2.26 kg of CO2.
Putting these numbers together with the energy use data gives the following results for lighting the Christmas tree:

Carbon emissions from the Christmas tree
In addition, the environmental effects of selecting a Christmas tree are something that we can measure and calculate. In fact, a Montreal-based consulting firm put together a life cycle assessment of artificial vs. natural Christmas trees. This analysis will pull out the final numbers they calculated for CO2 emitted, but the entire report is really worth a read.
The life cycle assessment factors in the average life of each type of tree (natural trees have a lifetime use of one holiday season, while artificial trees are used for six years on average before being replaced), how far people travel to get their trees, the CO2 released when a natural tree is properly burned and recycled, the CO2 absorbed by a natural tree while it’s alive, the land occupation and fertilizers required to grow natural trees, the production of artificial trees, the transport of artificial trees from production (oftentimes overseas)to point-of-sale in North America, and more. In the end, the assessment determined that buying a natural Christmas tree accounts for 3.1 kg of CO2 for the year, while purchasing an artificial tree averages out to 8.0 kg of CO2 per year over the course of its six year lifespan.
Adding the artificial and natural tree CO2 emissions to the previously calculated emissions from lighting gives the following environmental and energy impact of your choice of tree and light types:

Note that while it takes energy to produce both a natural and artificial tree, for the sake of this exercise it’s assumed that the effects of that energy use is captured in the CO2 output calculations rather than try to estimate the exact energy use of tree production. Similarly, this analysis only considers the energy used to light the tree and not the energy used or CO2 emitted while manufacturing and transporting the lights, because 1) the information on energy intensity to manufacture and transport the lights is not readily available, and 2) the lights are assumed to be reused over and over again (particularly the LEDs with 25,000 hour bulb life), making the portion of energy to manufacture negligible when distributed over each Christmas season they are used.
Lighting the Hanukkah Menorah
Basic assumptions
To start off the energy and CO2 calculations for the Menorah, we’ll again start with several basic assumptions:
According to tradition, the Menorah is to be lit for at least 30 minutes per night on weeknights and up to one-and-a-half hours on Friday night;
The eight Hanukkah lights can be either candles or oil-fueled flames (electric lights are not allowed), with the preferred oil being olive oil because that was the oil with which the miracle of Hanukkah occurred; and
On the first night of Hanukkah, the Shamash (the attendant candle used to kindle the other flames) is lit along with one other light for the duration of the night’s ceremony. On the second night, the Shamash is lit along with two other flames. On the third night, the Shamash and three other lights are lit, and so forth until the eight night when the Shamash and eight other flames are lit.
Energy use of the Hanukkah lights
For the Hanukkah lights, we’ll examine three different lighting options that are widely used to light the menorah– lamps lit with olive oil, traditional paraffin candles, and the increasingly used and environmentally friendly beeswax candles.
Olive oil lamps
While using olive oil lamps, we’ll assume the burning of the Menorah for 30 minutes per night and 90 minutes on Friday night (which is the fourth night of Hanukkah in 2017). Given that a single wick in olive oil will burn through 0.4 and 0.5 ounces of oil per hour, we’ll assume a burn rate of 0.45 ounces per hour per wick. Counting each individual wick that is lit on a given night separately, the total number of burn minutes is calculated as follows:22 wick-hours times 0.45 ounces of olive oil burned per hour gives a total olive oil burned of 9.9 ounces.

The only data point I could find on the energy content of olive oil comes from Wikipedia, giving an average specific energy of olive oil of 39.535 megajoules (MJ) per kg.
Finally then we can calculate the energy of olive oil burned as the following:

But that’s not it– as previously noted there is on Shamash candle that will also be lit each night in order to kindle the other flames. We’ll assume a standard paraffin candle is used as the Shamash for 30 minutes each night (plus an additional 60 minutes on Friday night) for a total of 300 minutes, or 5 hours. Using the standard energy content of paraffin wax of 42.0 kilojoules (kJ) per gram (g) and a standard burn velocity for paraffin wax of 7.5 g/hour, we calculate the energy in the burning of the Shamash candle each night to be the following:

Adding the Shamash tot he olive oil lamps gives a total energy use of about 3.52 kWh.
Paraffin candles
For the energy use of paraffin candles for all eight of the Hanukkah lights plus the Shamash, we simply use the same assumptions used before.
For the 8 candles lit for a cumulative 22 hours over the course of the Festival of Lights:

Add that to the previously calculated 0.44 kWh for the paraffin Shamash candle, and the total energy use is 2.36 kWh.
Beeswax candles
Calculating the energy use by the beeswax candles follows the same process as the paraffin candles. The difference this time is that beeswax, which is more energy-rich than paraffin but burns more slowly, has an energy content of 12.7 kilocalories per gram, or about 53.14 kJ/g (over 26% higher than paraffin candles) and burns at 4.0 g/hour (over 47% more slowly).
Plugging those values into the calculations at a total of 27 wick-hours (22 from the 8 candles and 5 from the beeswax Shamash) gives the following:

Thus, using all beeswax candles corresponds to an energy use of about 1.59 kWh.
Carbon emissions from lighting the Menorah
To determine the total CO2 emissions associated with our three Menorah light options, we already have a total time of burn and a total amount of fuel that is burned and we just need to line those up with the carbon output associated with the fuel types.
Olive oil lamps
Going back to the Wikipedia page on biofuels, we see that the CO2 content of olive oil as a fuel is 14.03 MJ per kg of CO2. Using this we can calculate the CO2 emitted by the olive oil when burned to be the following:

We also need to factor in the CO2 emitted by the Shamash over the eight nights, which we can calculate based on the knowledge (which was discussed in the Jack-O’-Lantern candle burning post) that paraffin candles emit about 10 grams of CO2 for every hour they are burned.
Since the Shamash is burned for 5 hours, this adds 50 grams (0.05 kg) of CO2 to bring the total up to 2.89 kg of CO2 emitted.
Paraffin candles
The data point of 10 grams of CO2 per hour of paraffin candle burned makes this calculation easy. We already established a total cumulative candle burn time (including the eight candles and one Shamash) of 27 hours, so the total CO2 released is 270 g (0.27 kg) of CO2.
Beeswax candles
Lastly, emission calculations for beeswax candles are even easier, as they are generally considered to emit zero CO2. Beeswax candles are touted as the renewable and green candle for just this reason, and while they do literally release CO2 upon their burning, this is CO2 that was recently absorbed by plants in the atmosphere and then transferred to beeswax. In such instances where the path from CO2 absorption to re-release is so traceable and quick, common carbon accounting practice is to count such products as carbon neutral.
Taken together, the energy and environmental impact of how you light a Menorah is given as follows:

Note that while the production of the candles and oil uses energy and accounts for CO2 emissions, for the sake of this exercise we’ll assume that the effects of that energy use and CO2 emissions are minimal compared with the energy/CO2 content of the fuel itself, rather than try to estimate the energy use of production and transportation. Similarly, the Menorah that is selected by a family is supposed to be ‘the most beautiful one that is within [their] means,’ up to and including Menorahs made out of silver. Because of this tradition, we can assume that a Menorah is reused year after year, possibly even handed down over generations, and the energy and CO2 emissions associated with creating the Menorah are small enough to ignore due to how small they would be on a per year basis.
Lighting the Kwanzaa Kinara
Basic assumptions and calculations
Last but not least is the lighting of the traditional Kinara for Kwanzaa. Kwanzaa is a seven day celebration that also uses the lighting of candles as a celebratory symbol. The Kinara has seven candles (representing the seven principles of Kwanzaa). In similar fashion to the Hanukkah Menorah, the Kinara starts the first day with one candle lit and then proceeds with two candles the second day, three candles the third day, all the way to lighting all seven candles on the seventh and last day of Kwanzaa.
From my research, it does not appear that there is any minimum or standard amount of time that the candles of the Kinara must be lit as there is with the Hanukkah Menorah. However, as a way of estimating the total burn time I looked at the most popular listings for Kwanzaa candles on Amazon.com. One listing had candles that would have a six to eight hour burn time, while another listed a burn time of five to seven hours. From this information, we can assume that the first candle lit (and thus the one that is lit for all seven nights of Kwanzaa) is expected to burn a total of five hours because the candle in the second listing might not have enough fuel to last longer than that. If this first candle is burned for five hours over the seven nights of Kwanzaa, that implies about 43 minutes of burn time per night.
Multiplying by the number of candles lit each night as we did with the Menorah, we get the following:

These candles can again be made either of paraffin or beeswax. Without going through the step-by-step calculations again (just refer to the Hanukkah calculations for reference), the choice of candles would result in the following energy and CO2 numbers:
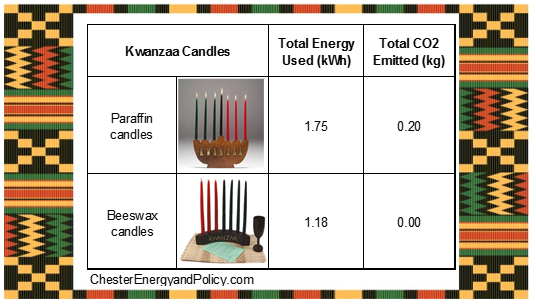
Note that while the production of the candles and oil uses energy and accounts for CO2 emissions, for the sake of this exercise we’ll assume that the effects of that energy use and CO2 emissions are minimal compared with the energy/CO2 content of the fuel itself, rather than try to estimate the exact energy of candle production and transportation. Similarly to the Menorah, we’ll also assume that a Kinara is going to be reused year after year and as such the energy and CO2 emissions associated with creating the Kinara can be ignored because of how small it would end up on a per year basis.
Comparison
Just because plotting and comparing numbers after all these calculations is interesting and fun, let’s see how the energy use and CO2 emissions of the various options among the three holidays discussed look on a graph:

Obviously this graph shows that the Christmas tree comes in (ironically) as the least green among the three holiday decorative centerpieces, which is unsurprising considering its the largest, the one lit the most hours per night and most nights during the season, and the type of fuel required to light it (electricity vs. wax or oil).
If we zoom in on the cluster of Menorahs and Kinaras to get a better view of these options, it looks like this:

Even the most sustainable Christmas tree option (using LED lights and a natural tree) come out as less energy- and environmentally-friendly than any of the options of Menorahs and Kinaras. When looking at just Menorahs and Kinaras, olive oil is a less sustainable choice compared with candles, the type of candles make a measurable (though in the end not entirely significant) difference, and, by virtue of needing seven candles instead of nine while lasting only seven days instead of eight, the Kinara ends the holiday season more sustainable than the Menorah.
Conclusion
So what was the point of doing this– should you not put up a Christmas tree or should you not observe the holidays because of the energy implications? Of course not– while these celebrations all have an energy and environmental impact, that’s not a reason to abstain from them. Looking at it all like this is just an interesting exercise. If you do find any of the numbers here alarming, then you can definitely take them to heart and switch to the more environmentally-friendly options– buy natural trees instead of artificial trees, use LED Christmas lights instead of incandescent, or switch from paraffin candles to beeswax candles.
And hey, if any additional use of energy or cause of CO2 emissions nags at you as you sip cocoa by the fire, keep in mind that there is an alternative holiday you can observe that accounts for no energy use or emissions. All you need is a non-decorated aluminum pole and the desire to air your grievances and overcome the feats of strength.

Source: Pinterest
Whatever holiday you observe and however you choose to celebrate– take time to reflect on what the holiday season means, give back to those less fortunate, and share in the joy of being with your family.
Have a happy holiday season!
If you enjoyed this post and you would like to get the newest posts from the Chester Energy and Policy blog delivered straight to your inbox, please consider subscribing today.
If this article on the winter holidays and energy use/CO2 emissions appeals to you, check out my other holiday themed articles for Halloween, Thanksgiving, St. Patrick’s Day, and New Years Eve.
Sources and additional reading
Comparative Life Cycle Assessment (LCA) of Artificial vs. Natural Christmas Tree: ellipsos
Earth Hour 2013: Does It Really Save Energy? CSMonitor
Energy Content of Biofuel: Wikipedia
How Many Christmas Lights for Christmas Trees? 1000Bulbs.com
How Much Does It Cost To Power Your Christmas Lights? Wired
How to Decorate a Christmas Tree: Lowes
How to Light the Menorah: Chabad.org
How to Make Your Own Olive Oil Lamp: Instructables
Lighting the Kwanzaa Kinara: Holidays.net
So, How Much Electricity Do Christmas Lights Use? Christmas Lights Etc.
State Electricity Profiles: Energy Information Administration
The Energy Content of Fuels: University of Virginia
Tips and Tricks for Using Oil Lamps: Preparedness Pro
Weird Questions About Beeswax: Beesource
When Should You Put Up the Christmas Tree? Professor’s House